-

Figure 1.
Fractionation schematic of fresh egg yolk to obtain the yolk fractions (red) used in this study.
-
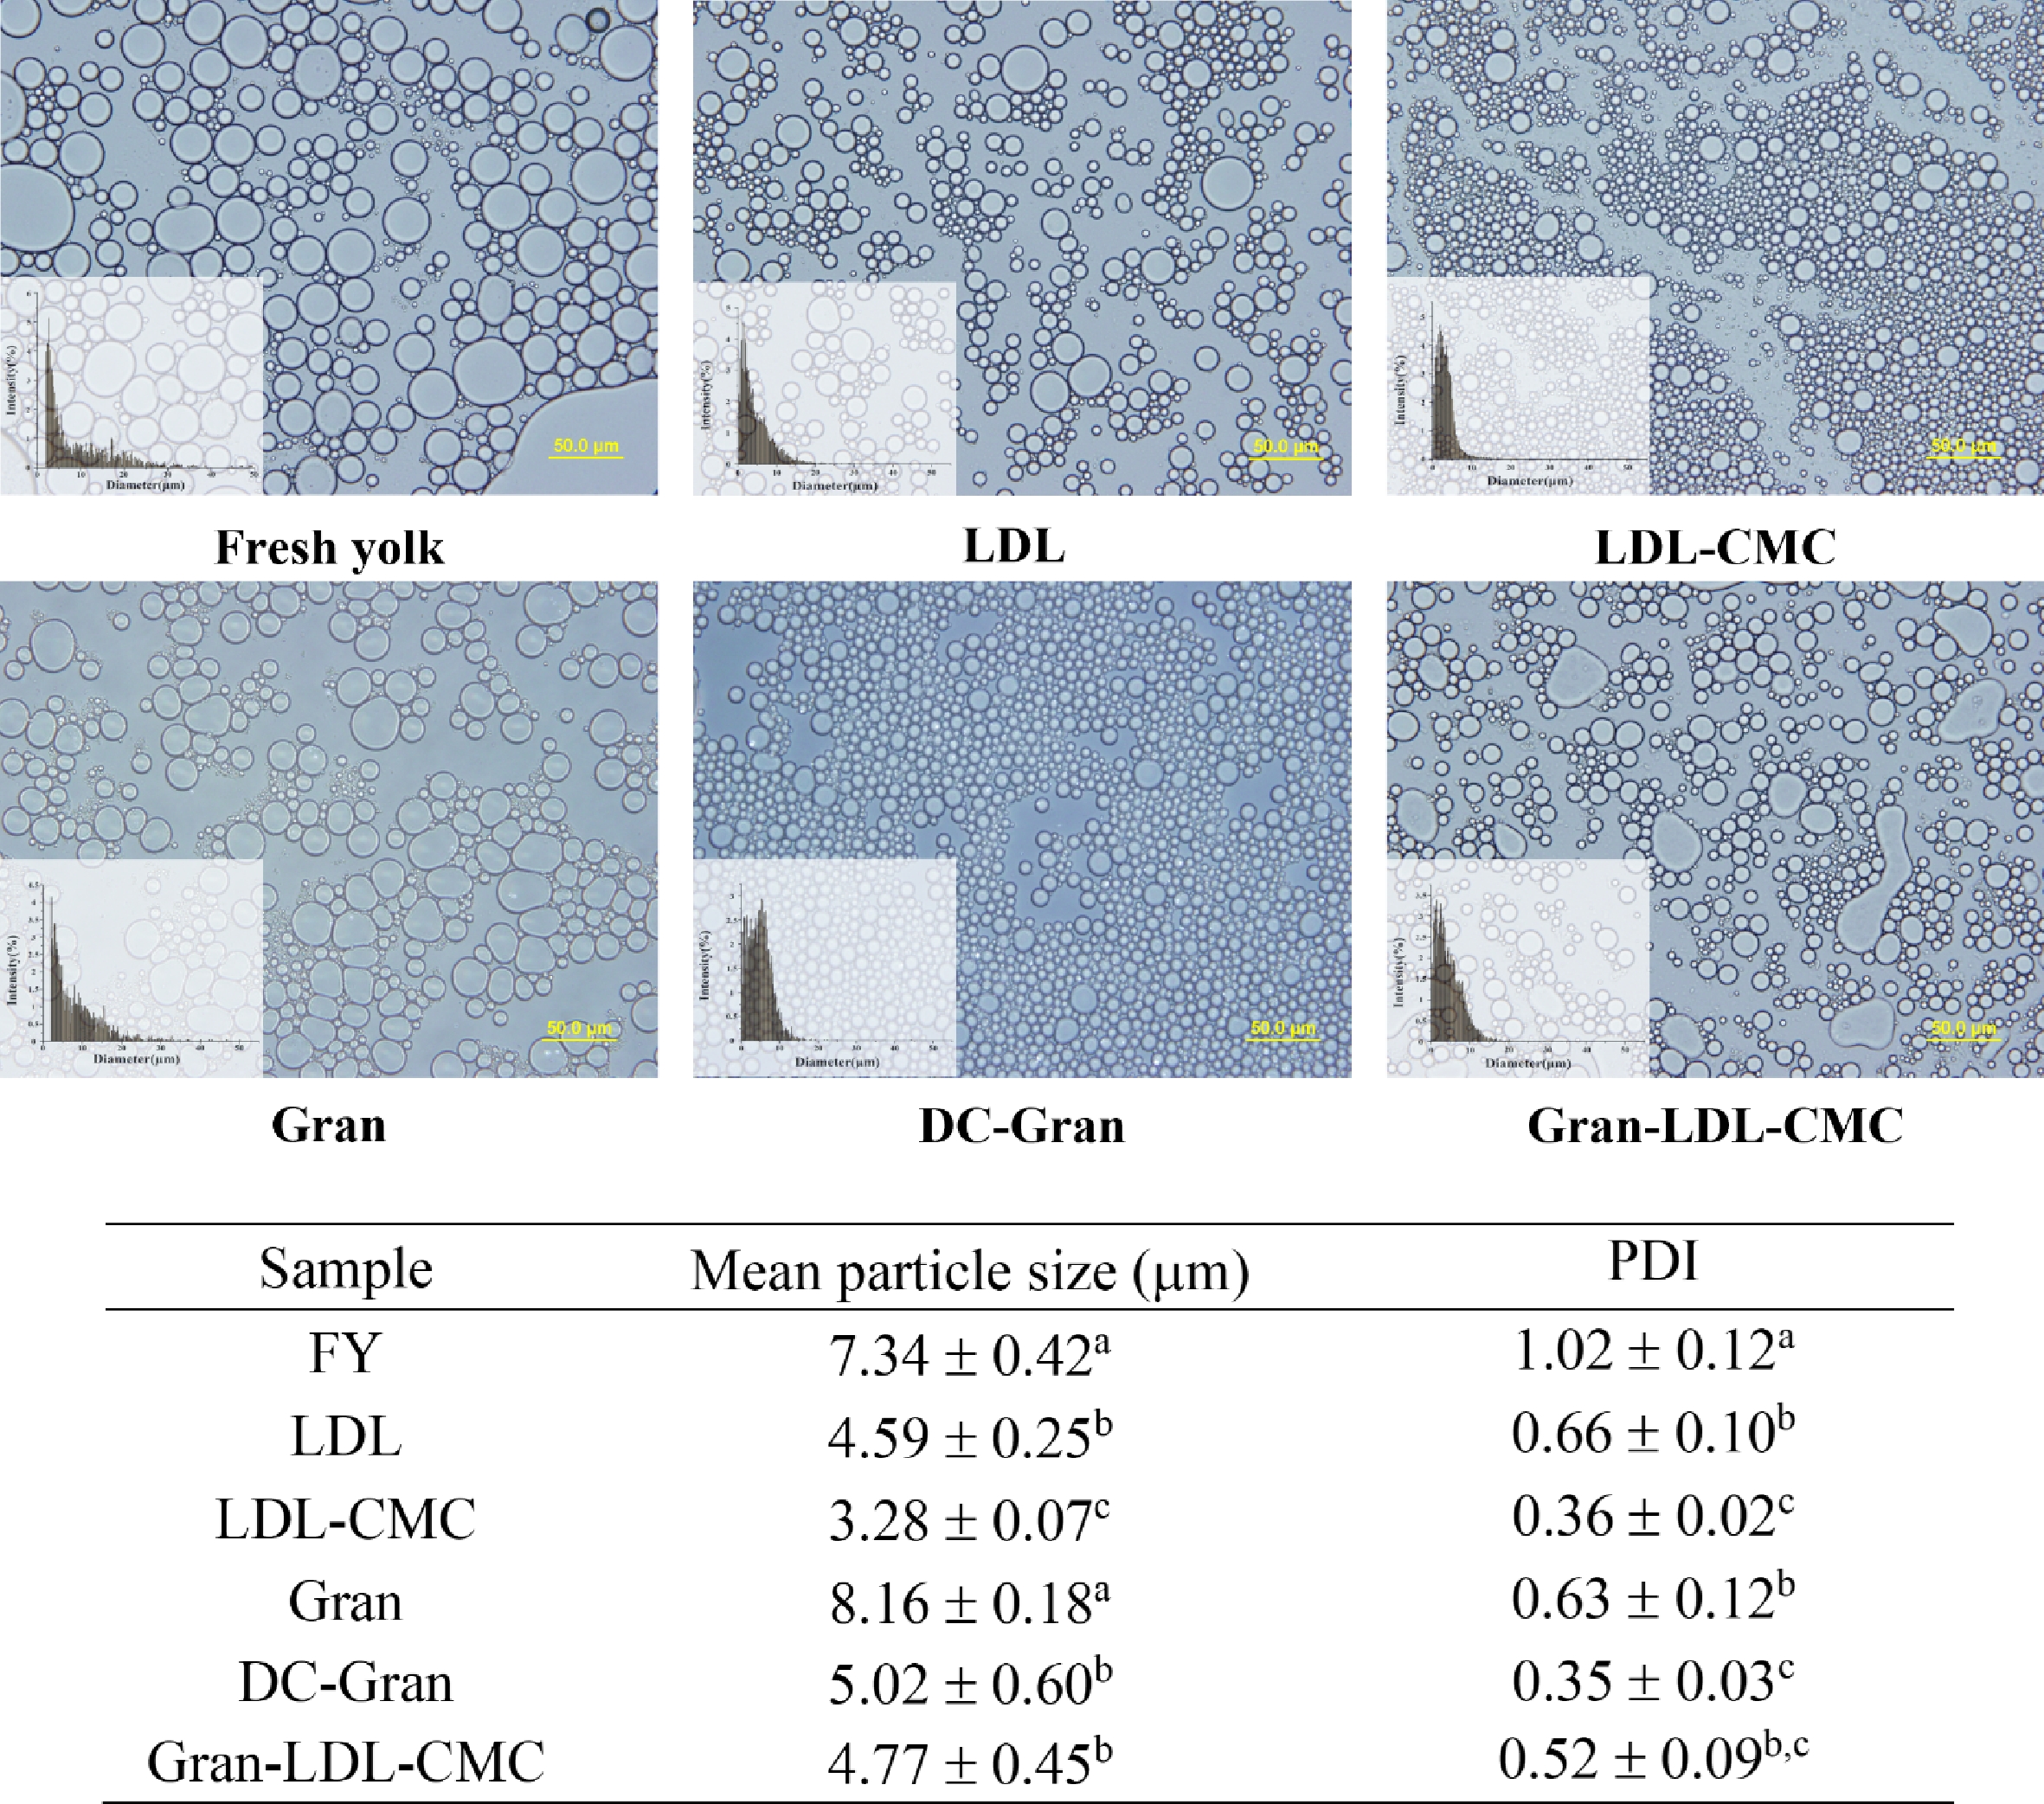
Figure 2.
Bright field optical microscopic images of mayonnaises at 40× magnification, mean particle size of mayonnaise droplets, and polydispersity index (PDI). Scale bar = 50 μm. Values with different superscripts are significantly different within the same column (P < 0.05).
-

Figure 3.
Confocal microscopy images of native and de-calcium granular fractions stained with Nile Red (lipid) and Fast Green FCF (protein). Scale bar = 20 µm.
-
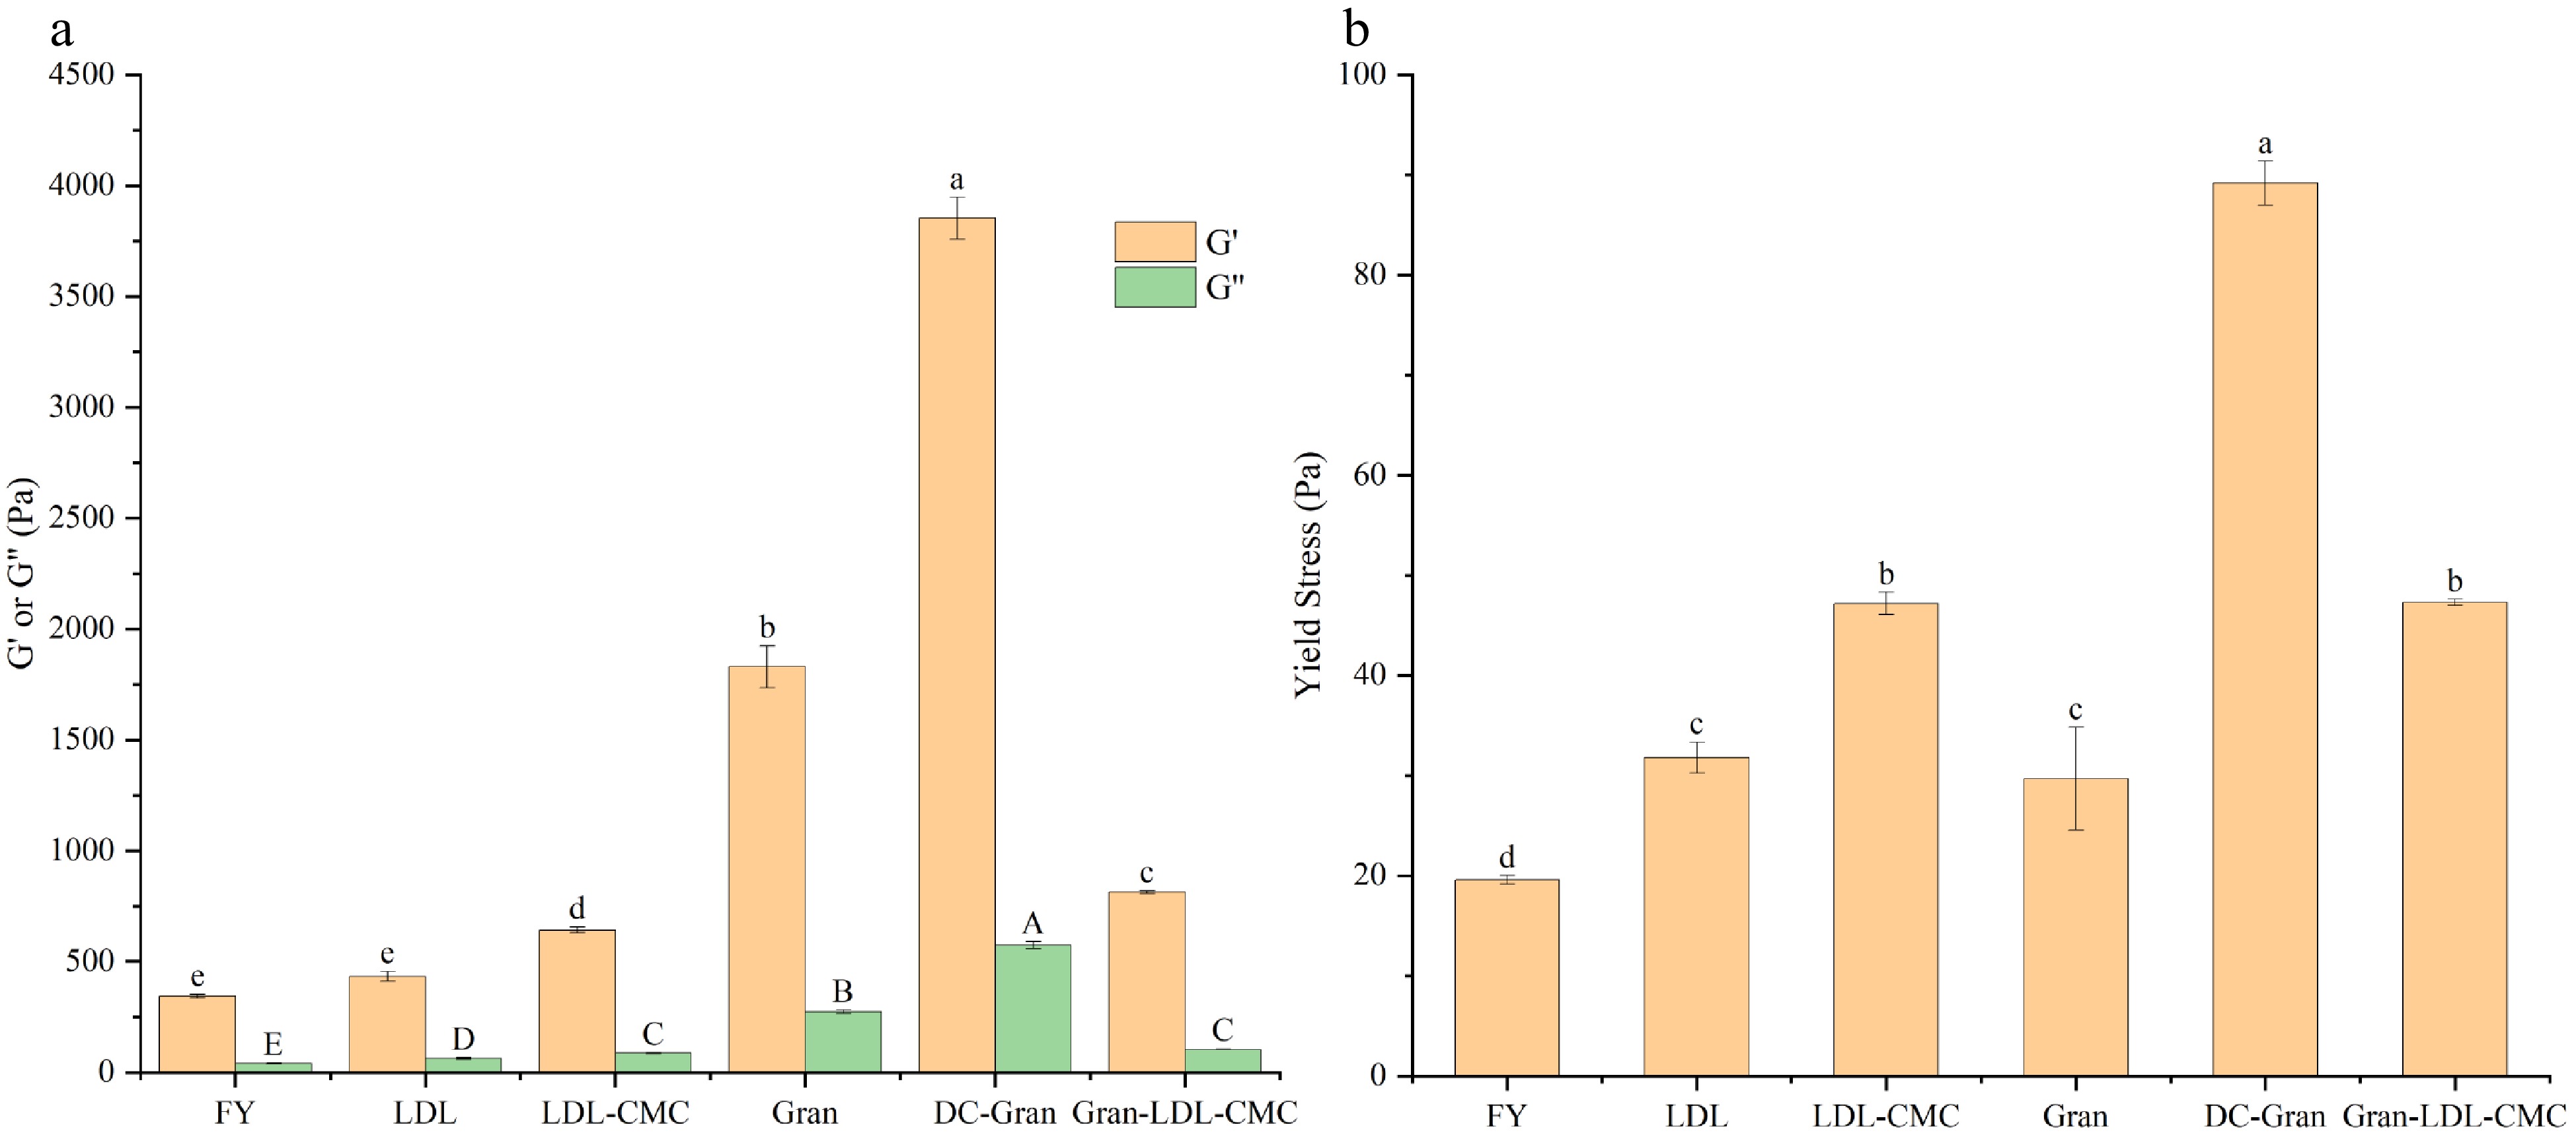
Figure 4.
Viscoelasticity of mayonnaises. (a) Average storage modulus (G') and loss modulus (G'') within the linear viscoelastic region (LVR). (b) Static yield stress. Bars with different letter are statistically different (P < 0.05) within the same chart and parameter.
-
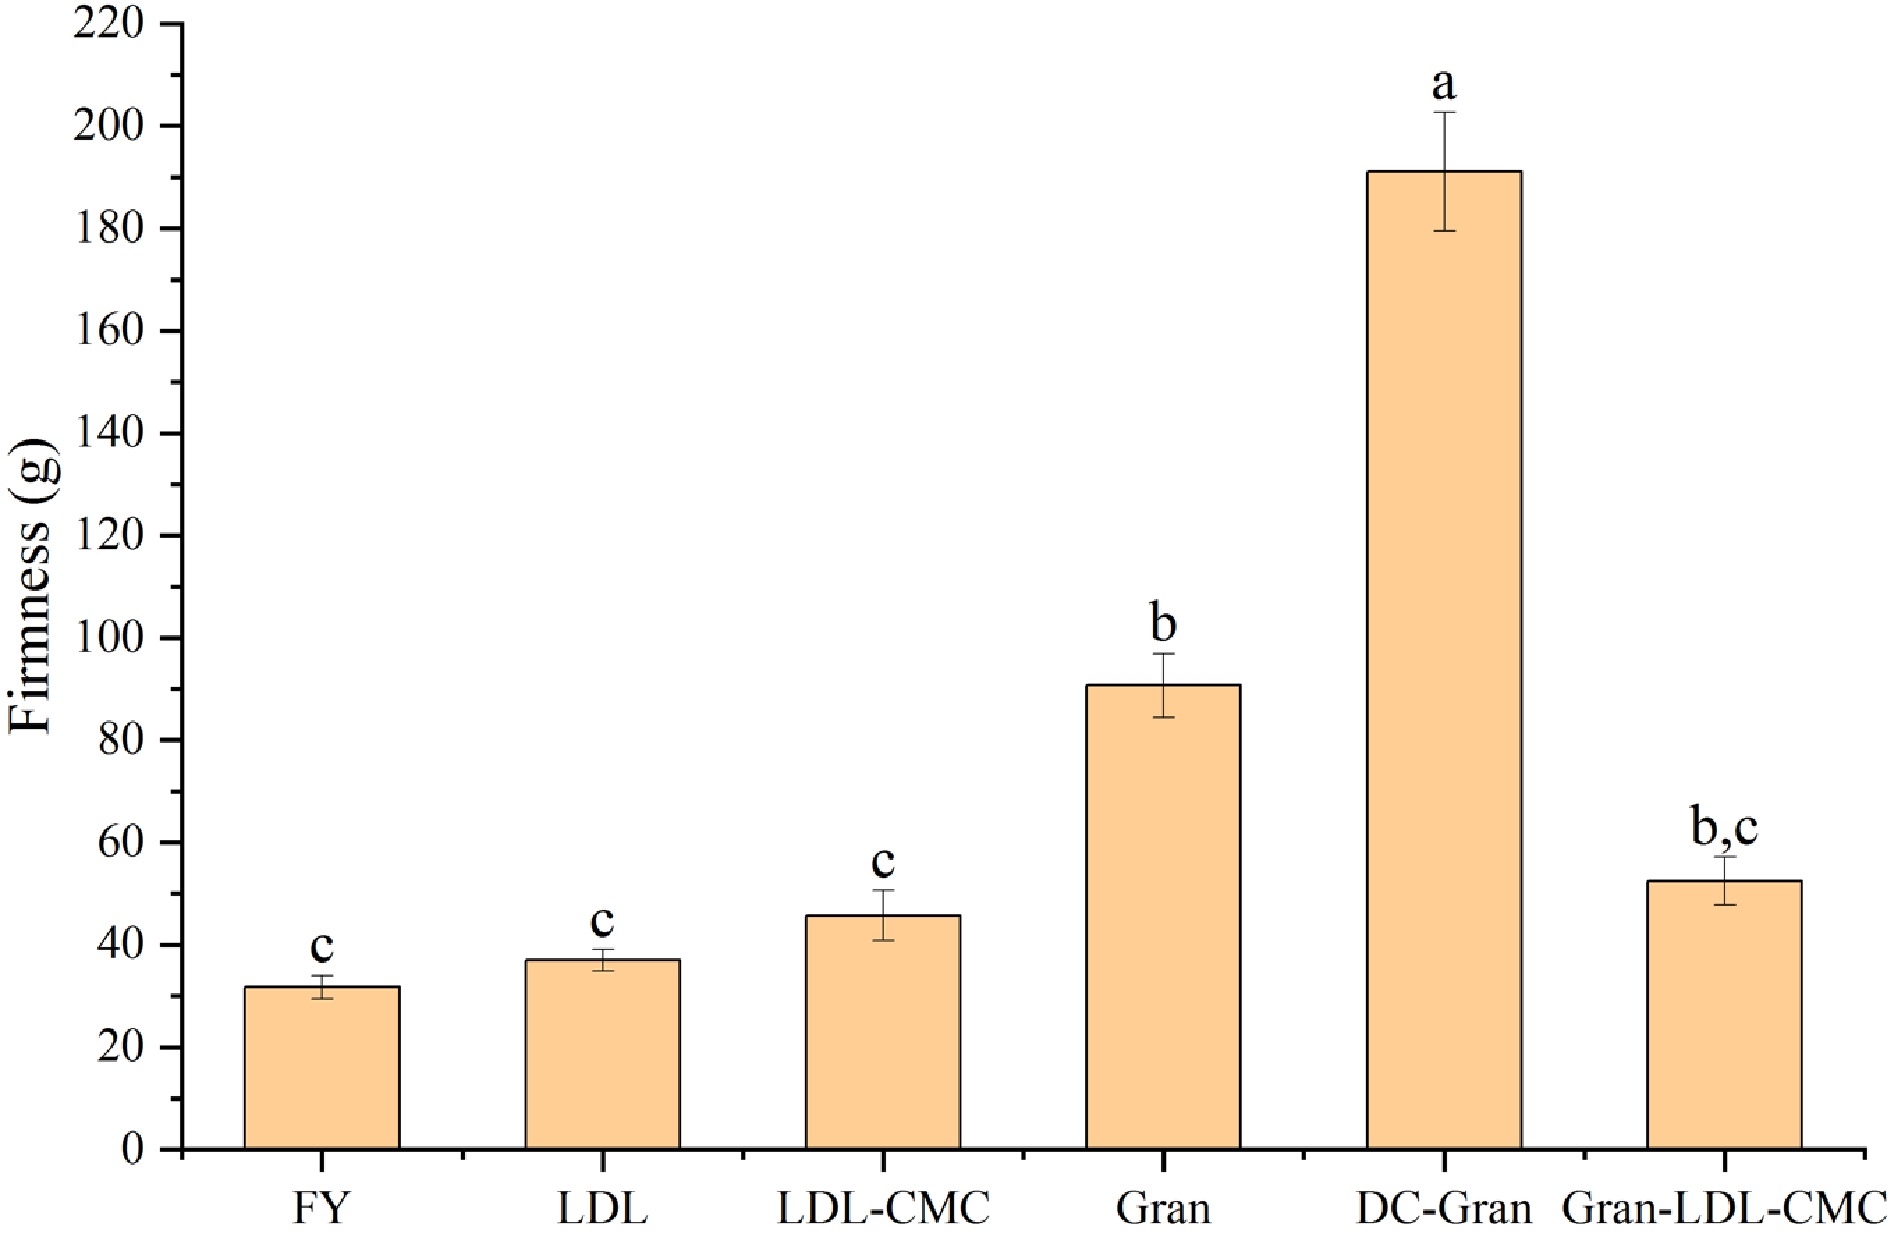
Figure 5.
Firmness values of mayonnaises determined by penetration test. Bars with different letters are statistically different (P < 0.05).
-
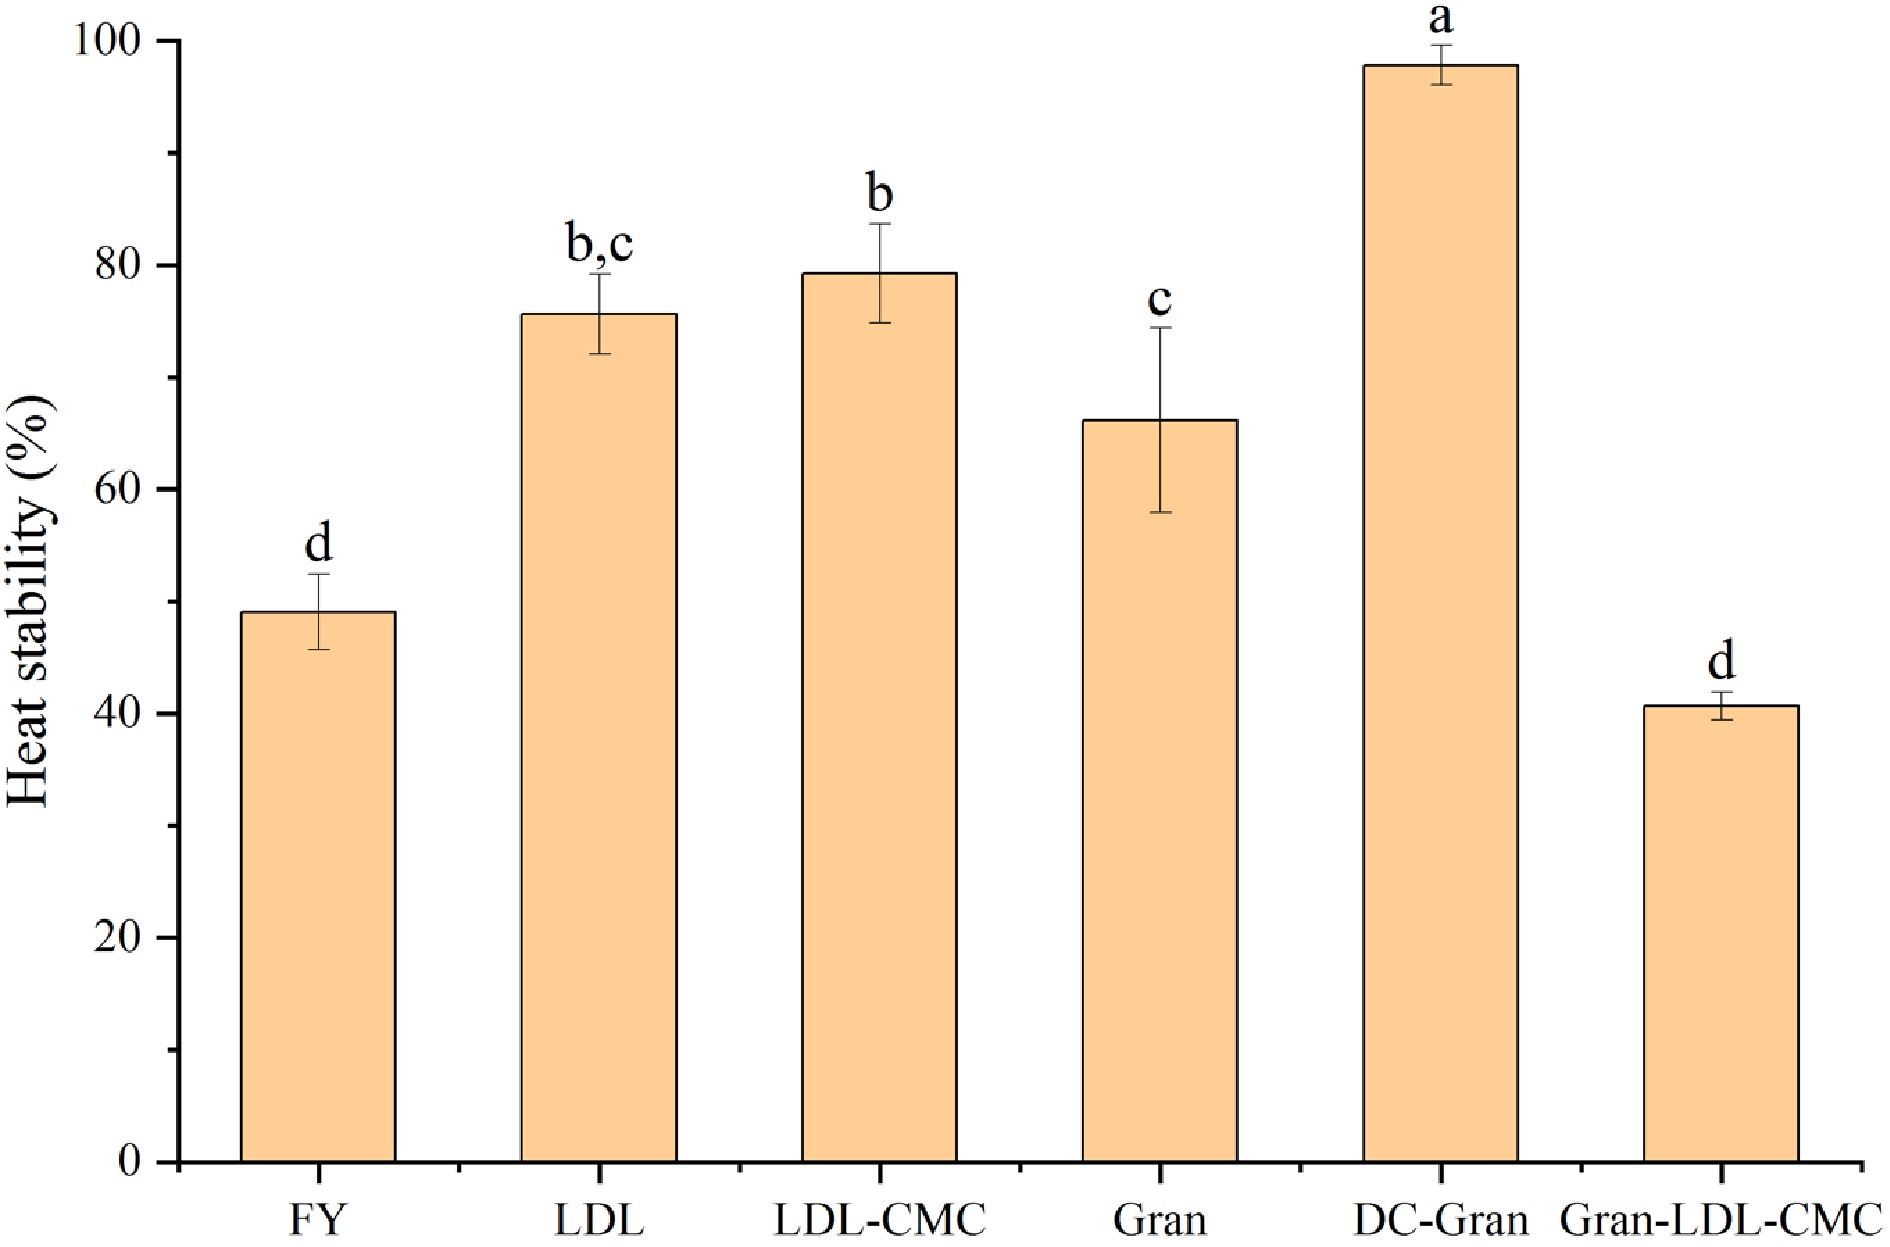
Figure 6.
Heat stability of mayonnaises prepared with different fractionated egg yolk components. Bars with different letters are statistically different (P < 0.05).
-

Figure 7.
Solubility of granular products (Gran and DC-Gran) under pH 2-12.
-
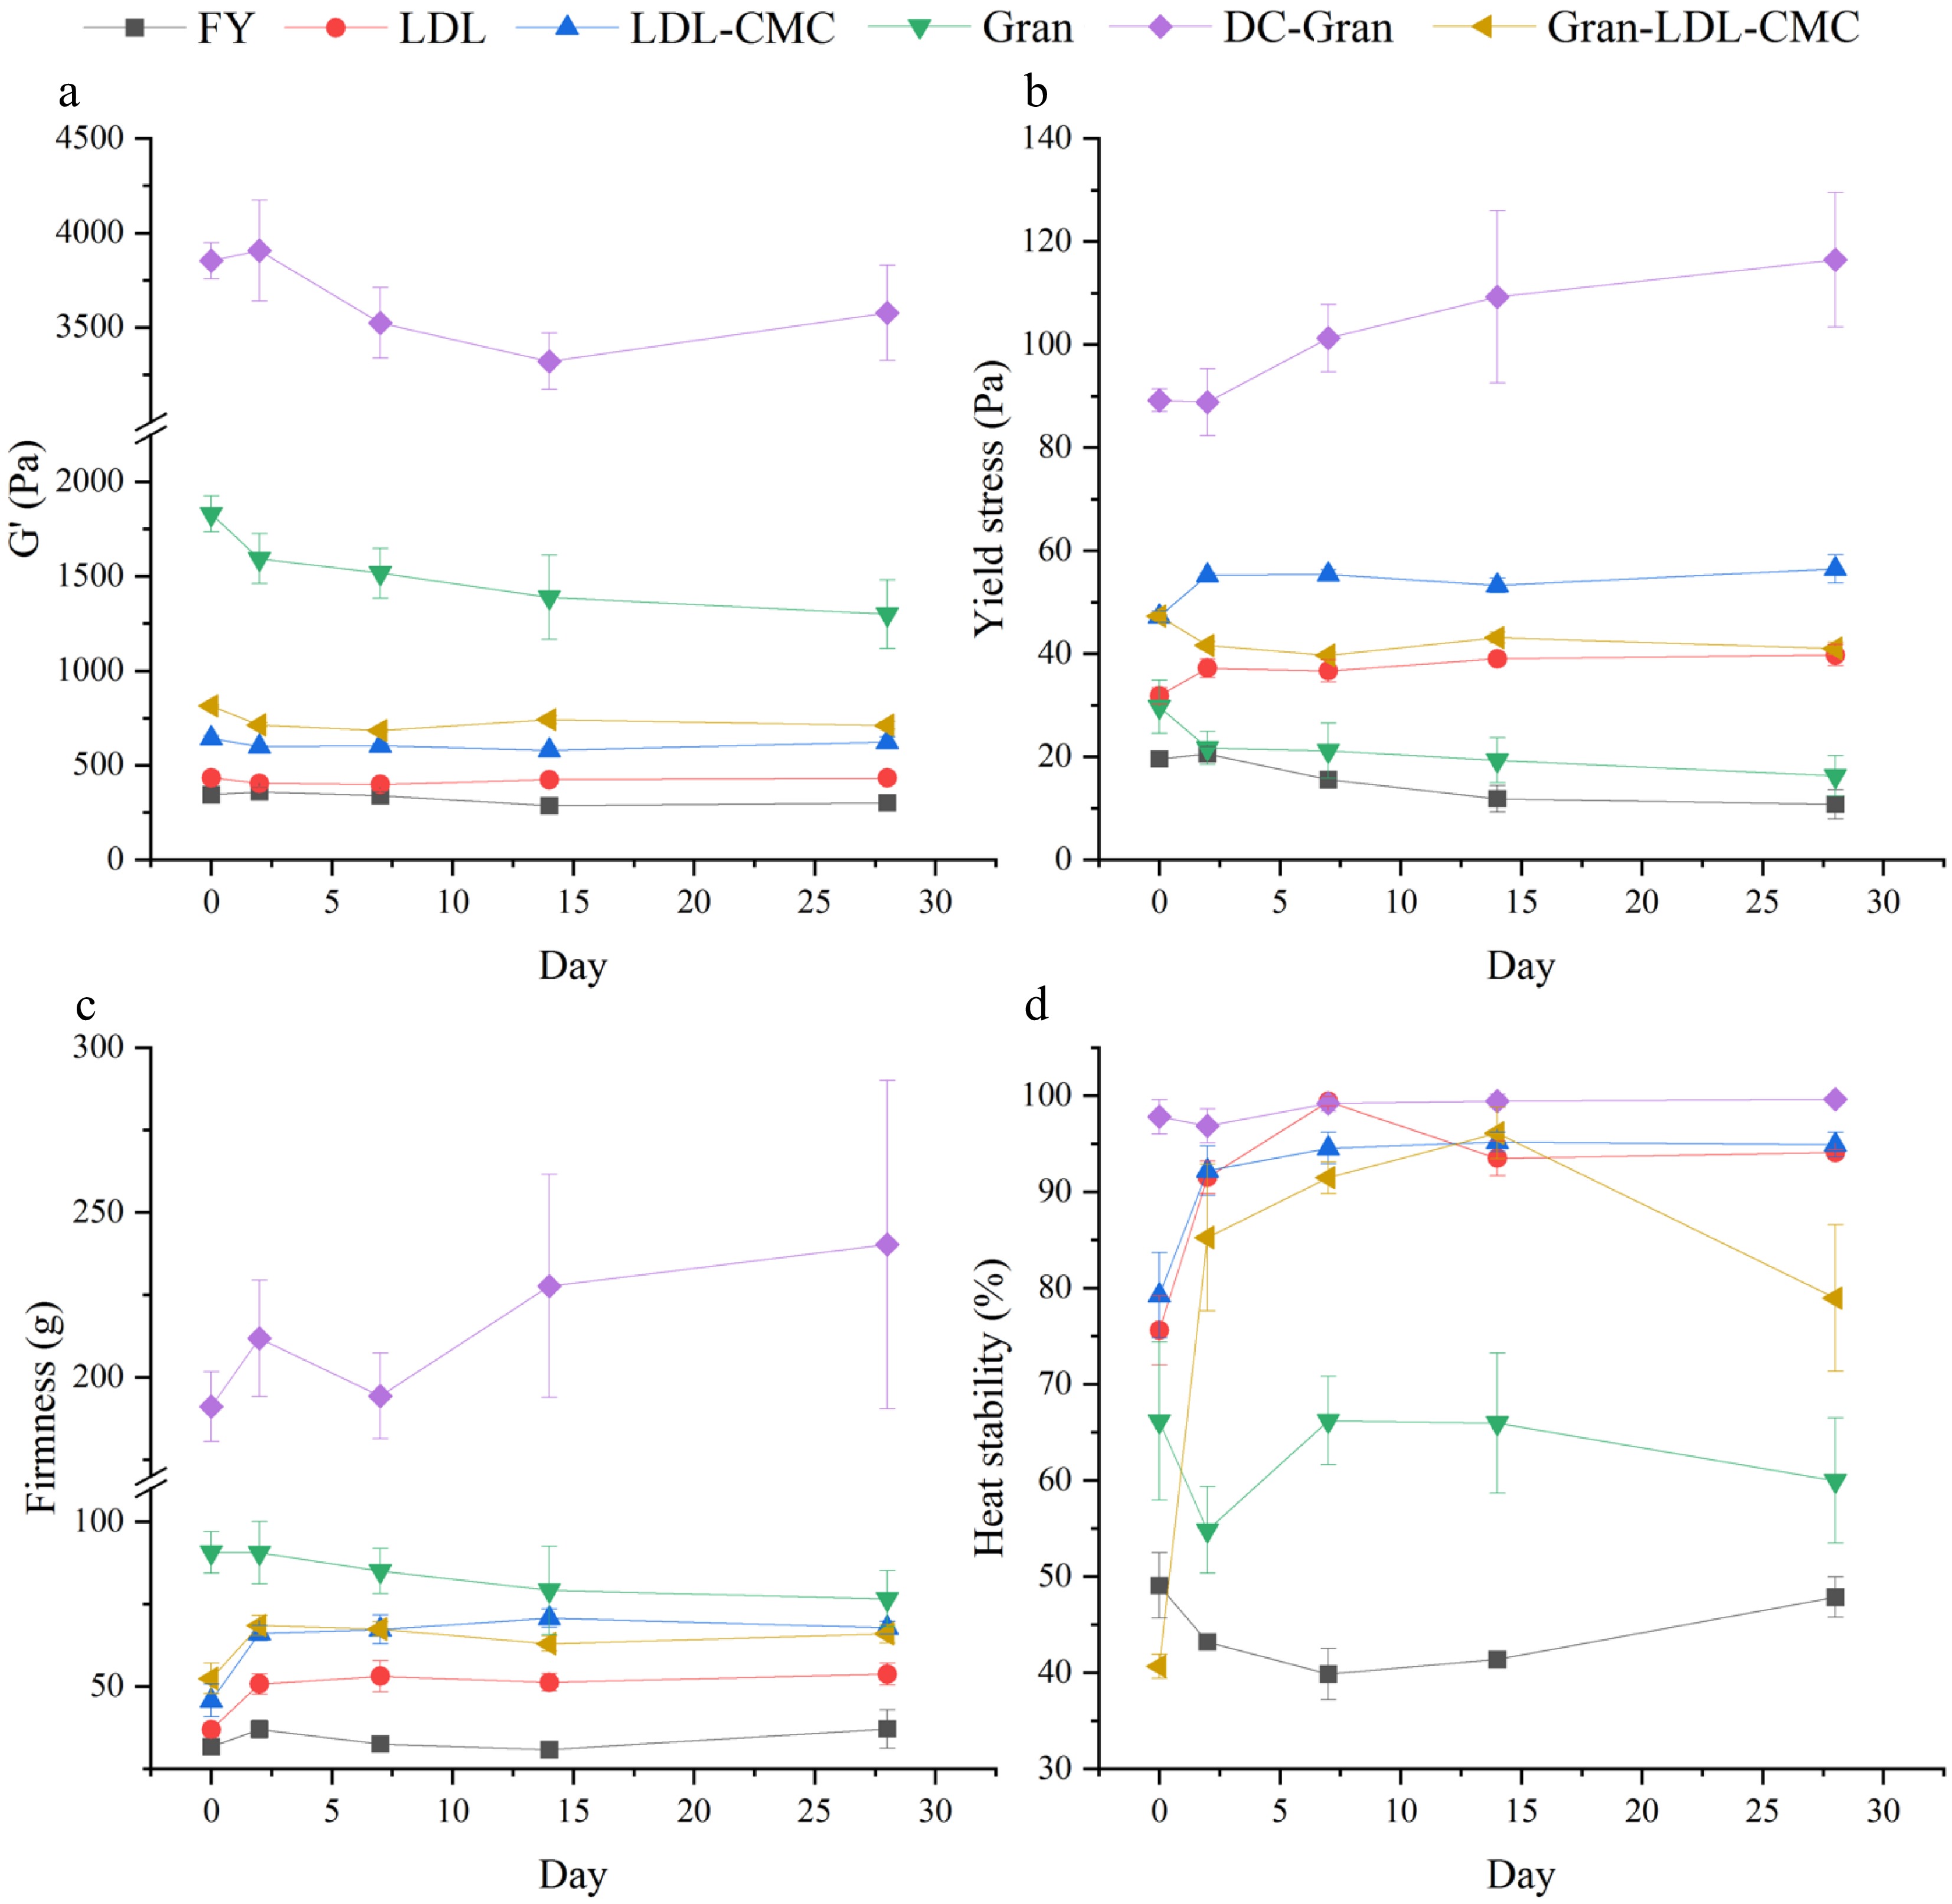
Figure 8.
Changes in mayonnaise properties upon storage at 4 °C. (a) Storage modulus (G'). (b) Static yield stress. (c) Firmness. (d) Heat stability.
-
Sample Egg products (g) Water (g) Oil (g) Vinegar (g) Salt (g) Sugar (g) FY 24.0 25.5 234.0 9.0 4.5 3.0 LDL 47.1 2.4 LDL-CMC 26.3 23.2 Gran 27.7 21.8 DC-Gran 31.0 18.5 Gran-LDL-CMC Gran: 6.1
LDL-CMC: 20.522.9 Defatted LDL 13.5 36.0 FY: Fresh yolk; Gran: native granular fraction; DC-Gran: de-calcium granular fraction; LDL: low-density lipoprotein; CMC: carboxymethyl cellulose. Table 1.
Ingredients used for mayonnaise preparation.
-
Sample Protein
(%, w/w) (d.b.)Lipid
(%, w/w) (d.b.)Phospholipids
(%, w/w) (d.b.)FY 33.0 62.5 20.6 Gran 64.0 31.0 11.1 LDL 10.0 88.0 23.8 Gran-LDL-CMC 21.4 76.0 21.1 d.b.: dry weight basis. Composition was calculated based on yolk, granule and plasma composition summarized by Anton (1997[11]; 2006[37]; 2007[38]) and solid content of each product. Table 2.
Composition of egg yolk ingredients relative to the total solid content.
-
Sample $\iota $ 

K (Pa.s) n FY 17.5 ± 2.8c 45.1 ± 5.3b 0.24 LDL 23.6 ± 6.9c 100.2 ± 11.8a 0.19 LDL-CMC 44.4 ± 2.3c 118.1 ± 8.8a 0.23 Gran 98.6 ± 15.5b 117.9 ± 25.1a 0.18 DC-Gran 204.2 ± 36.6a 120.9 ± 32.0a 0.24 Gran-LDL-CMC 46.6 ± 5.9c 116.5 ± 3.6a 0.19 Within the same column, values with different superscripts are significantly different (P < 0.05). Table 3.
Herschel-Bulkley model parameters of mayonnaise samples measured at 20 °C.
-
Sample A z FY 292.3 ± 17.8e 11.8 ± 0.7a LDL 378.1 ± 3.4d,e 10.4 ± 0.0b LDL-CMC 540.9 ± 16.0c,d 11.5 ± 0.2a Gran 1,370.6 ± 93.3b 9.7 ± 0.4b,c DC-Gran 3,427.4 ± 170.9a 9.3 ± 0.20c Gran-LDL-CMC 707.0 ± 50.7c 12.3 ± 0.3a Within the same columns, values with different superscripts are significantly different (P < 0.05). Table 4.
Power law parameters for mayonnaise samples.
Figures
(8)
Tables
(4)