-
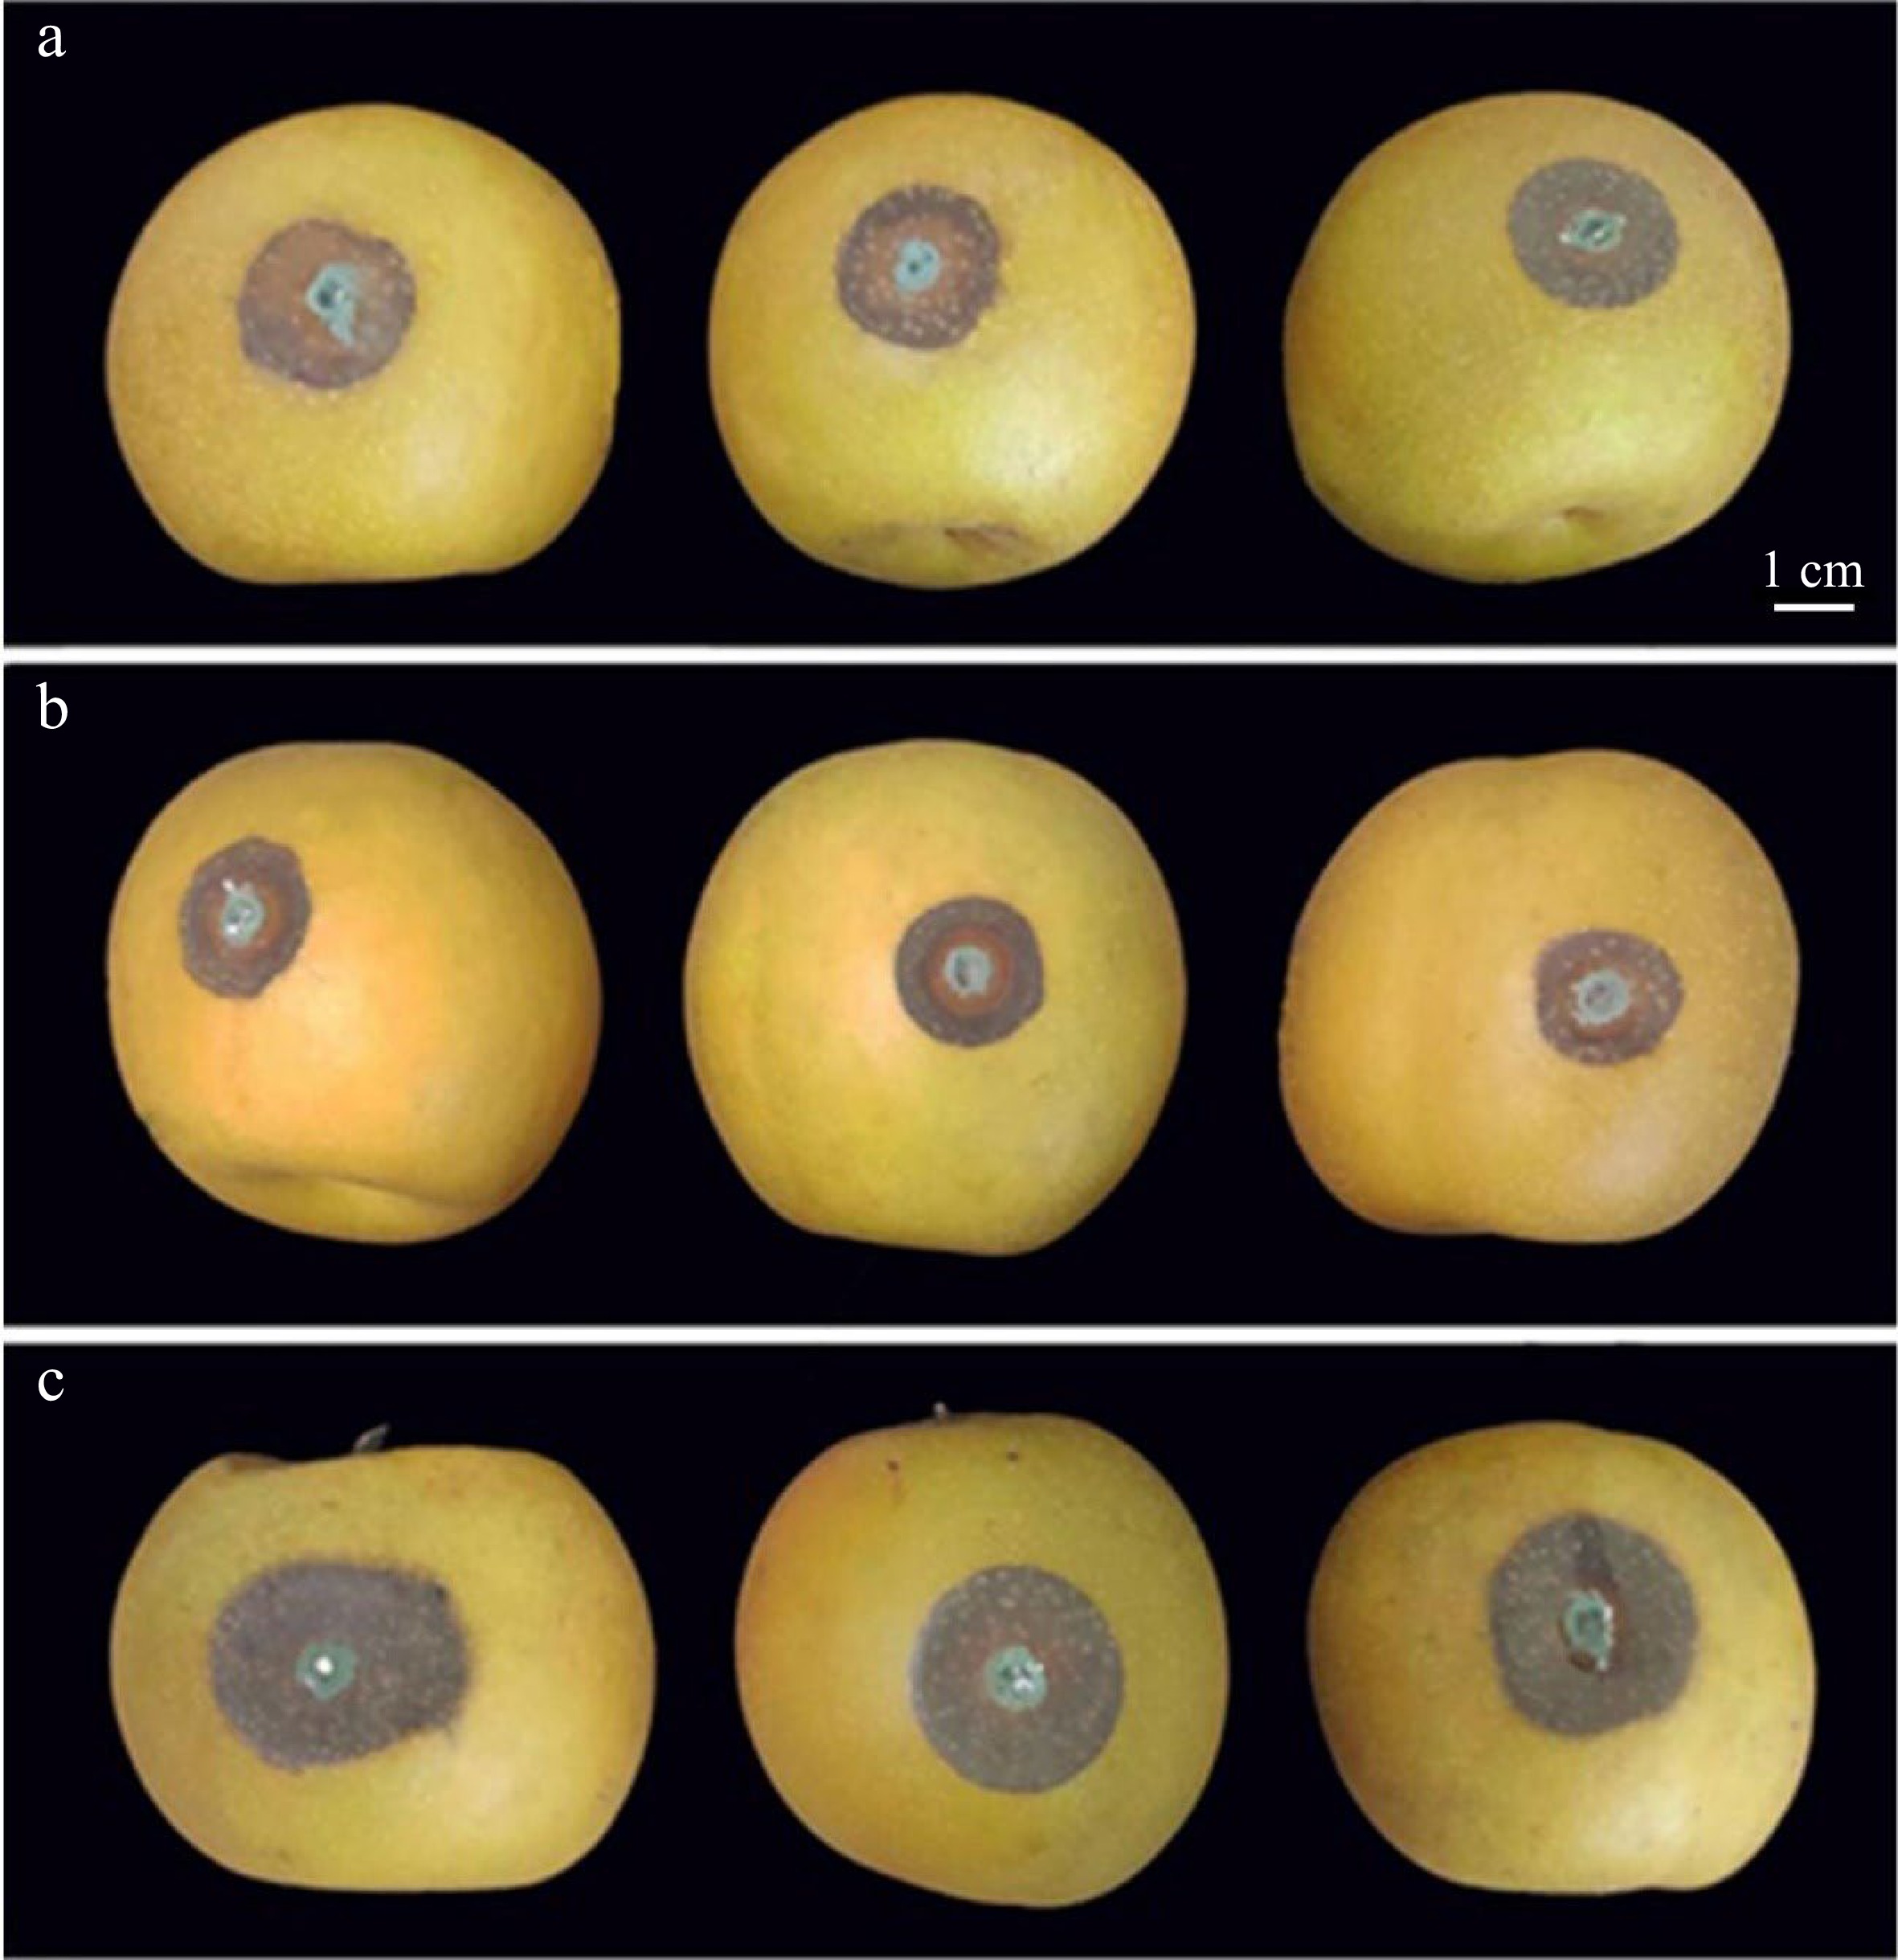
Figure 1.
Symptoms in pear fruit of methyl jasmonate (MeJA) and salicylhydroxamic acid (SHAM) treatment followed by inoculation with Penicillium expansum. (a) Control; (b) 100 μmol/L MeJA treatment; (c) 100 μmol/L SHAM treatment. For experimental details see the Materials and Methods.
-
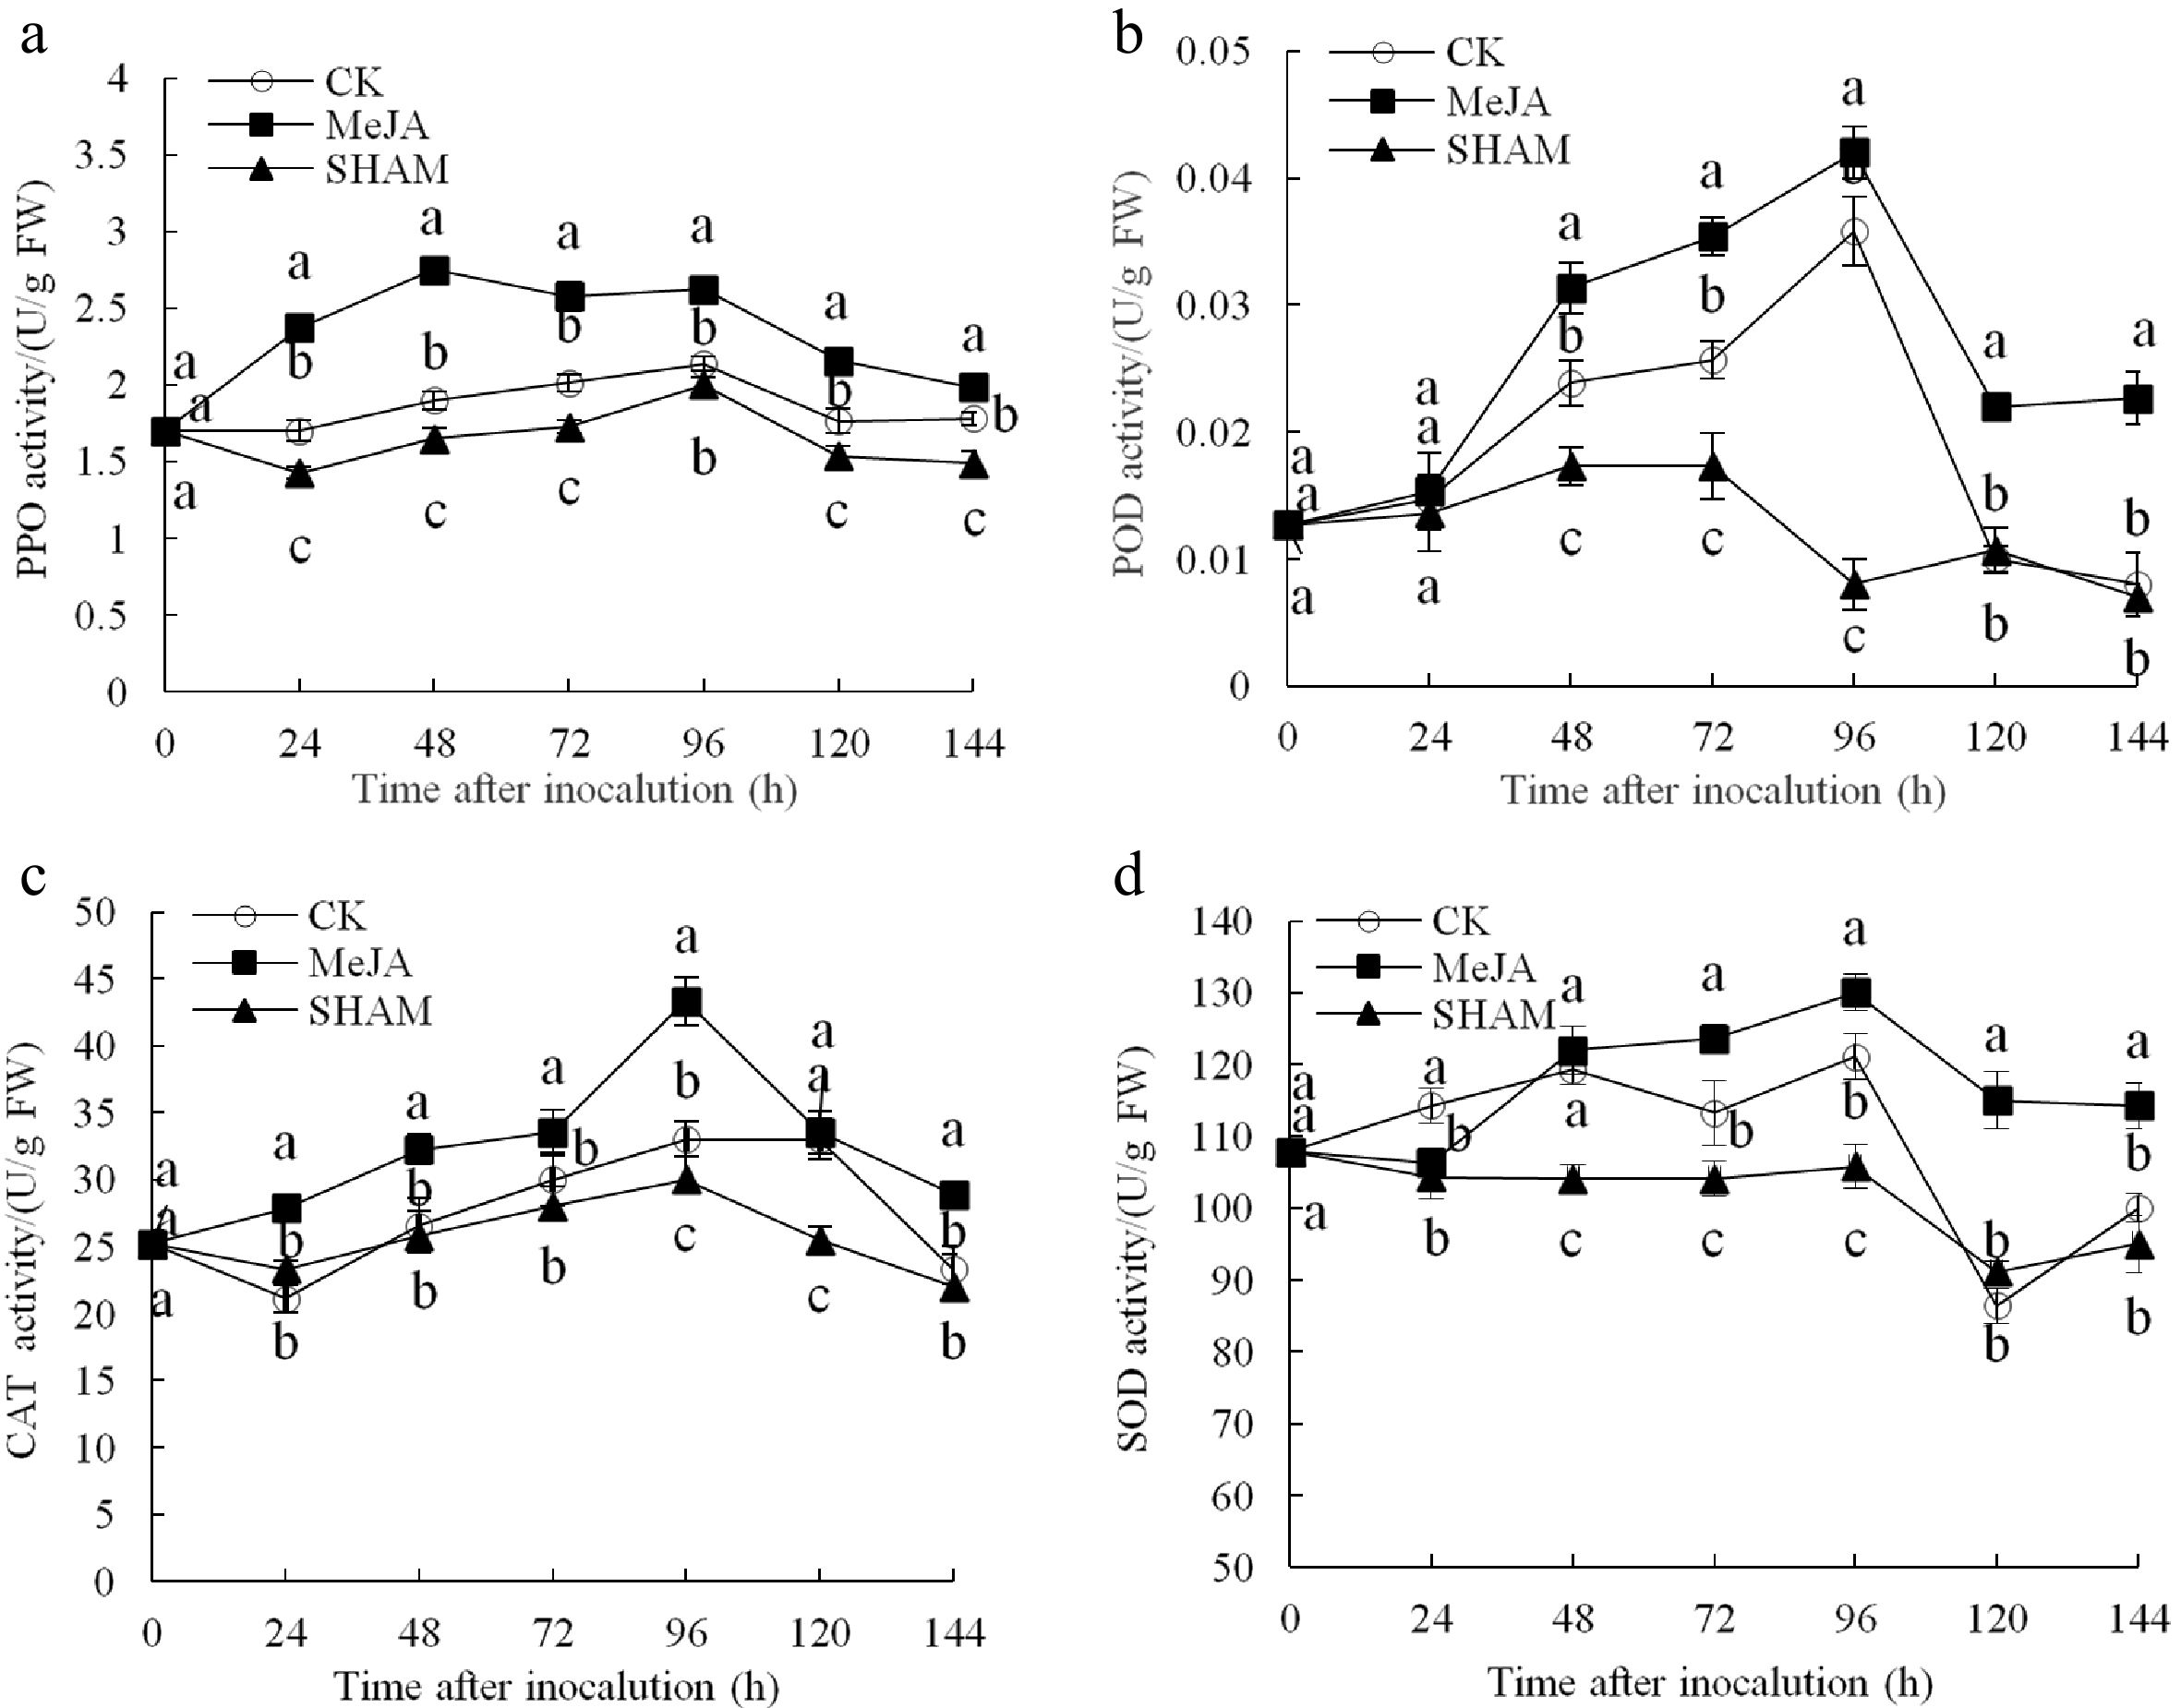
Figure 2.
Changes in the activities of PPO (a), POD (b), CAT (c) and SOD (d) in pear fruit inoculated with Penicillium expansum after 100 μmol/L MeJA treatment for 36 h. Values are the means of three replicates and vertical bars indicate the standard errors.
-
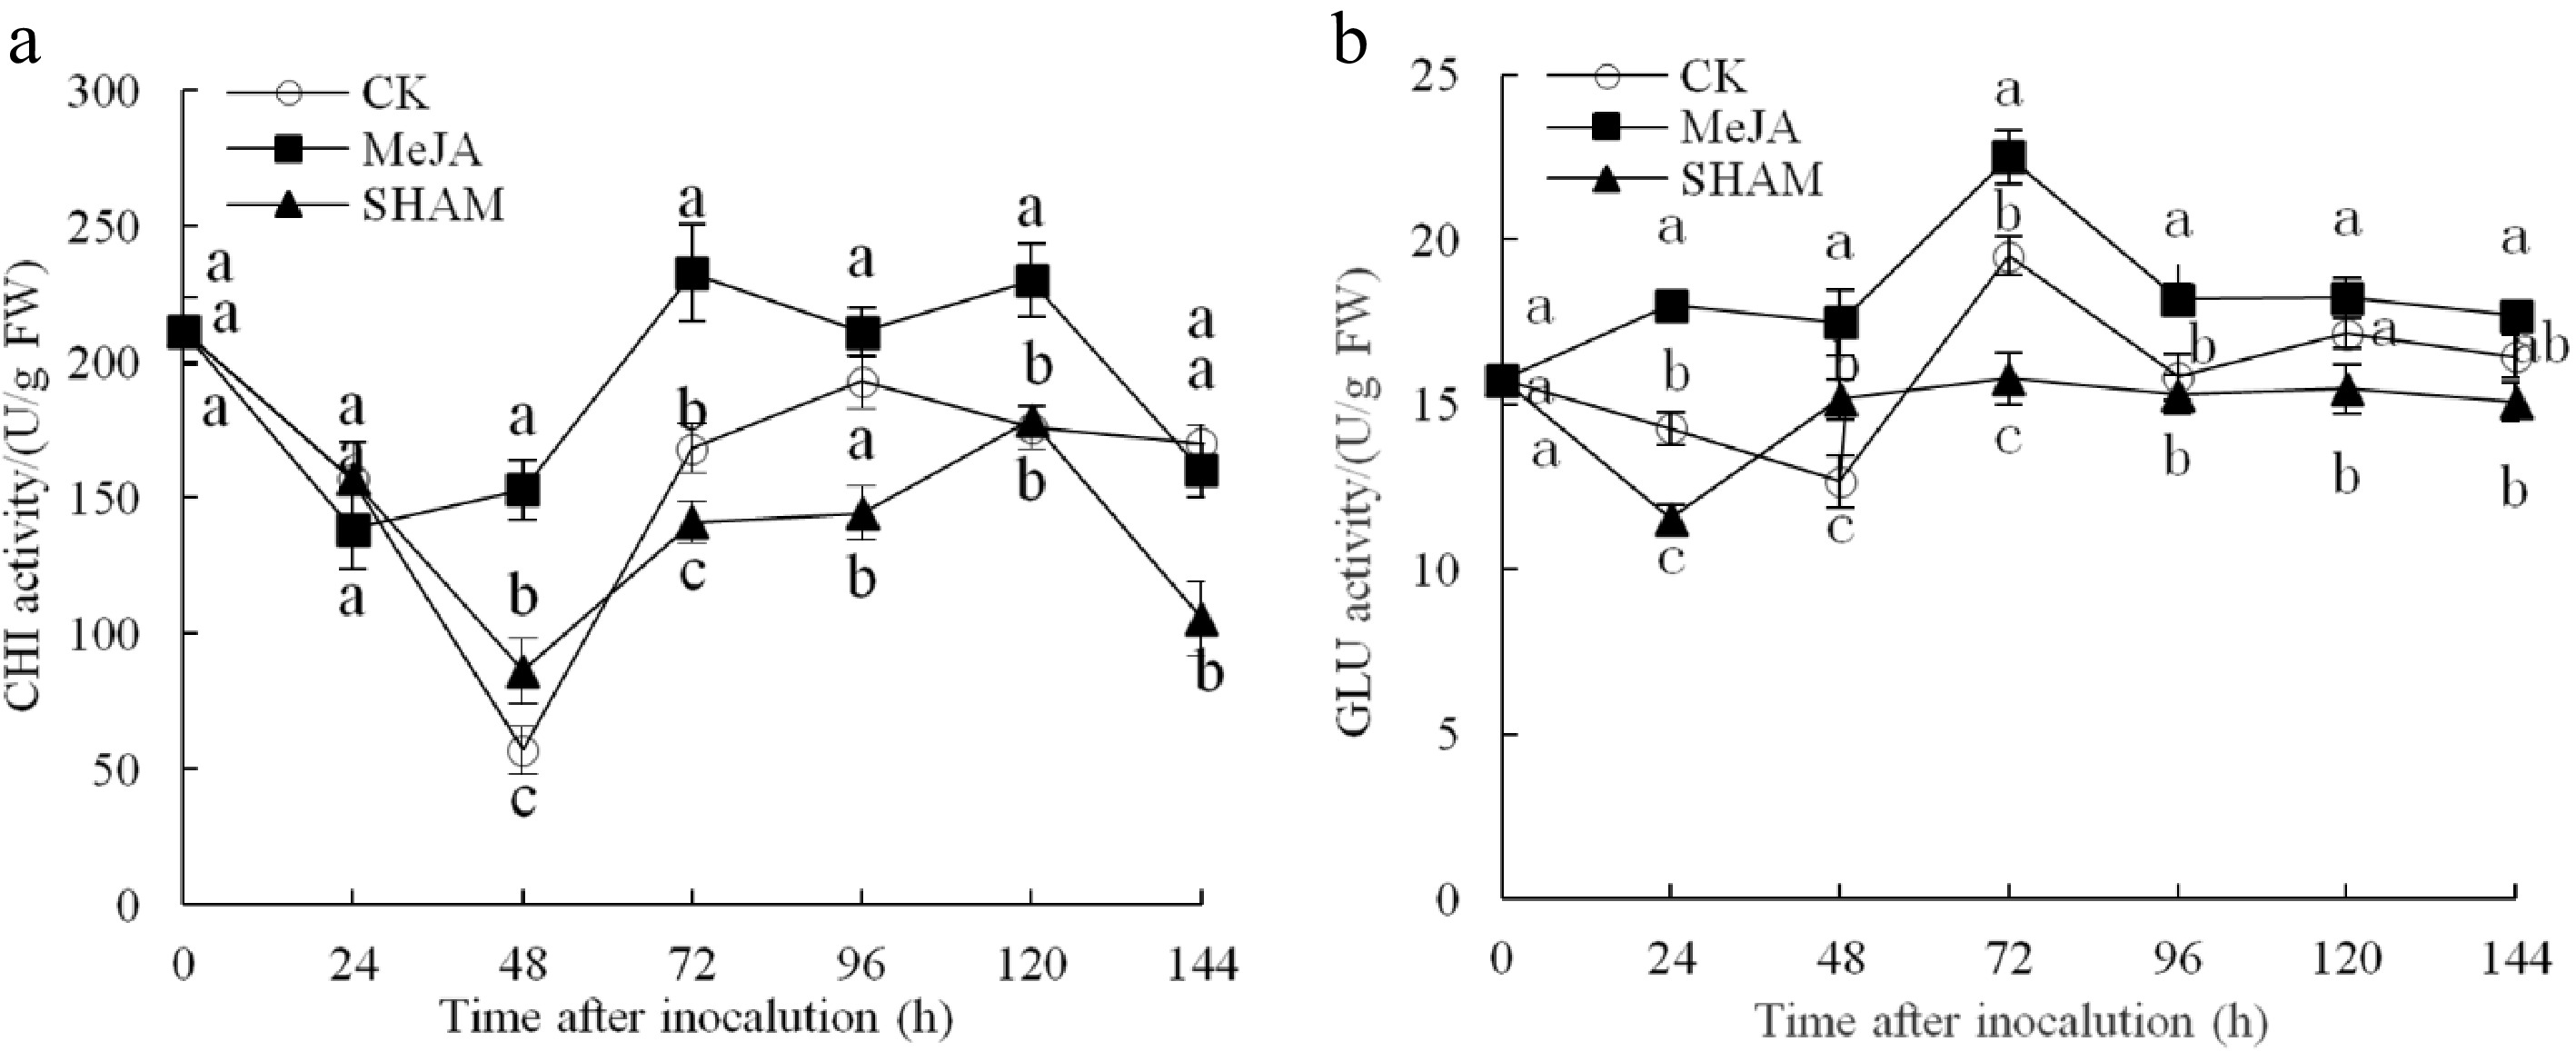
Figure 3.
Changes in the activities of CHI (a) and GLU (b) in pear fruit inoculated with Penicillium expansum after 100 μmol/L MeJA treatment for 36 h. Values are the means of three replicates, and vertical bars indicate the standard errors.
-
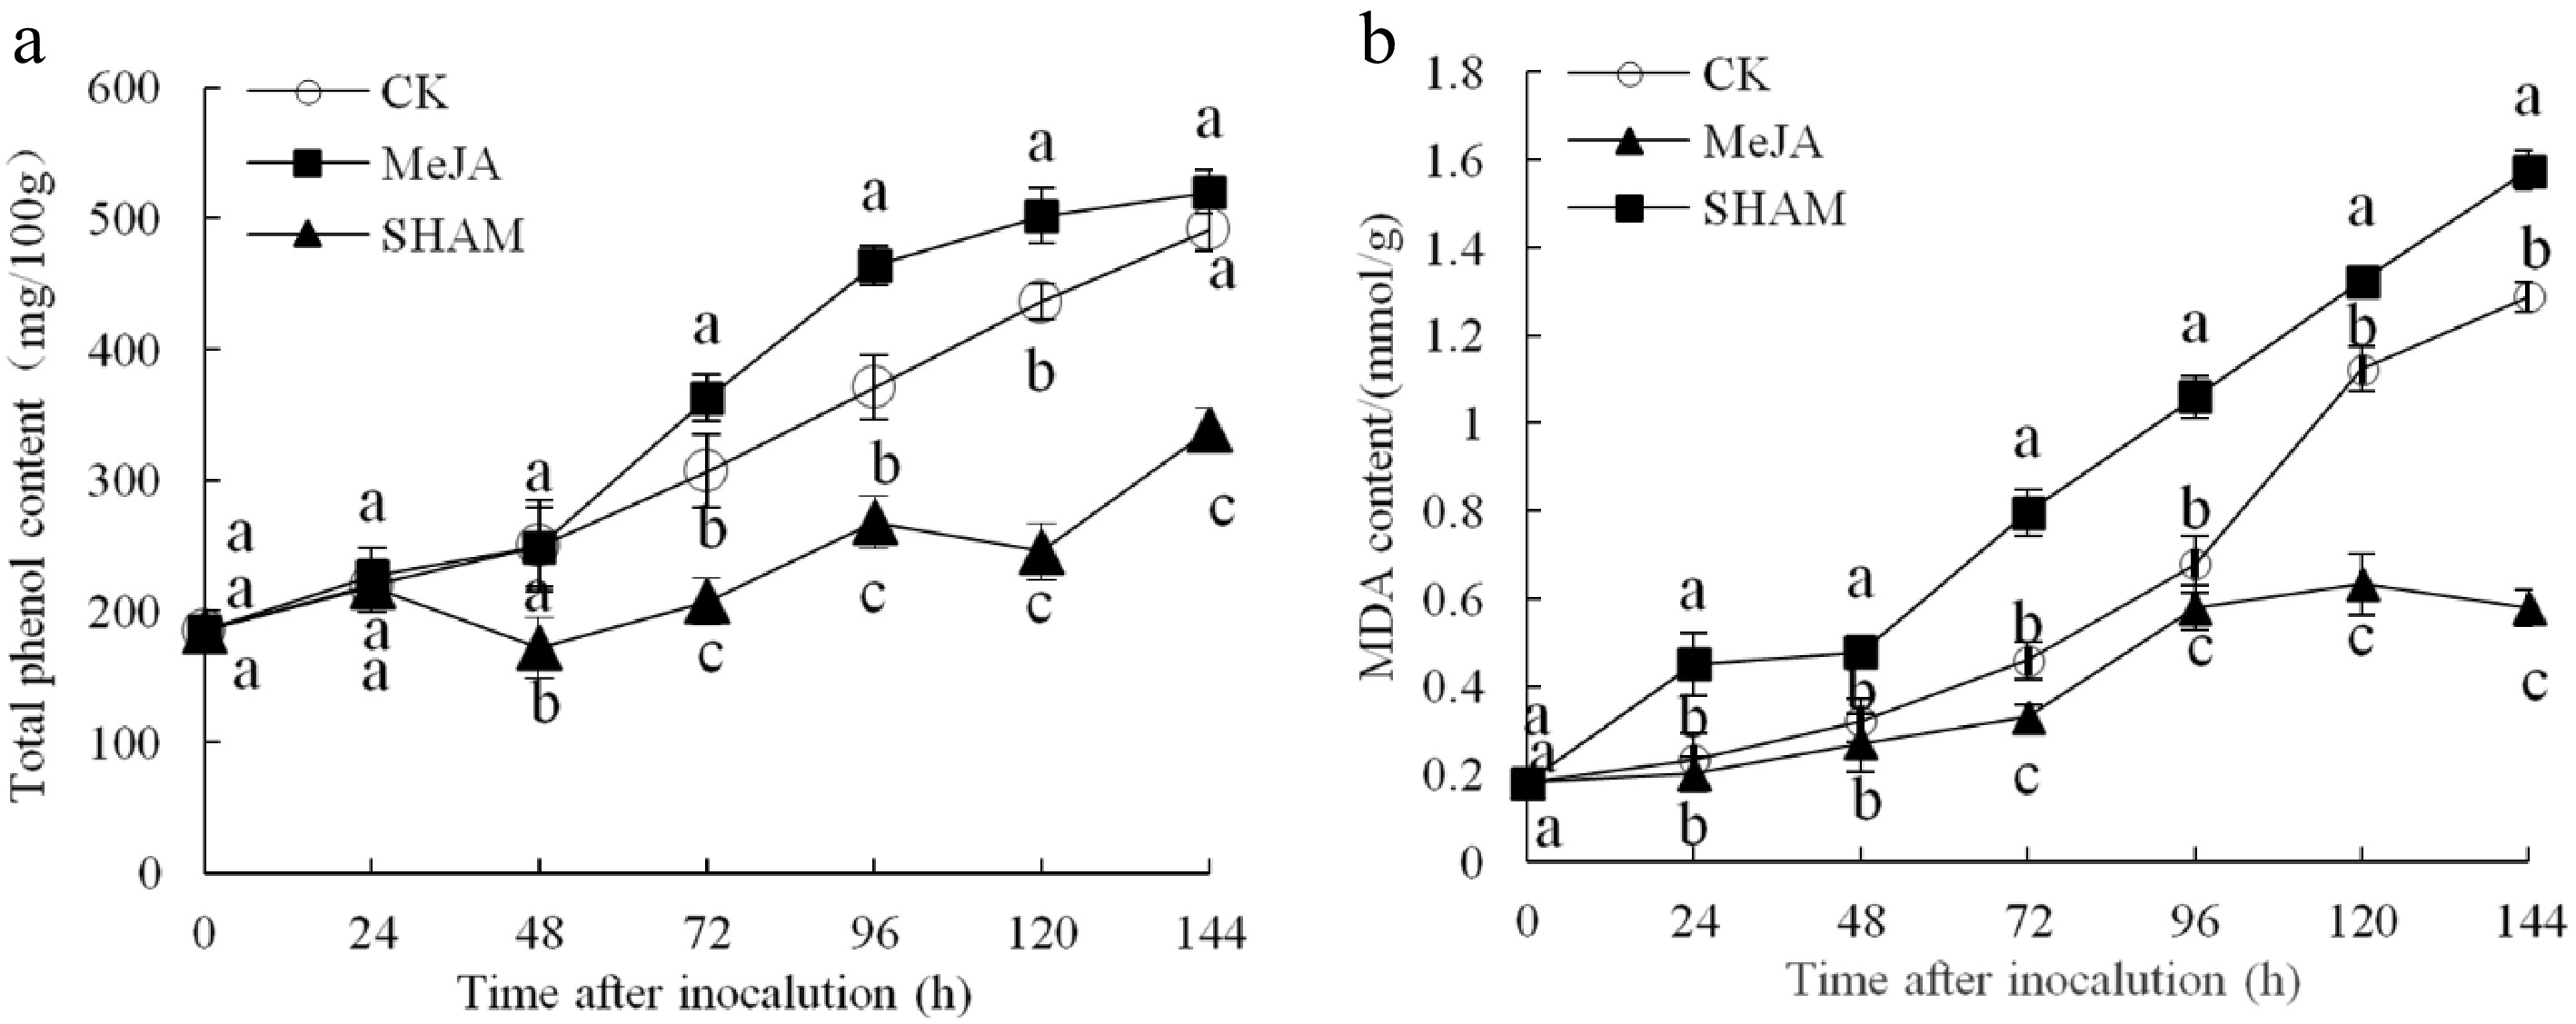
Figure 4.
Changes in the contents of total phenol (a) and MDA (b) content in pear fruit inoculated with of Penicillium expansum after 100 μmol/L MeJA treatment for 36 h. Values are the means of three replicates, and vertical bars indicate the standard errors.
-
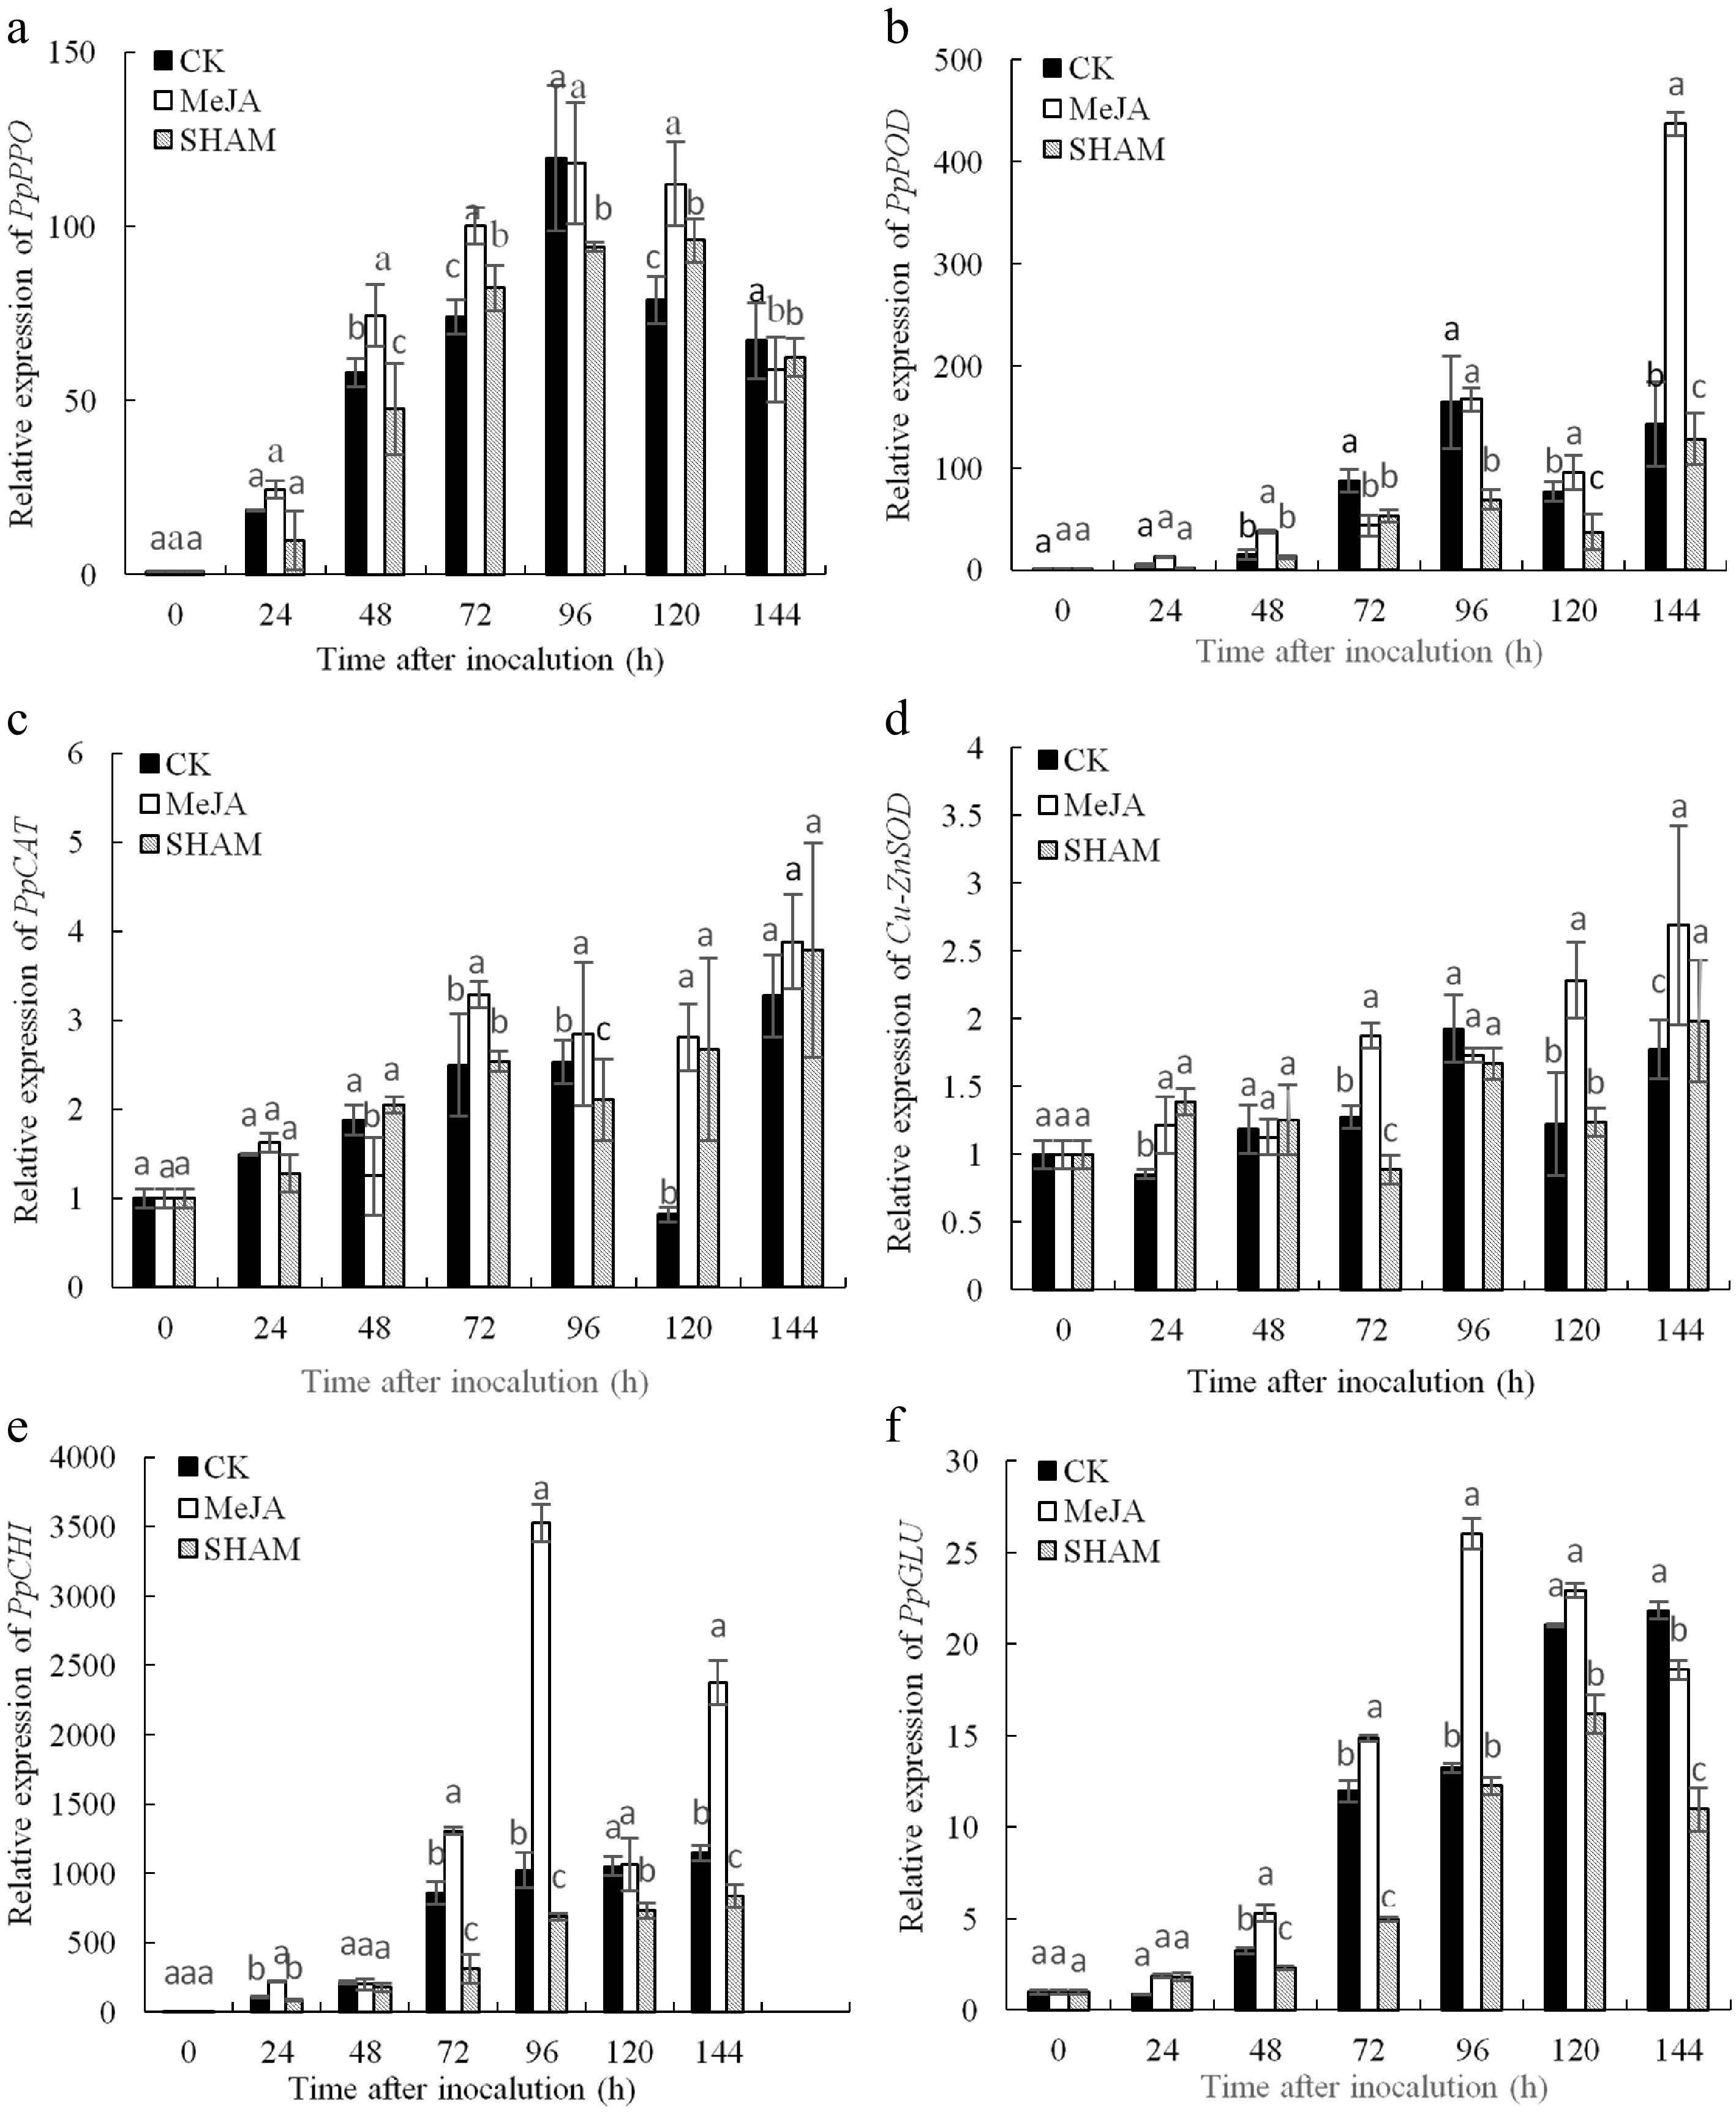
Figure 5.
Expression analysis of defence-related genes including PpPPO (a), PpPOD (b), PpCAT (c) Cu-ZnSOD (d), PpCHI (e) and PpGLU (f) in pear fruit inoculated with Penicillium expansum after 100 μmol/L MeJA treatment for 36 h. Values are the means of three replicates and vertical bars indicate the standard errors. Different letters indicate significant differences (p < 0.05) between the treatments determined using the Duncan’s multiple range test.
-
MeJA/SHAM Lesion diameter
(mm)Induction effect
(%)MeJA treatment
time (h)Lesion diameter
(mm)Induction effect
(%)CK 17.50 ± 0.59ab 0 0 22.95 ± 0.45a 0 10 μmol/L MeJA 16.89 ± 1.42b 3.46 ± 2.39b 12 21.26 ± 0.83a 7.34 ± 2.88b 100 μmol/L MeJA 14.94 ± 1.13c 14.59 ± 1.57a 24 21.52 ± 1.12a 6.26 ± 1.60b 1,000 μmol/L MeJA 20.09 ± 0.25a −14.80 ± 0.71c 36 19.45 ± 0.42b 15.23 ± 1.46a 100 μmol/L SHAM 21.45 ± 0.86a −22.58 ± 0.84d 48 20.84 ± 0.25a 9.20 ± 0.80b Values are the means of three replicates. Data in the table are mean ± SD. Different letters indicate significant difference (p < 0.05) between the treatments determined using the Duncan's multiple range test. Table 1.
Effects of MeJA treatment on induction resistance in pear fruit inoculated with Penicillium expansum.
Figures
(5)
Tables
(1)