-
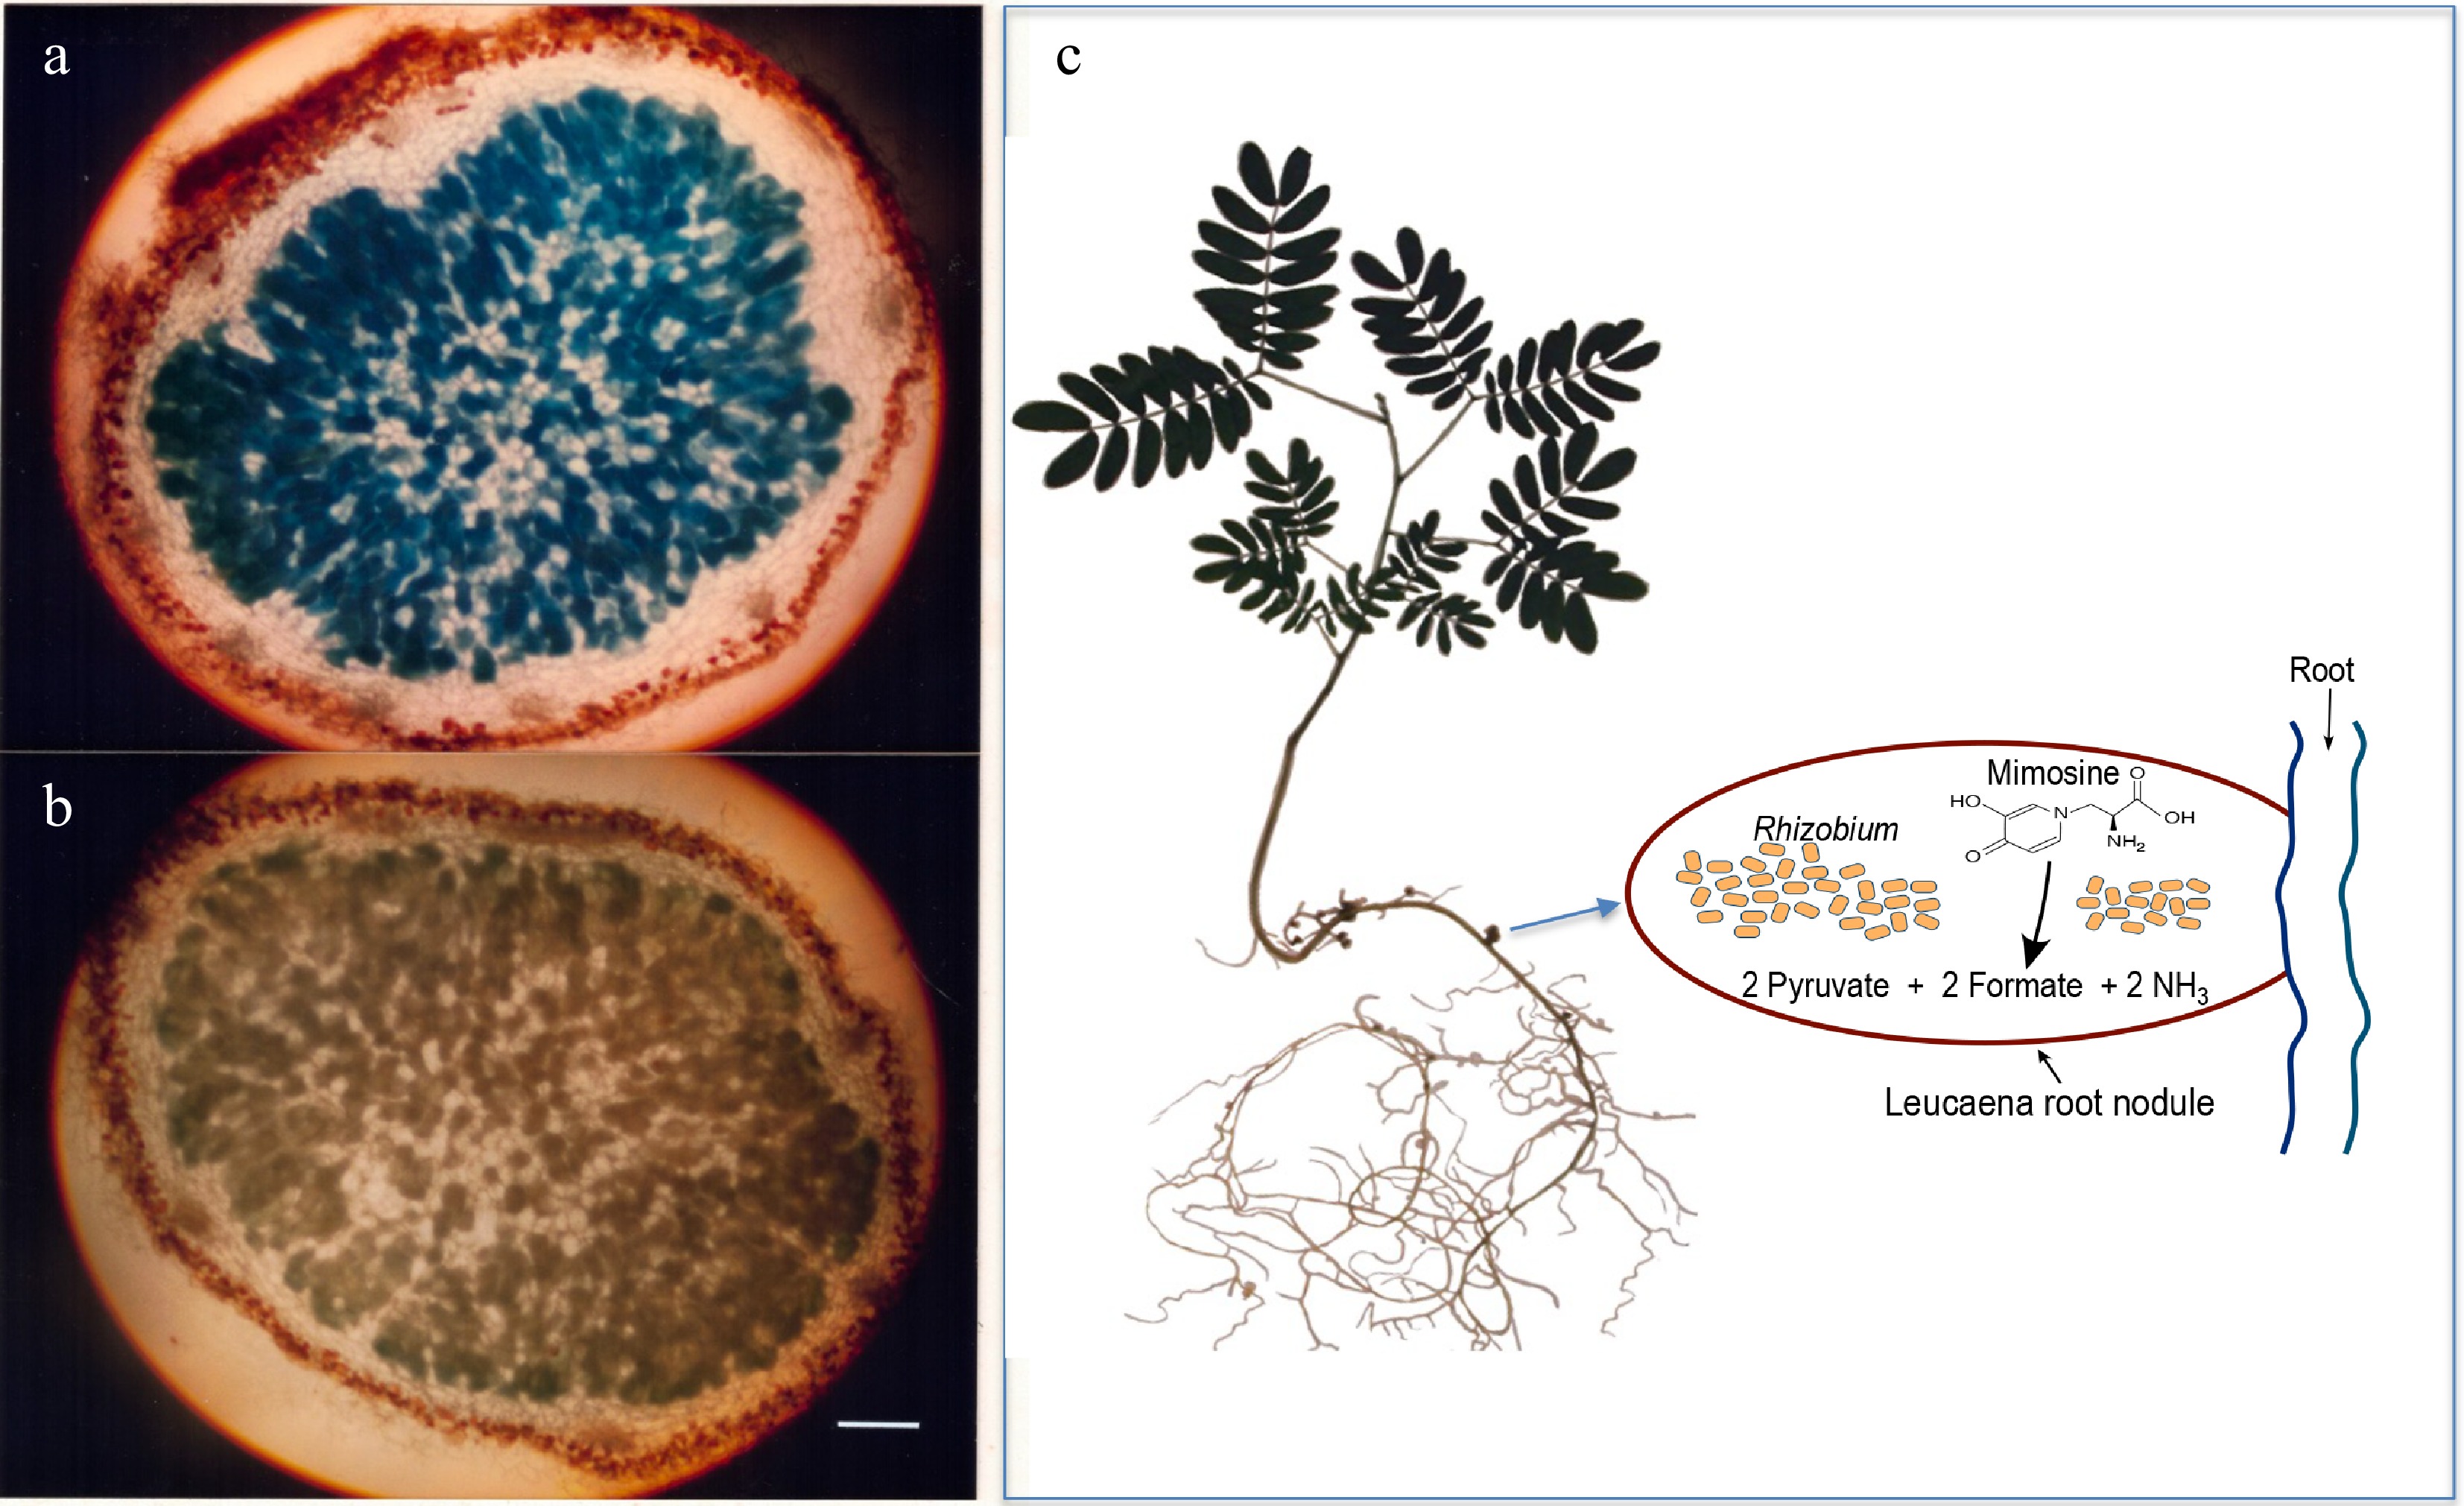
Figure 1.
Light microscopy of 20-µM thick sections of 5-week-old Leucaena leucocephala nodules. (a) Induction of alkaline phosphatase activity in the Leucaena nodule formed by the midA::phoA mutant RUH128 of Rhizobium TAL1145. (b) Another mutant RUH129, in which the phoA insertion on midA was in the opposite orientation, was used as a negative control. Nodule sections were stained for phosphatase activity. RUH128 cells inside the nodule expressed phosphatase activity whereas RUH129 cells inside the nodule did not show any detectable phosphatase activity. Bar represents 400 µM. (c) Schematic of a Leucaena nodule occupied by a Rhizobium strain that degrades mimosine into pyruvate, formate and ammonia.
-
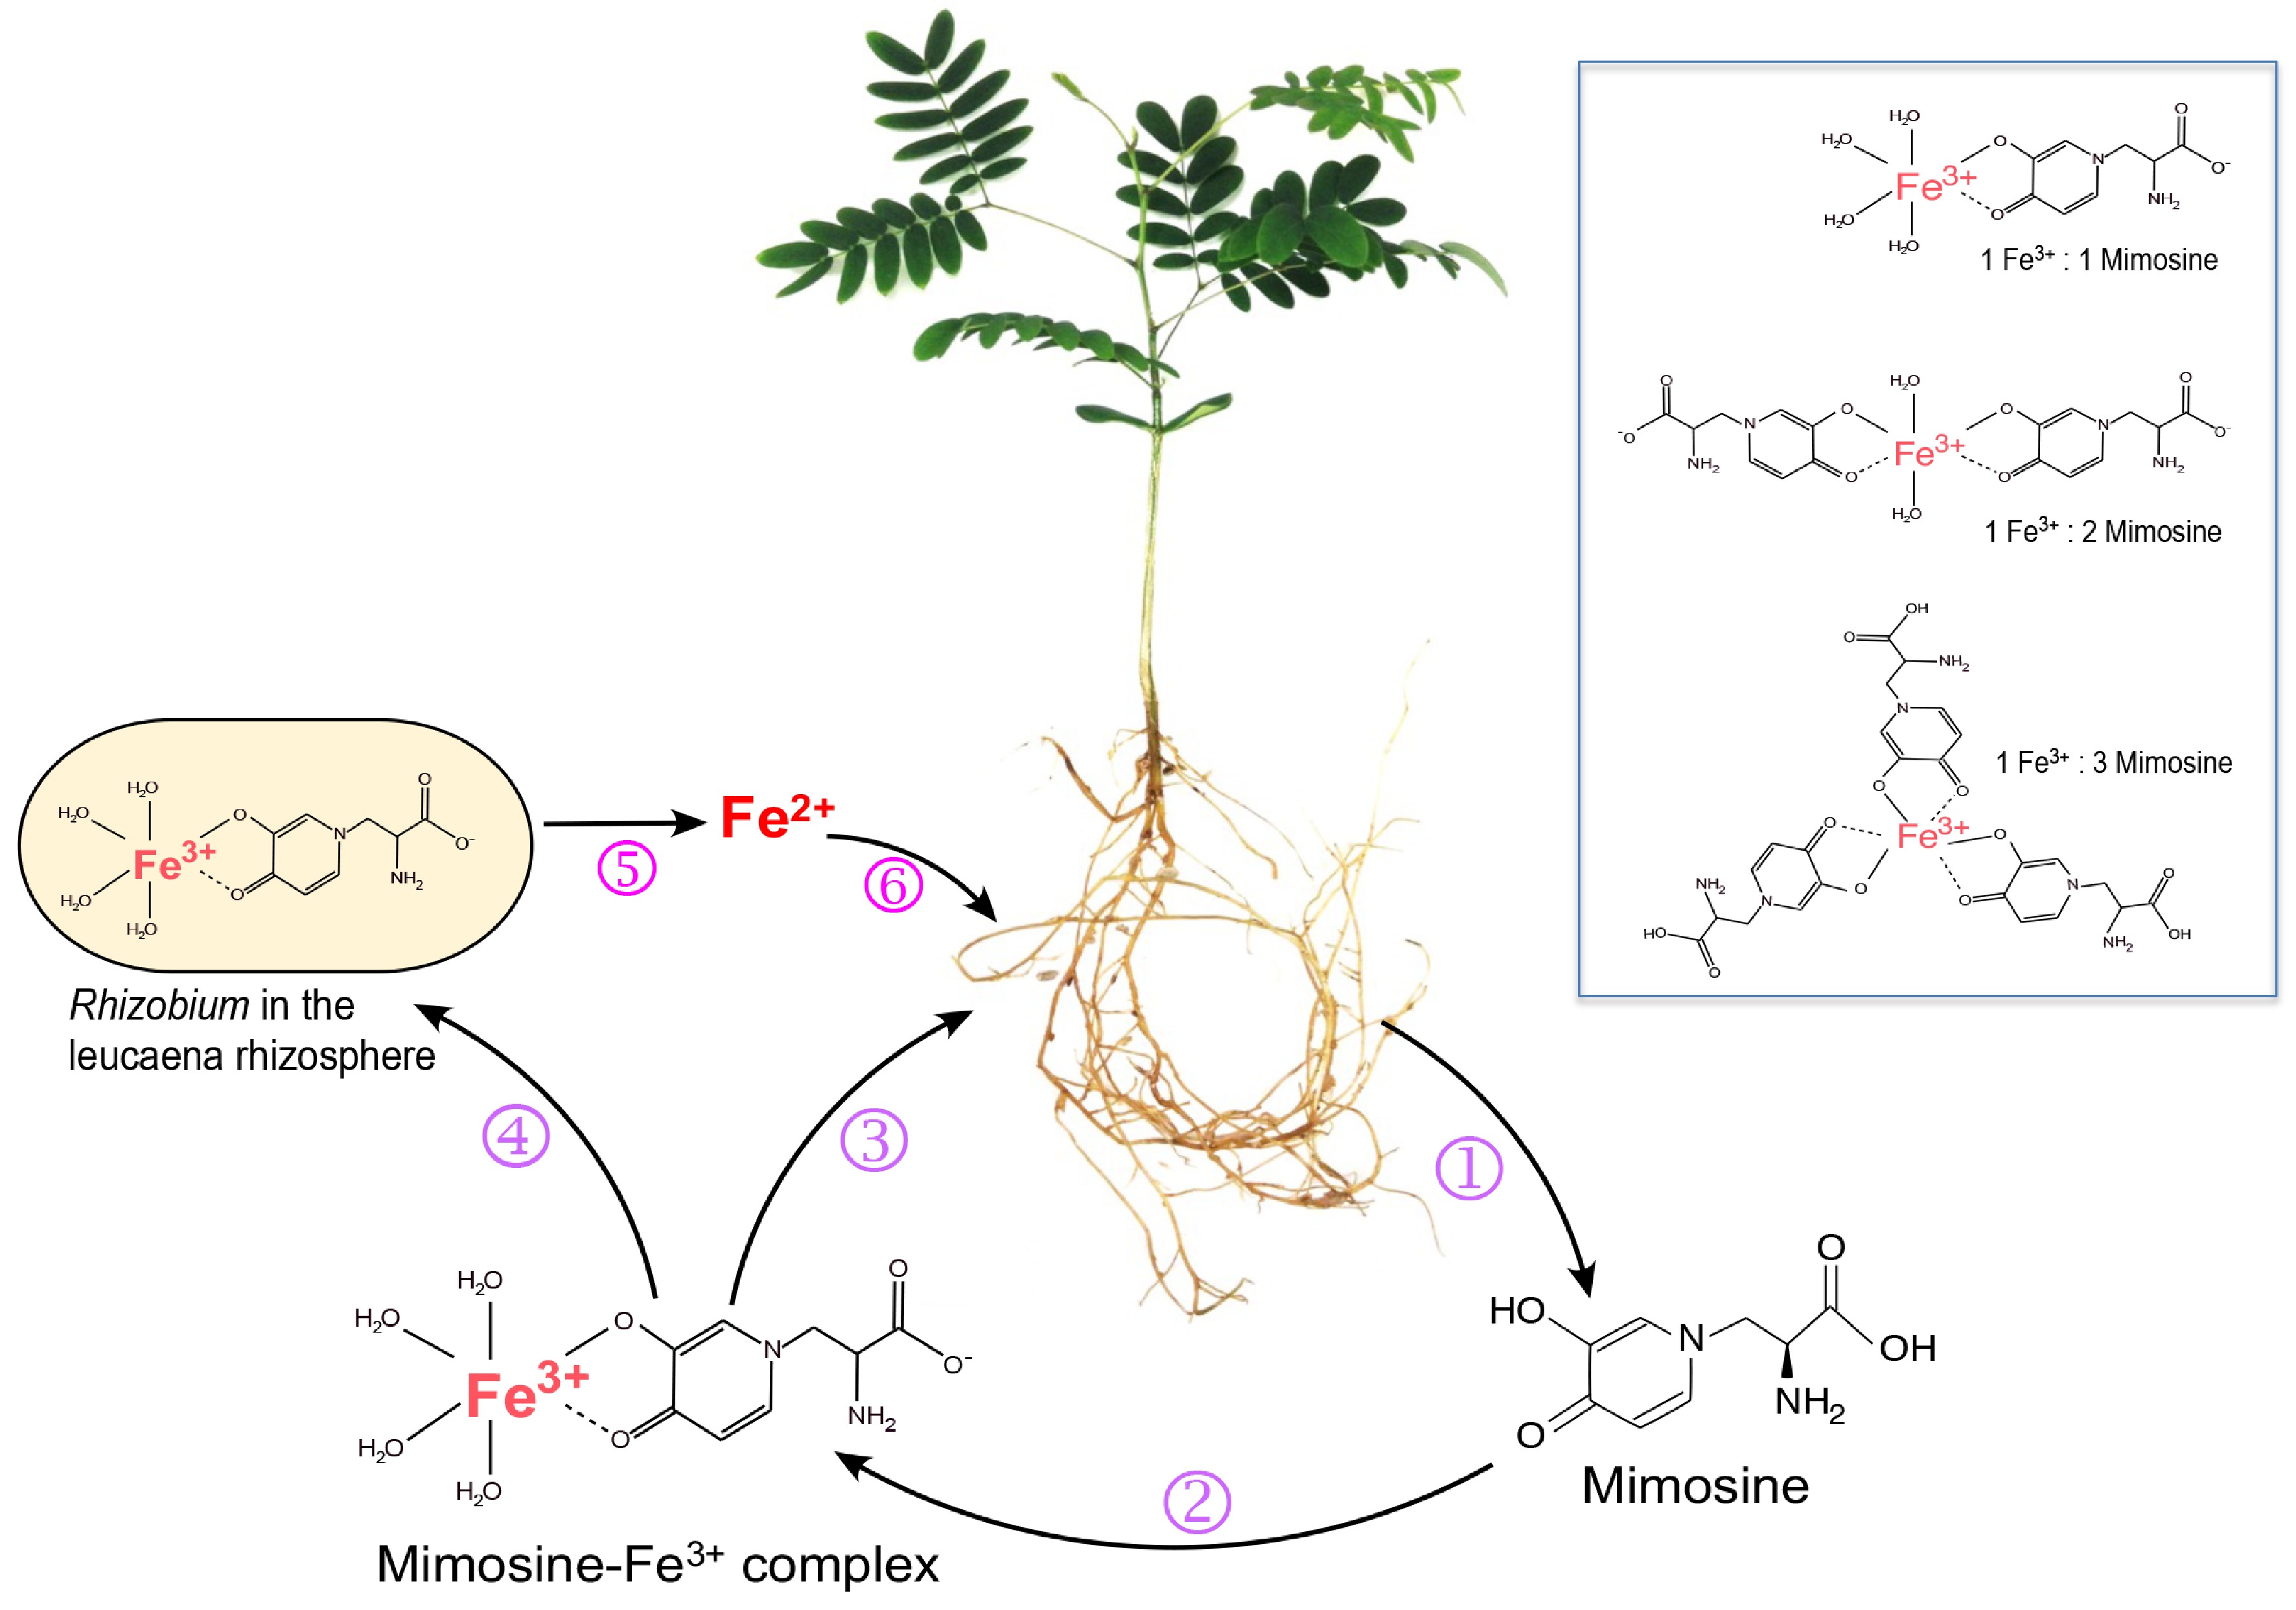
Figure 2.
Roles of mimosine and free-living rhizobia in iron uptake by Leucaena. (1) Leucaena root exudates contain mimosine, which chelates Fe3+ to form Fe3+-mimosine complexes (2). Three types of Fe3+-mimosine complexes may be formed depending on the amount of mimosine available in the rhizosphere (box). The Fe3+-mimosine complexes are taken up by Leucaena roots using an oligopeptide-type of transporter (3). Fe3+-mimosine complexes can also be taken up by mimosine-degrading rhizobia in the rhizosphere using an ABC transporter (4). Rhizobia degrade Fe3+-mimosine complexes and release Fe2+ into the rhizosphere (5). Fe2+ is taken up by Leucaena through an IRT transporter (6).
-
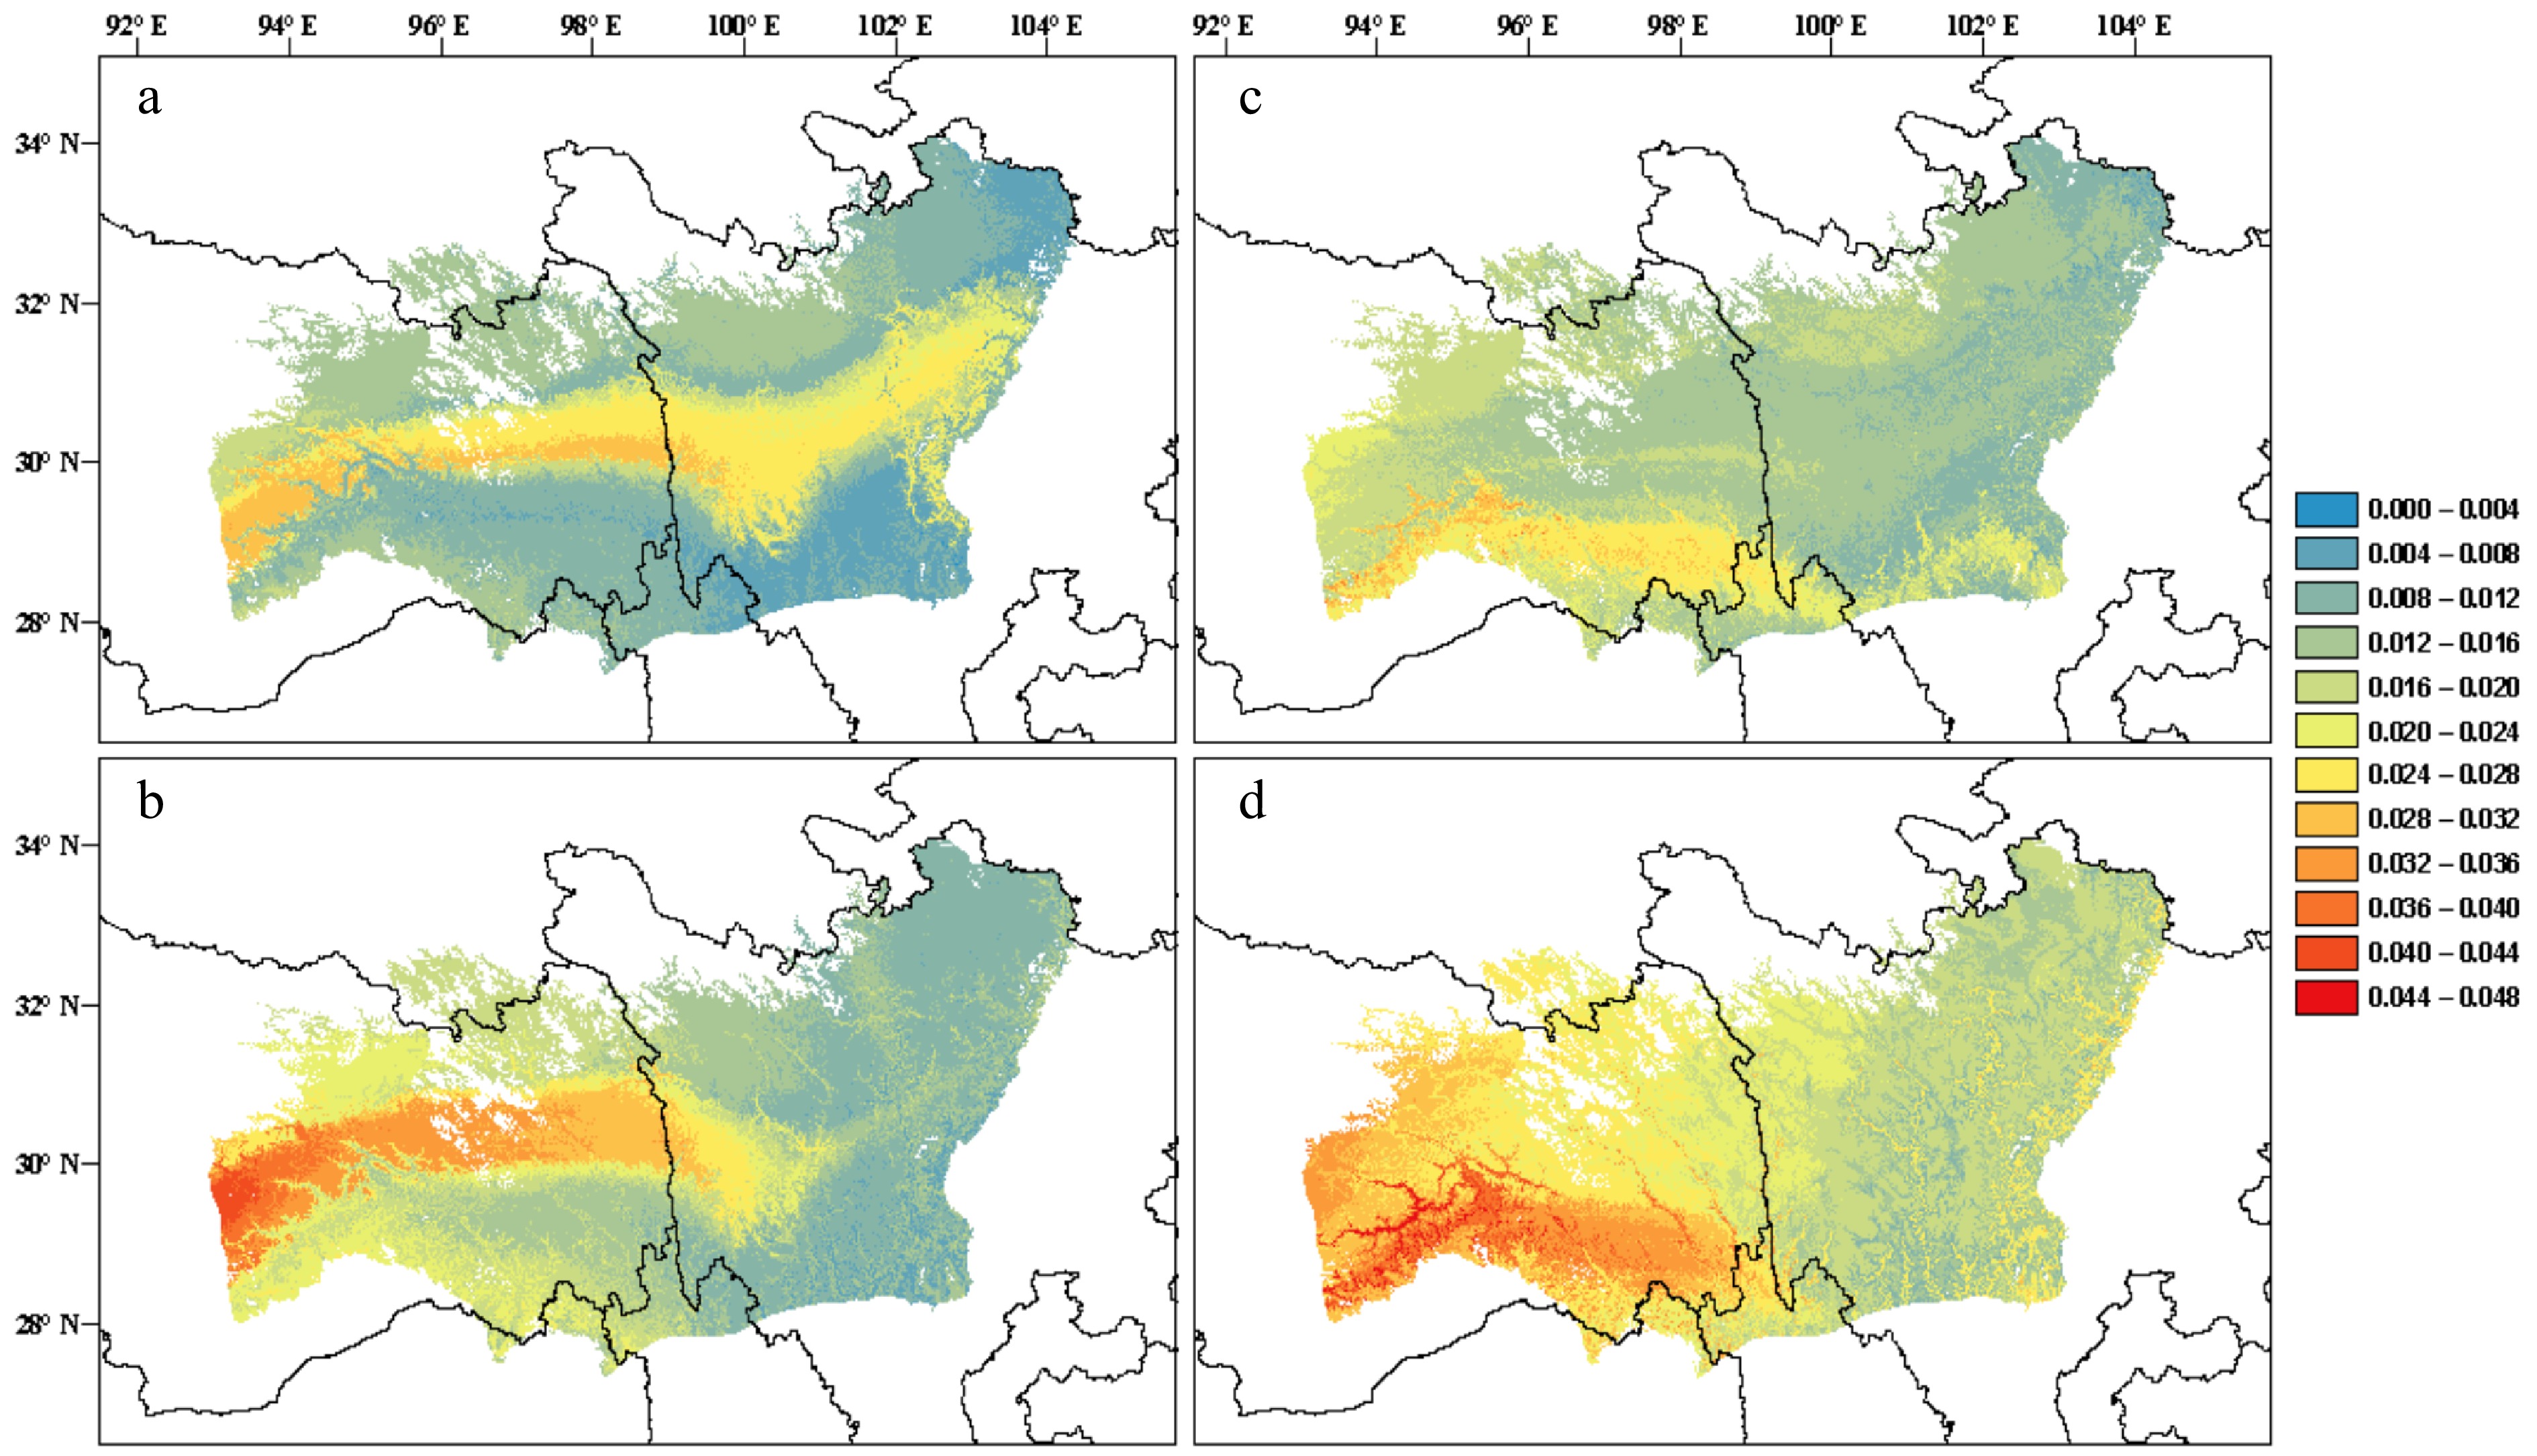
Figure 3.
(a), (b) Predictions of genomic offset to future climate change in Pinus densata using a full set of 47,612 SNPs in exome sequences. (c), (d) Subset of 2,025 significant GEA SNPs. (a) and (c) reflect scenario representative concentration pathway (RCP) 2.6 2070; (b) and (d) reflect scenario RCP 8.5 2070. Red and blue indicate high and low genomic offset, respectively (Adapted from Zhao et al.[259]).
-
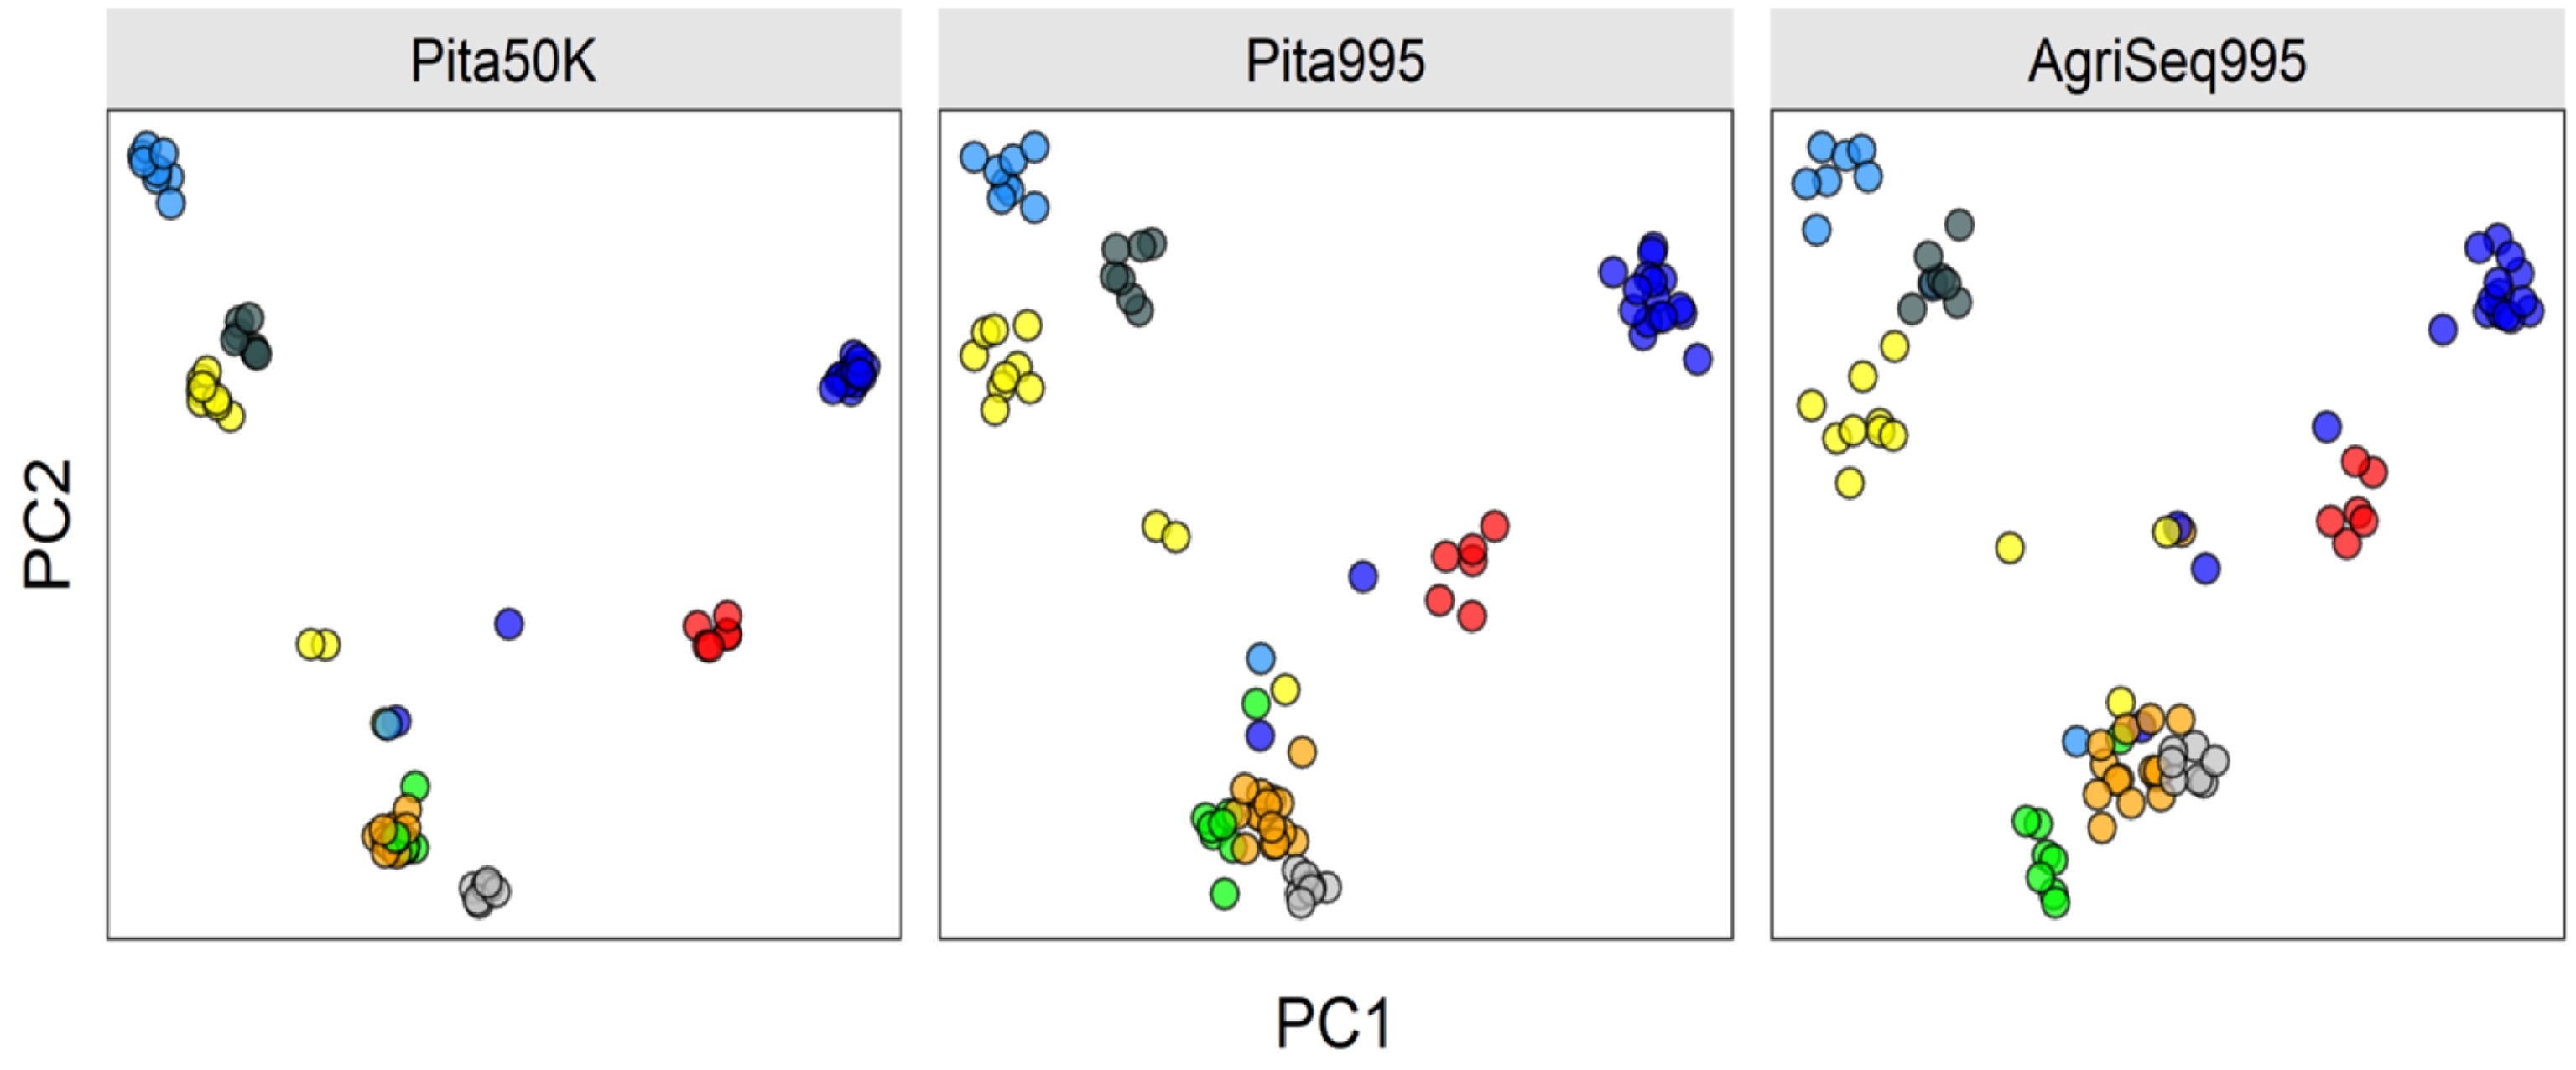
Figure 4.
Clustering eight Pinus taeda full-sib families (colored circles) based on three different SNP marker sets. AgriSeq Targeted GBS panel (on the right) clustered the full-sib families similar to the same SNP markers selected from the Pinus taeda SNP array (in the middle). Trees not clustered are likely pedigree errors or the half-sibs (sharing one parent of another full-sib family).
-
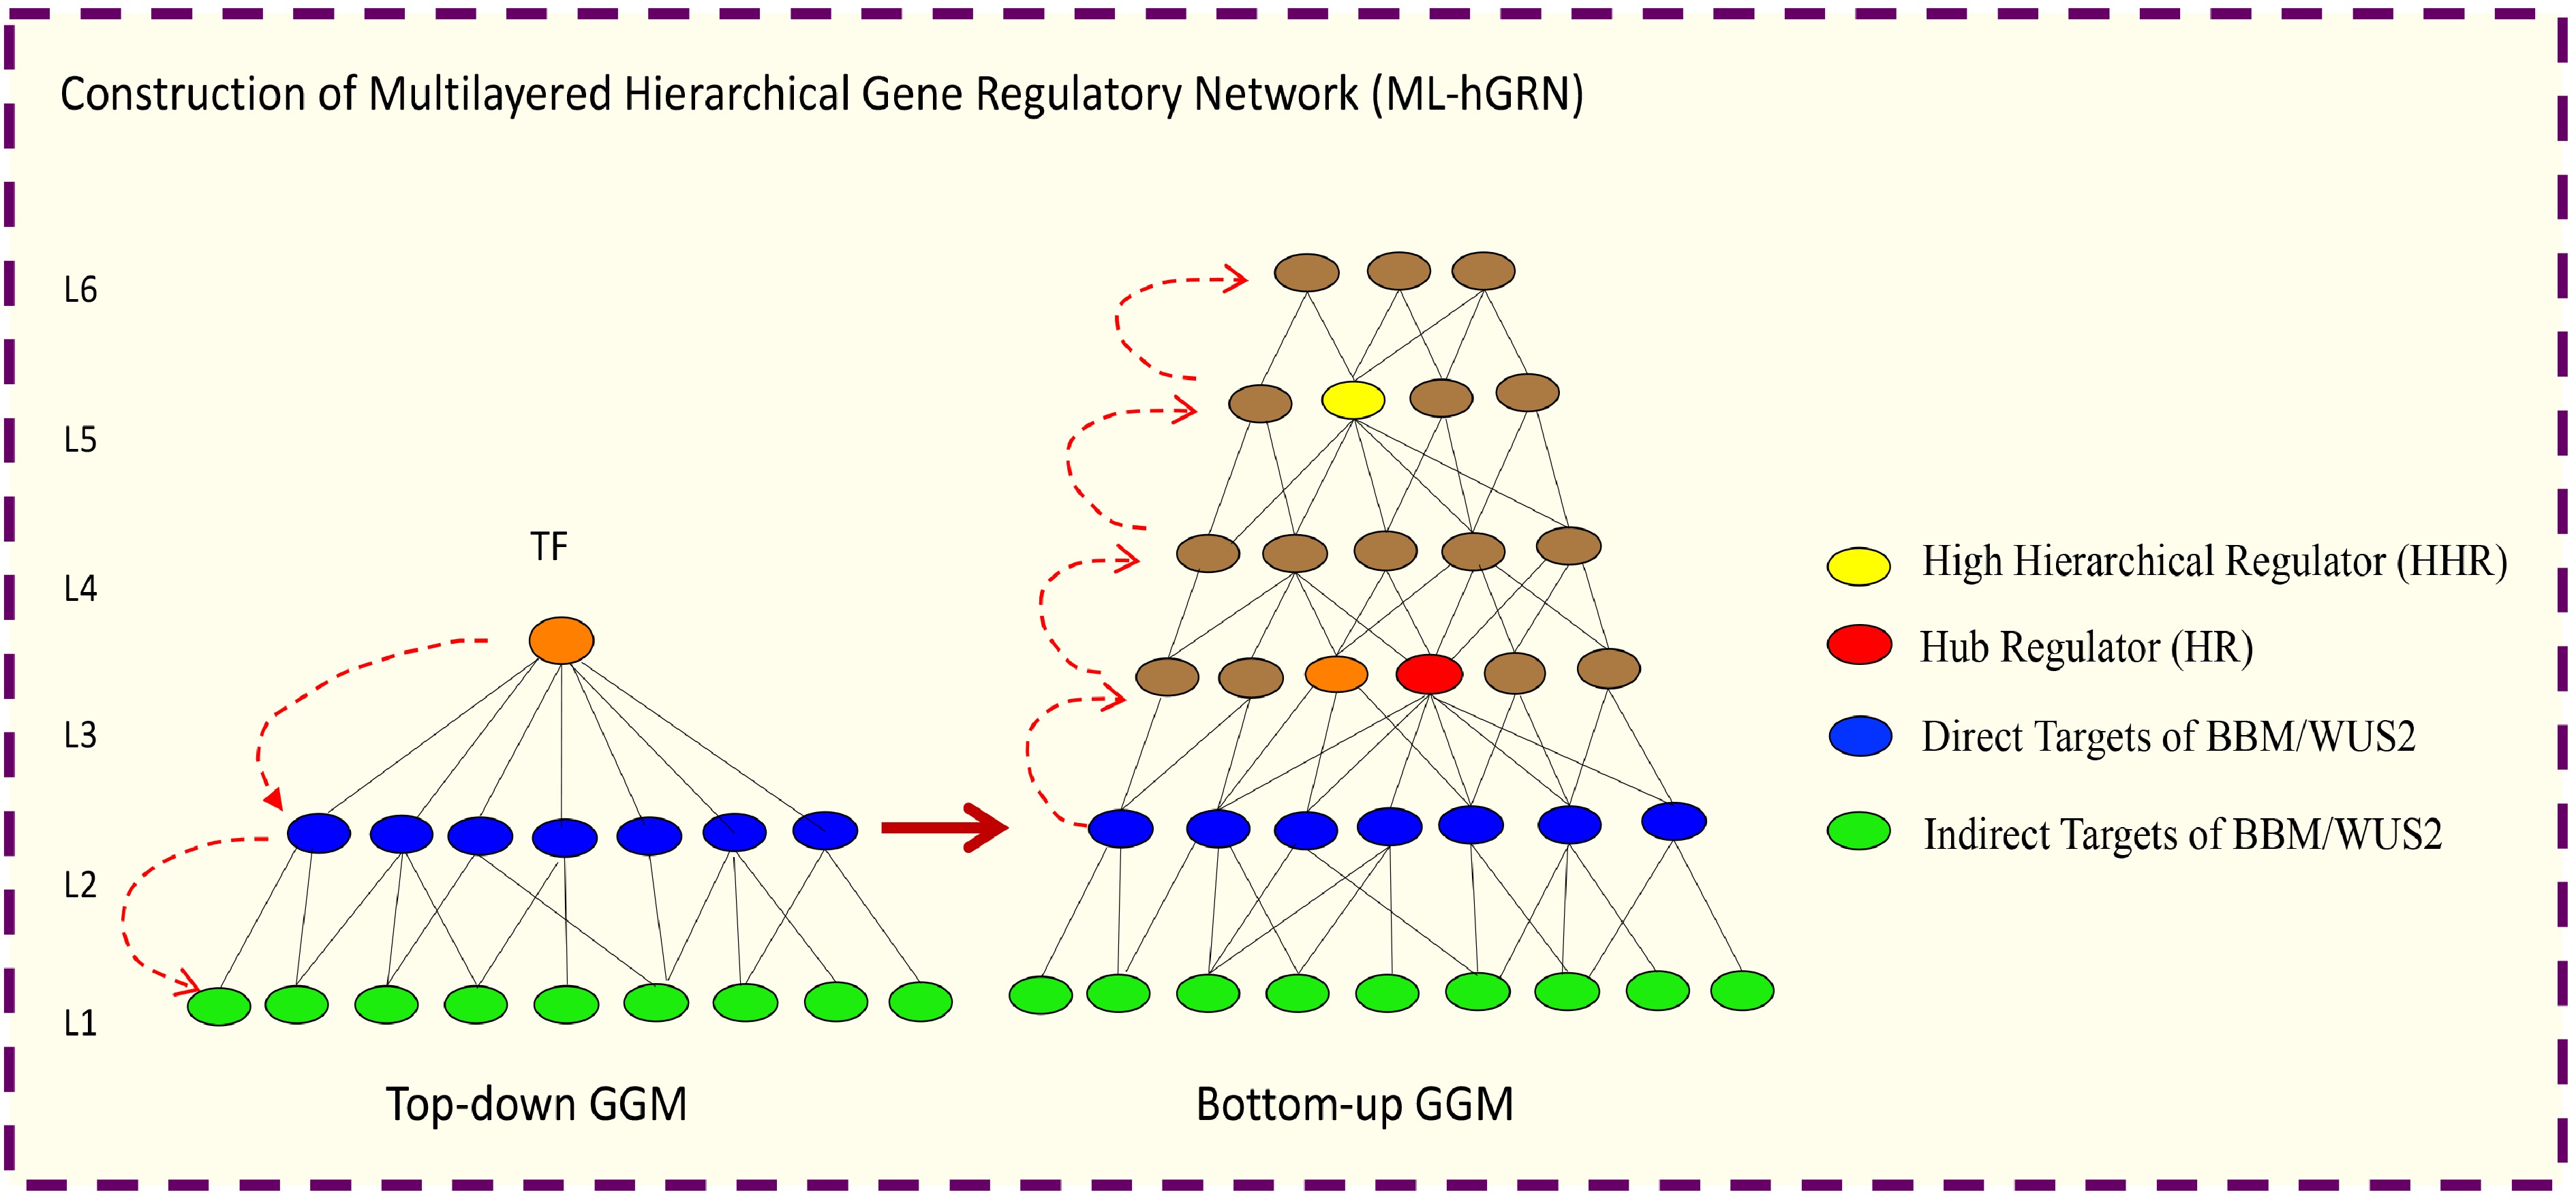
Figure 5.
Illustration of how to construct a multilayered hierarchical gene regulatory network (ML-hGRN) to encompass a given transcription factor (TF) using Top-down GGM and Bottom-up GGM Algorithms synergistically.
Figures
(5)
Tables
(0)