-
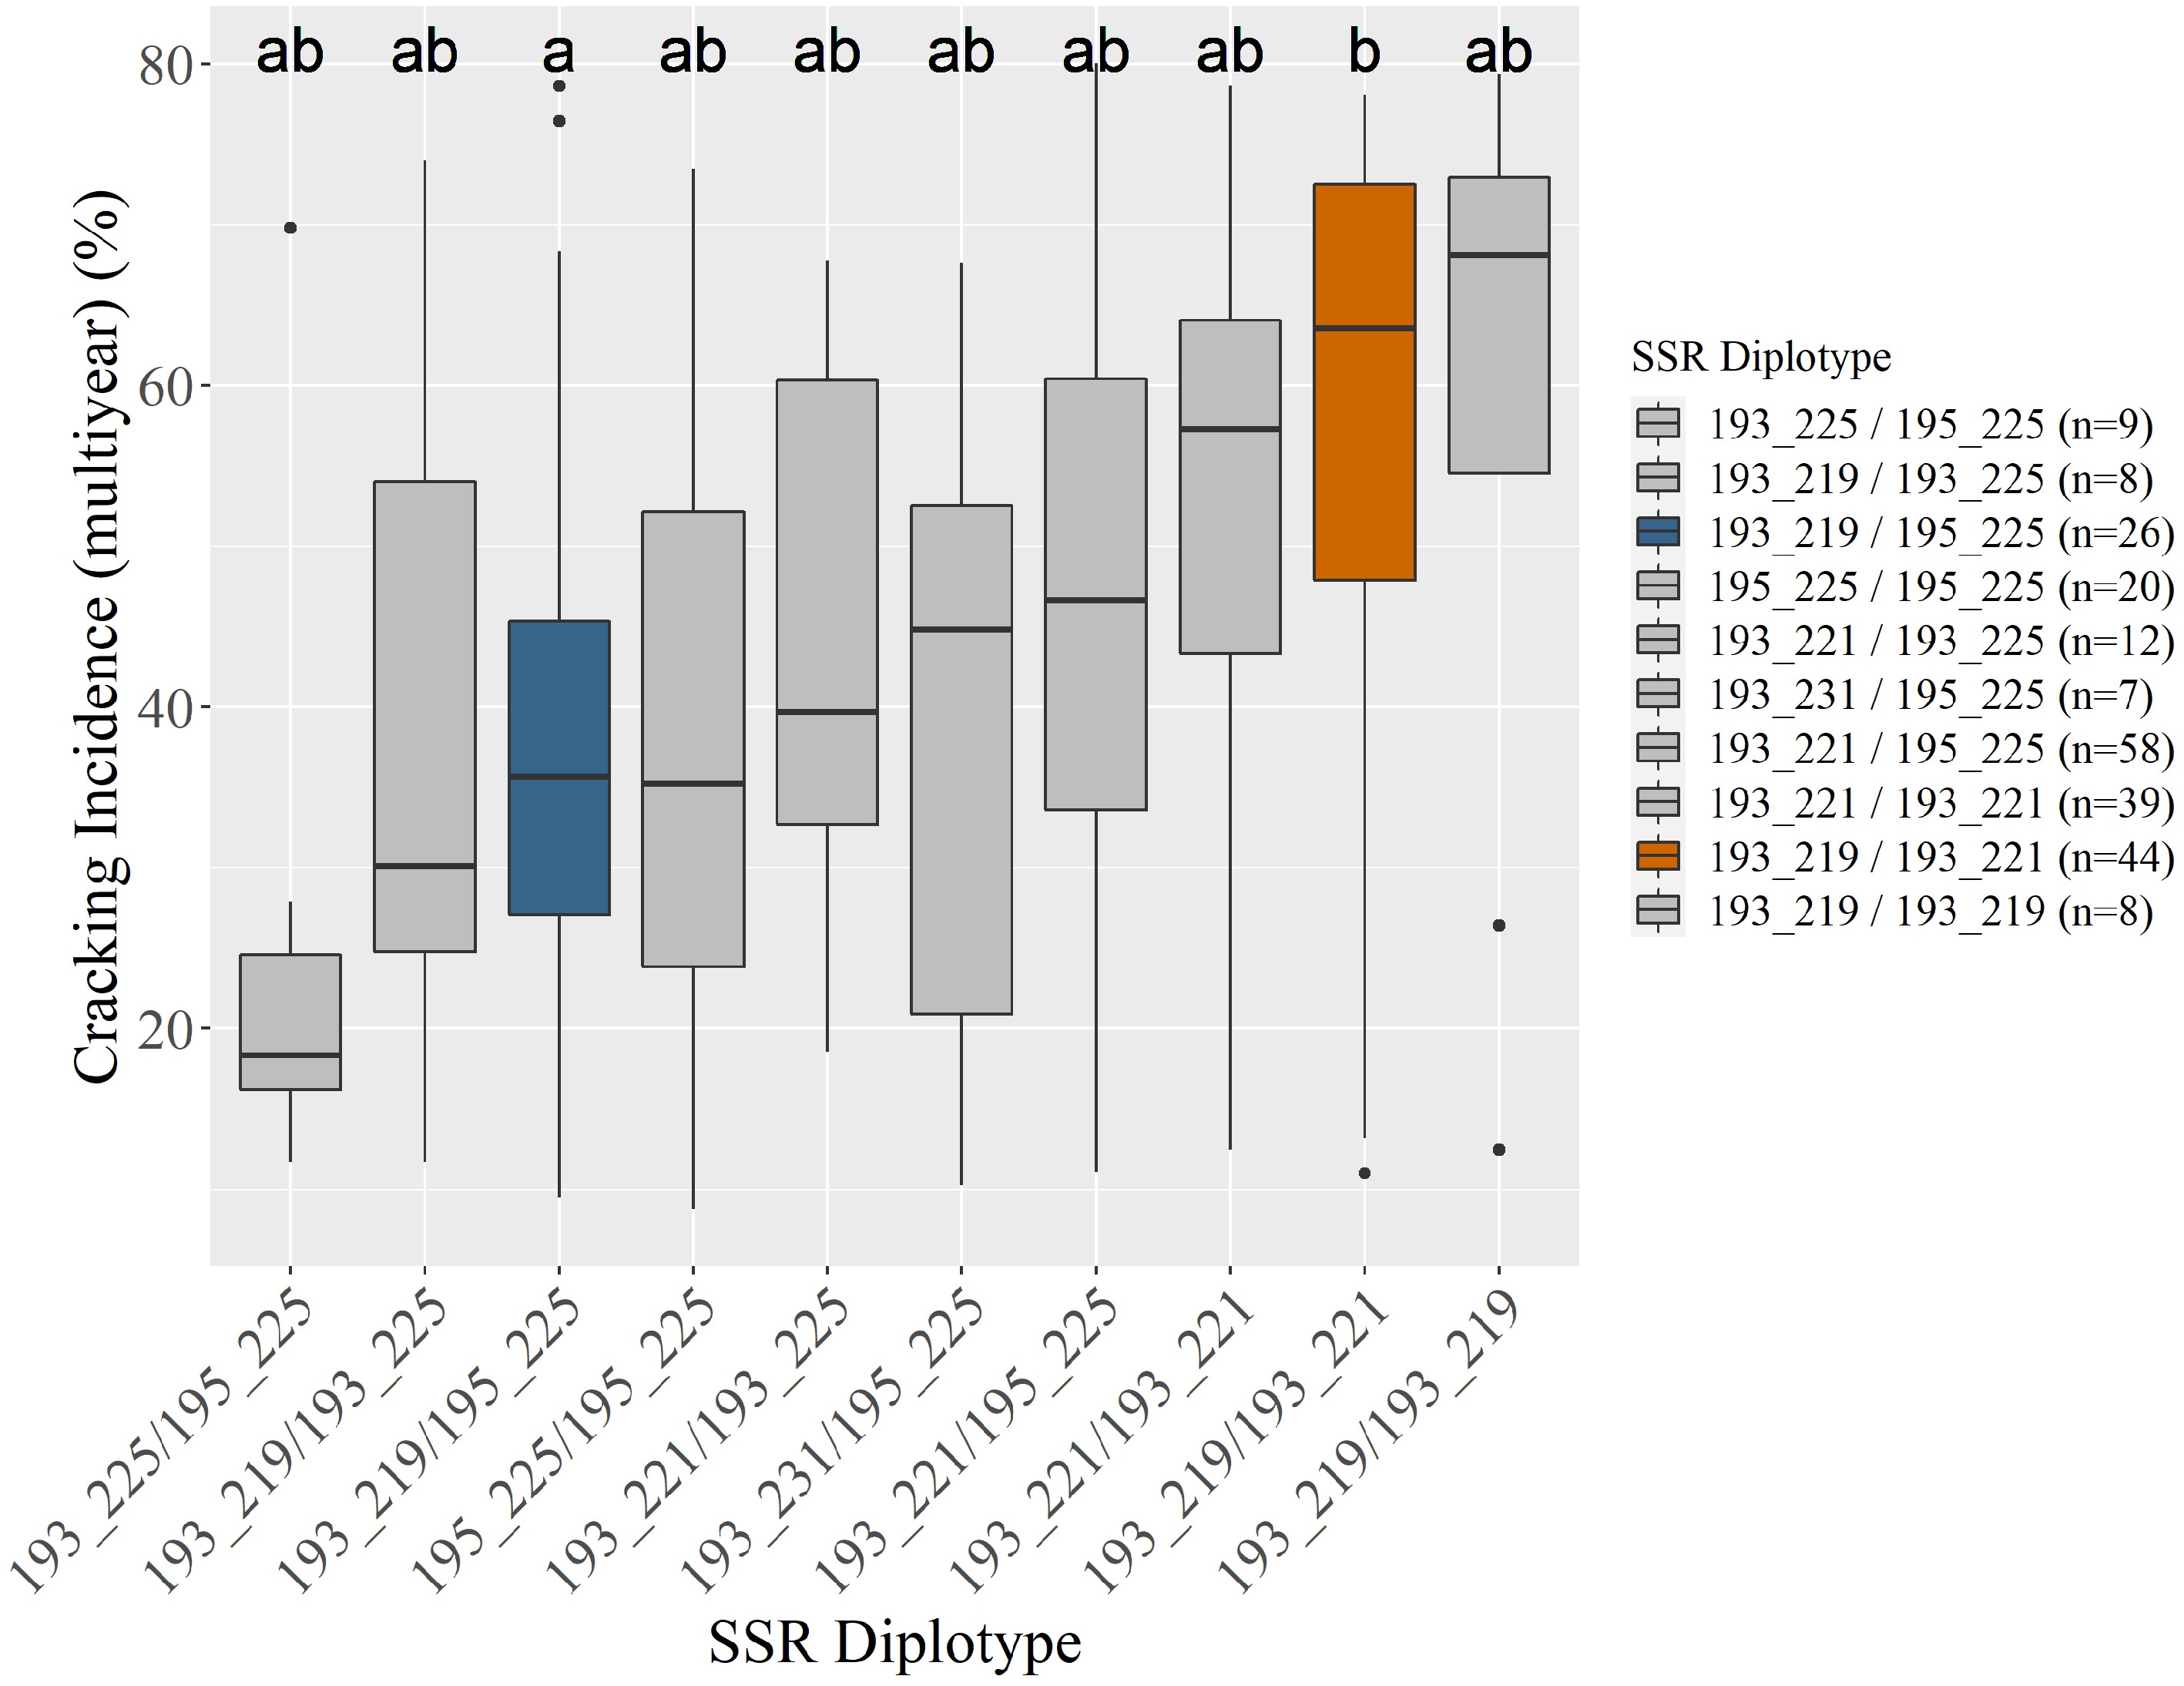
Figure 1.
Unselected seedlings' (n = 246) associated average multiyear cracking incidence by Pav-G5Crack-SSR diplotype (a). Three seedlings were unable to be scored. Coloring in (a) indicates an SSR diplotype's associated cracking incidence being significantly different from at least one other diplotype, corresponding with the compact letter display and graphical display (b). All subsequent figures use the coloring in (b). Gray indicates no assigned effect (insufficient significant differences).
-
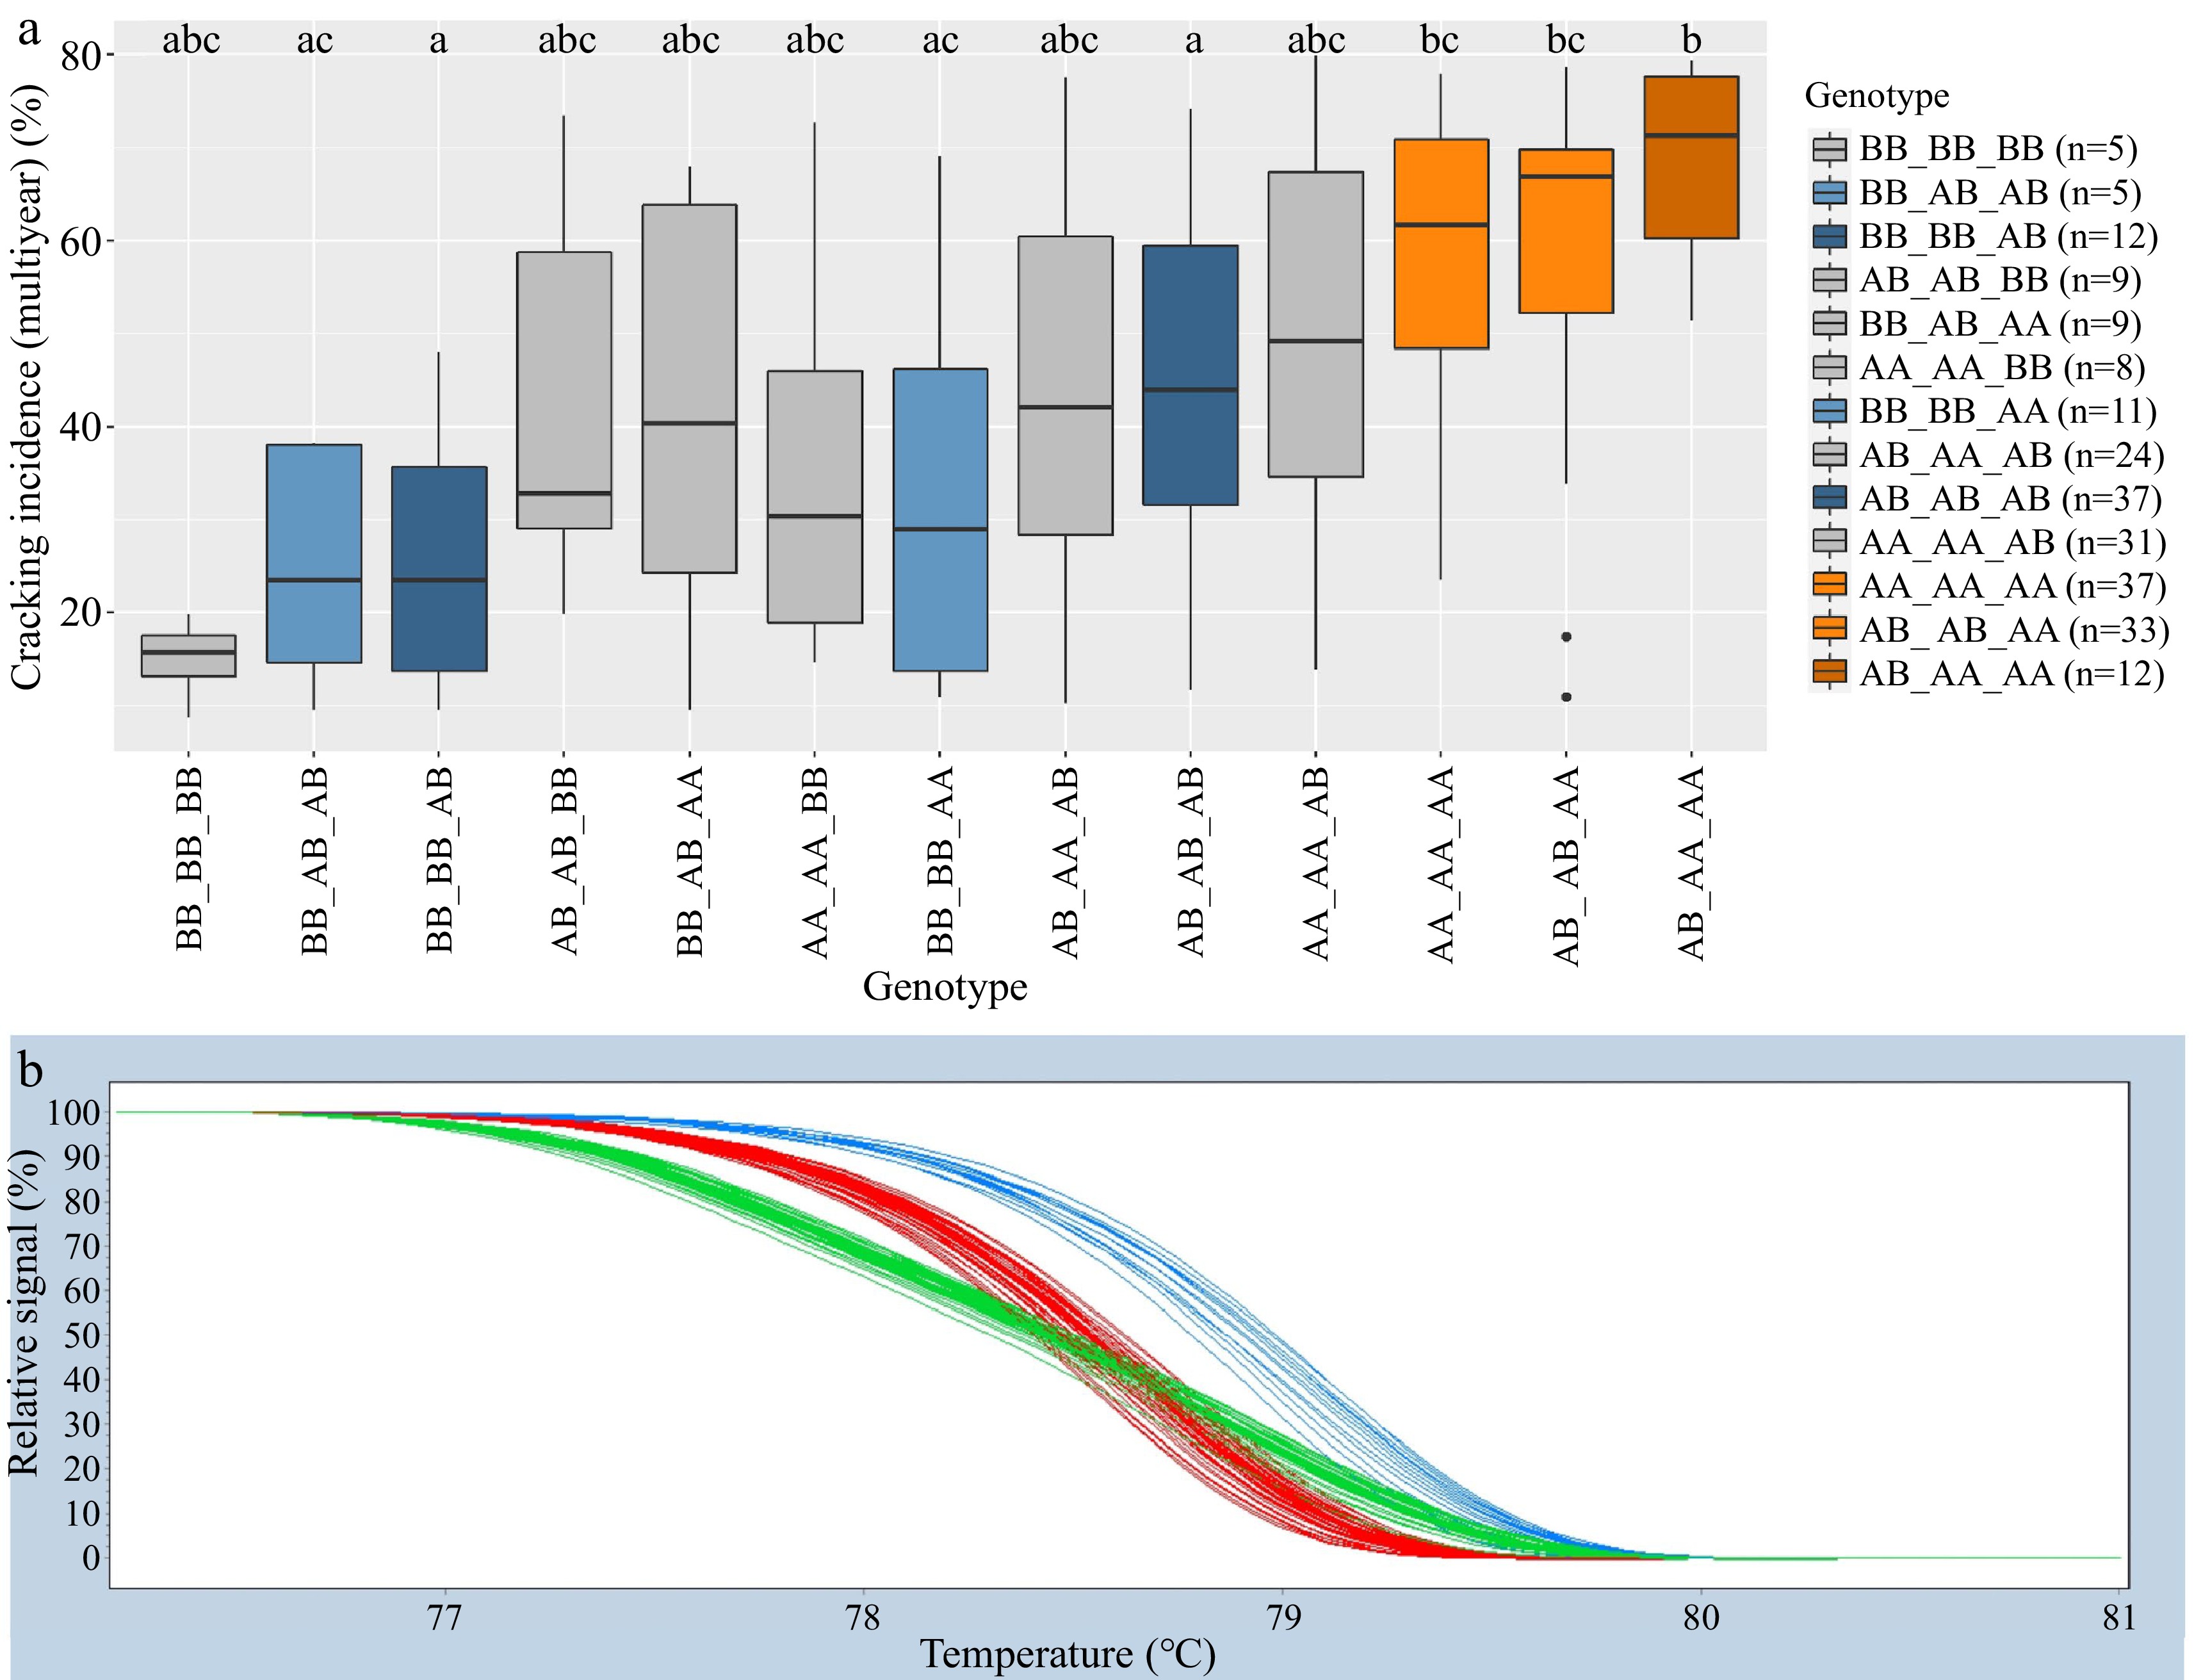
Figure 2.
Combined Pav-G1Crack-SNP Pav-G5Crack-SNP DNA tests − phenotypic associations (a). The combined genotypes are indicated with an underscore separating the genotypes of individual SNPs. Coloring of associated phenotypic effects corresponds to Figure 1b and indicates statistical significance. Representative HRM curve from SNP ss490554283, the SNP included in the Pav-G5Crack-SNP DNA test (b); each line represents one seedling (blue = BB, red = AA, green = AB).
-
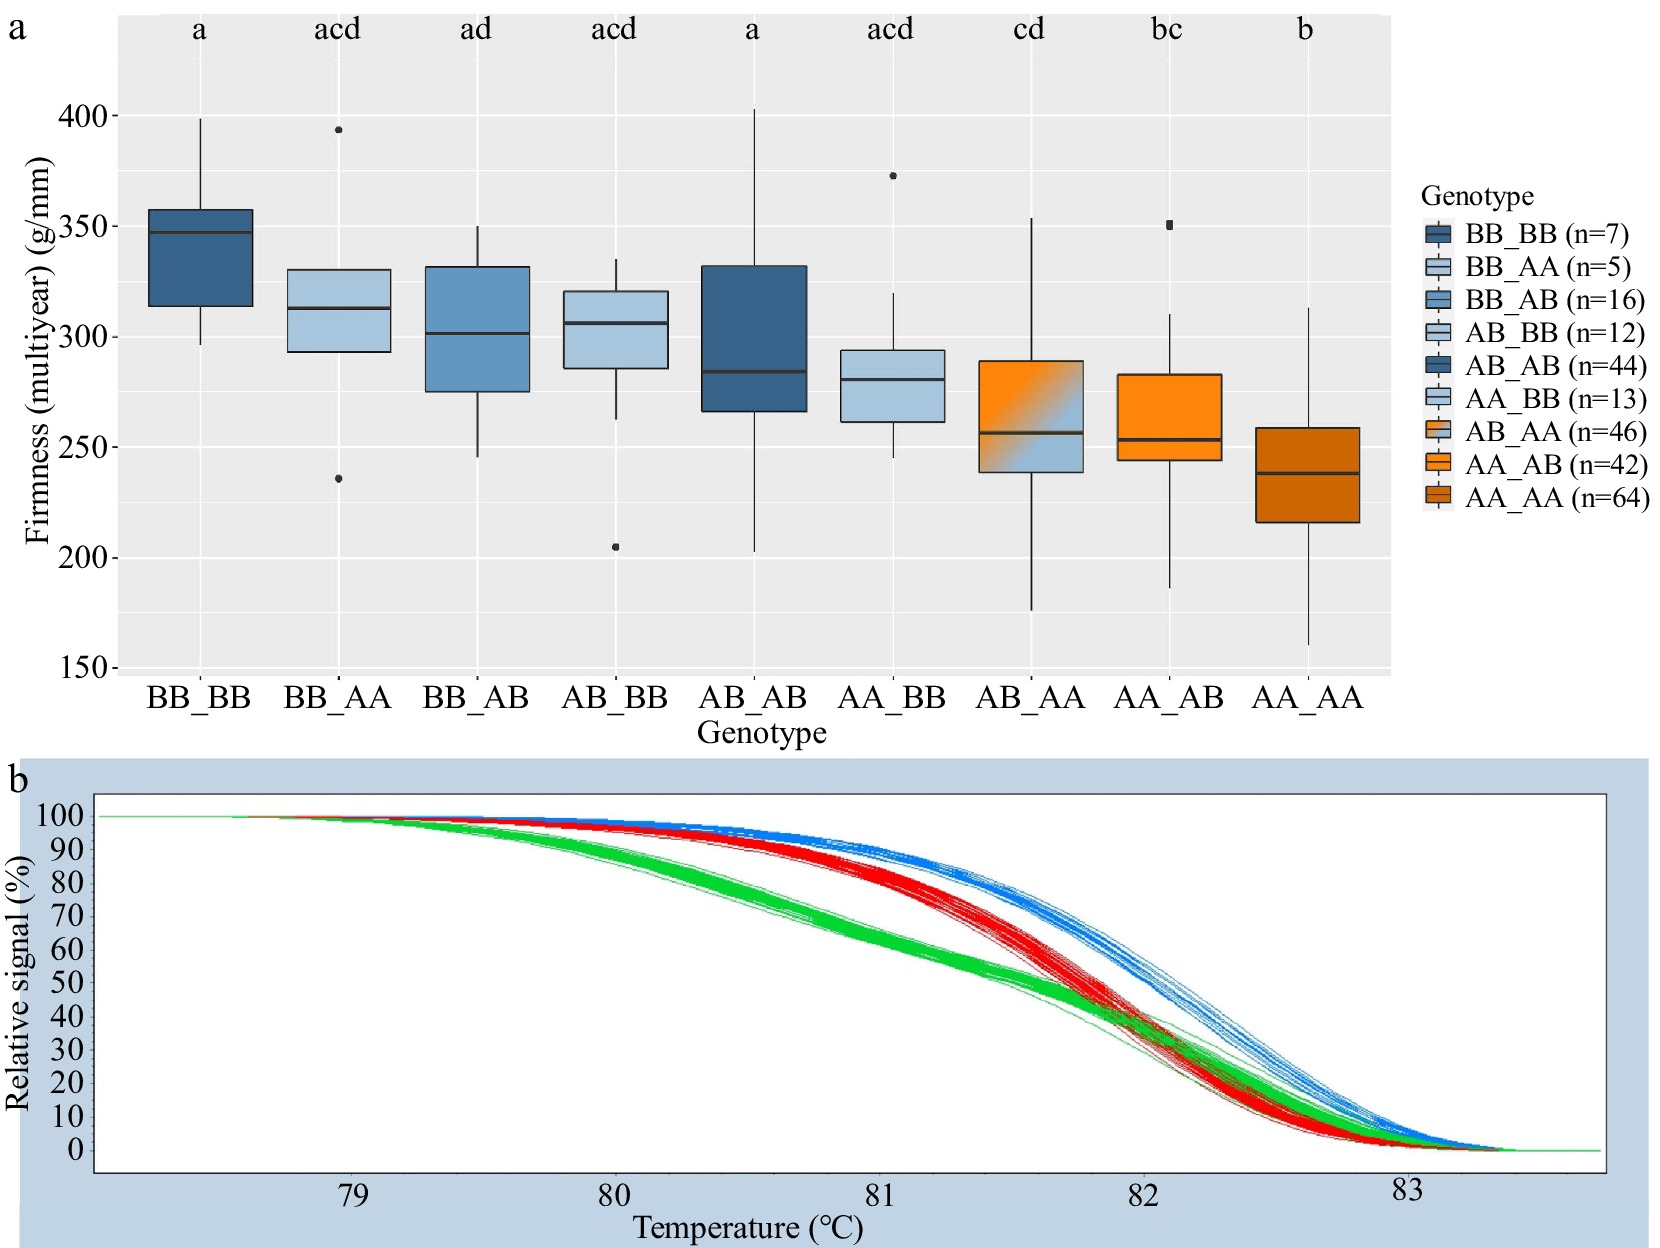
Figure 3.
Combined Pav-G1Firm-SNP and Pav-G3Firm-SNP DNA tests − phenotypic associations (a). The combined genotypes are indicated with an underscore separating genotypes of individual SNPs. Coloring of associated phenotypic effects corresponds to Fig. 1b and indicates statistical significance. Representative HRM curves from SNP ss490546574 of Pav-G1Firm-SNP (b); each line represents one seedling (blue = BB, red = AA, green = AB).
-
Unique SSR
allelesna Unique SSR
haplotypesna Commonb parental sources Commonc SSR
diplotypesn Locus A 195 142 191_215 4 Dhzerlo 193_219/193_219 8 193 346 193_219 97 Benton, Bing, Chelan, Kiona, Rainier, Regina, Tieton 193_219/193_221 44 191 4 193_221 201 Ambrunes, Bing, Chelan, Cowiche, Lapins, Rainier, Sweetheart 193_219/193_225 8 Locus B 215 4 193_225 31 Kordia, Regina 193_219/195_225 26 219 97 193_231 10 Venus 193_221/193_221 39 221 201 193_241 7 Ambrunes 193_221/193_225 12 225 173 195_225 142 Cowiche, Lapins, Sweetheart 193_221/195_225 58 231 10 195_225/193_225 9 241 7 195_225/193_231 7 195_225/195_225 20 a Three seedlings were unable to be scored.
b Parent included if its haplotype(s) was represented at least five times in seedling population, except the 191_215 haplotype (only four times).
c Diplotypes represented five or more times shown.Table 1.
SSR alleles, haplotypes, and common diplotypes for Pav-G5Crack-SSR DNA test.
-
SSR haplotype n 2019 cracking
incidence
(%)2020 cracking
incidence
(%)Multiyear
cracking
incidence (%)SSR diplotype1 n 2019 cracking
incidence
(%)2020 cracking
incidence
(%)Multiyear
cracking
incidence (%)191_215 4 84 abc 92 ab 75 ab 193_219 / 193_219 8 61 ab 78 ab 58 ab 193_219 97 49 bc 68 b 50 b 193_219 / 193_221 44 57 ab 79 b 57 b 193_221 201 53 c 67 b 51 b 193_219 / 193_225 8 36 ab 49 ab 38 ab 193_225 31 28 a 48 ab 36 a 193_219 / 195_225 26 35 ab 51 a 39 a 193_231 10 18 ab 52 ab 33 ab 193_221 / 193_221 39 55 b 70 ab 53 ab 193_241 7 62 abc 69 ab 56 ab 193_221 / 193_225 12 35 ab 65 ab 45 ab 195_225 142 40 ab 51 a 41 a 193_221 / 195_225 58 50 ab 55 a 46 ab 193_225 / 195_225 9 18 a 29 a 25 ab 193_231 / 195_225 7 23 ab 62 ab 39 ab 195_225 / 195_225 20 36 ab 46 a 38 ab Adjusted r2 12% 13% 15% 1 Diplotypes represented five or more times included. Compact letter displays next to each cracking incidence indicate statistical differences ( p < 0.05) among SSR haplotypes' associated cracking incidences within a column (year) Table 2.
Average cracking incidence associated with Pav-G5Crack-SSR haplotypes and diplotypes.
-
Pav-G1Crack-SNP DNA test Pav-G5Crack-SNP DNA test Genotype1 n 2019 cracking
incidence
(%)2020 cracking
incidence
(%)Multiyear
cracking
incidence (%)Genotype1 n 2019 cracking
incidence
(%)2020 cracking
incidence
(%)Multiyear
cracking
incidence (%)AA_AA 76 54 a 69 a 53 a AA 104 56 a 74 a 55 a AA_AB 5 53 abc 76 abc 52 abc AB 114 43 b 55 b 43 b AB_AA 40 48 abc 65 ac 49 ac BB 31 27 c 40 b 33 c AB_AB 79 50 ac 65 ac 50 a BB_AB 17 28 bc 40 bc 32 bc BB_BB 28 27 b 29 b 27 b Adjusted r2 7% 15% 15% 9% 12% 12% 1 Only genotype groups with five or more representatives are shown. Where more than one SNP is in a DNA test, genotype groups are designated as the combined genotype across SNPs, with an underscore separating genotypes of individual SNPs. Compact letter display indicates a significant difference ( p < 0.05) within a column (year). Table 3.
Phenotypic values for two fruit cracking incidence DNA tests.
-
Pav-G1Crack-SNP & Pav-G5Crack-SNP DNA tests Pav-G1Firm-SNP & Pav-G3Firm-SNP DNA tests Genotype1 n 2019 cracking
incidence
(%)2020 cracking
incidence
(%)Multiyear
cracking
incidence (%)Genotype n 2020 firmness
(g/mm)Multiyear firmness
(g/mm)BB_BB_BB 5 11a 10 abc 15 abc BB_BB 7 399 a 341 a BB_AB_AB 5 27 a 21 abc 25 ac BB_AA 5 369 acd 313 acd BB_BB_AB 12 27 a 31 a 25 a BB_AB 16 355 acd 304 ad BB_BB_AA 11 35 a 35 ac 32 ac AB_BB 12 354 acd 296 acd AA_AA_BB 8 35 a 41 abc 35 abc AB_AB 44 343 ad 293 a BB_AB_AA 9 34 a 59 abc 42 abc AA_BB 13 326 abcd 284 acd AB_AB_BB 9 32 a 58 abc 43 abc AB_AA 46 302 bcd 264 cd AB_AA_AB 24 39 a 59 abc 43 abc AA_AB 42 292 bc 261 bc AB_AB_AB 37 45 a 55 a 44 a AA_AA 64 265 b 236 b AA_AA_AB 31 52 a 66 abc 51 abc AA_AA_AA 37 60 a 79 b 58 bc AB_AB_AA 33 62 a 79 bc 59 bc AB_AA_AA 12 74 a 91 bc 68 b Adjusted r2 16% 30% 29% 22% 28% 1 Only genotype groups with five or more representatives are shown. Genotype groups are designated as combined genotype across multiple SNPs of a DNA test, with an underscore separating genotypes of individual SNPs. Compact letter display indicates statistical difference ( p < 0.05) within a column (year). Table 4.
Phenotypic values for combined DNA tests.
-
Pav-G1Firm-SNP DNA test Pav-G3Firm-SNP DNA test Genotype n 2020 firmness (g/mm) Multiyear firmness (g/mm) Genotype n 2020 firmness (g/mm) Multiyear firmness (g/mm) AA 119 281 a 251 a AA 115 284 a 241 a AB 102 326 b 281 b AB 102 323 b 281 b BB 28 370 c 316 c BB 32 353 b 301 b Adjusted r2 16% 19% 11% 14% Compact letter display indicates significant difference (p < 0.05) within a column (year). Table 5.
Phenotypic values for two fruit firmness DNA tests.
Figures
(3)
Tables
(5)