-
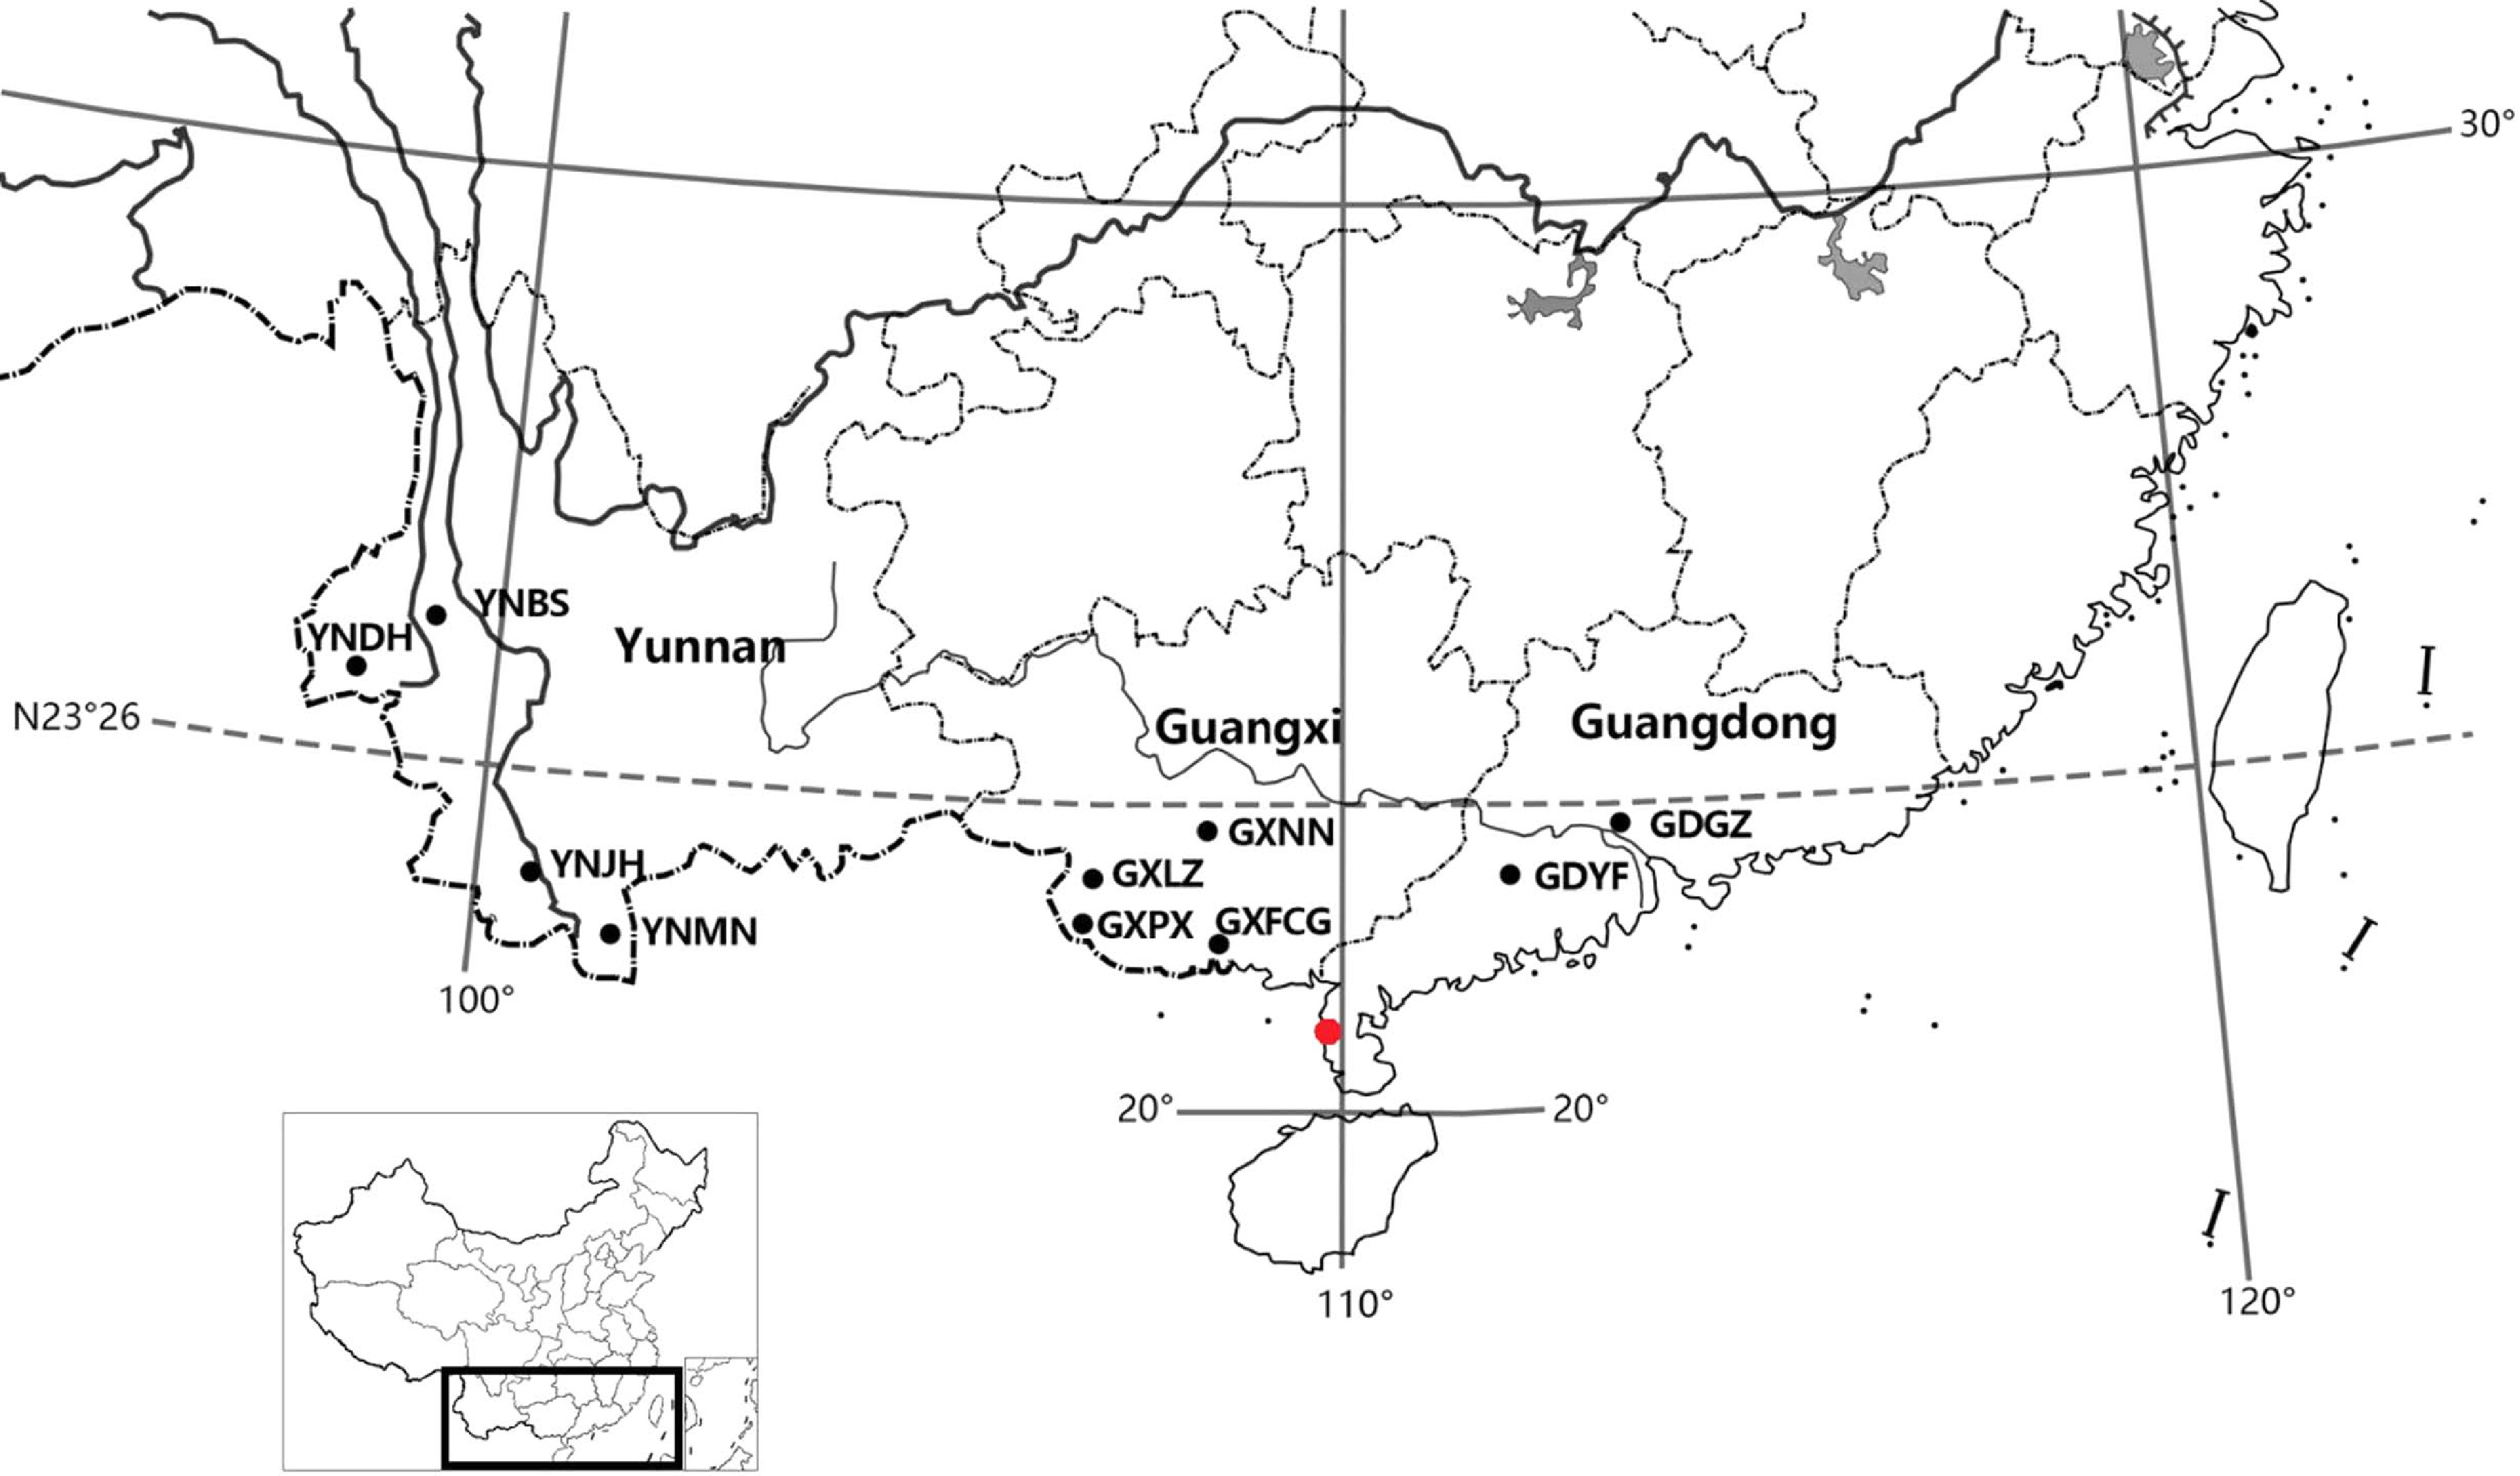
Figure 1.
Geographic origins of the 10 N. cadamba provenances (black dots) and location of the test site (red dot).
-
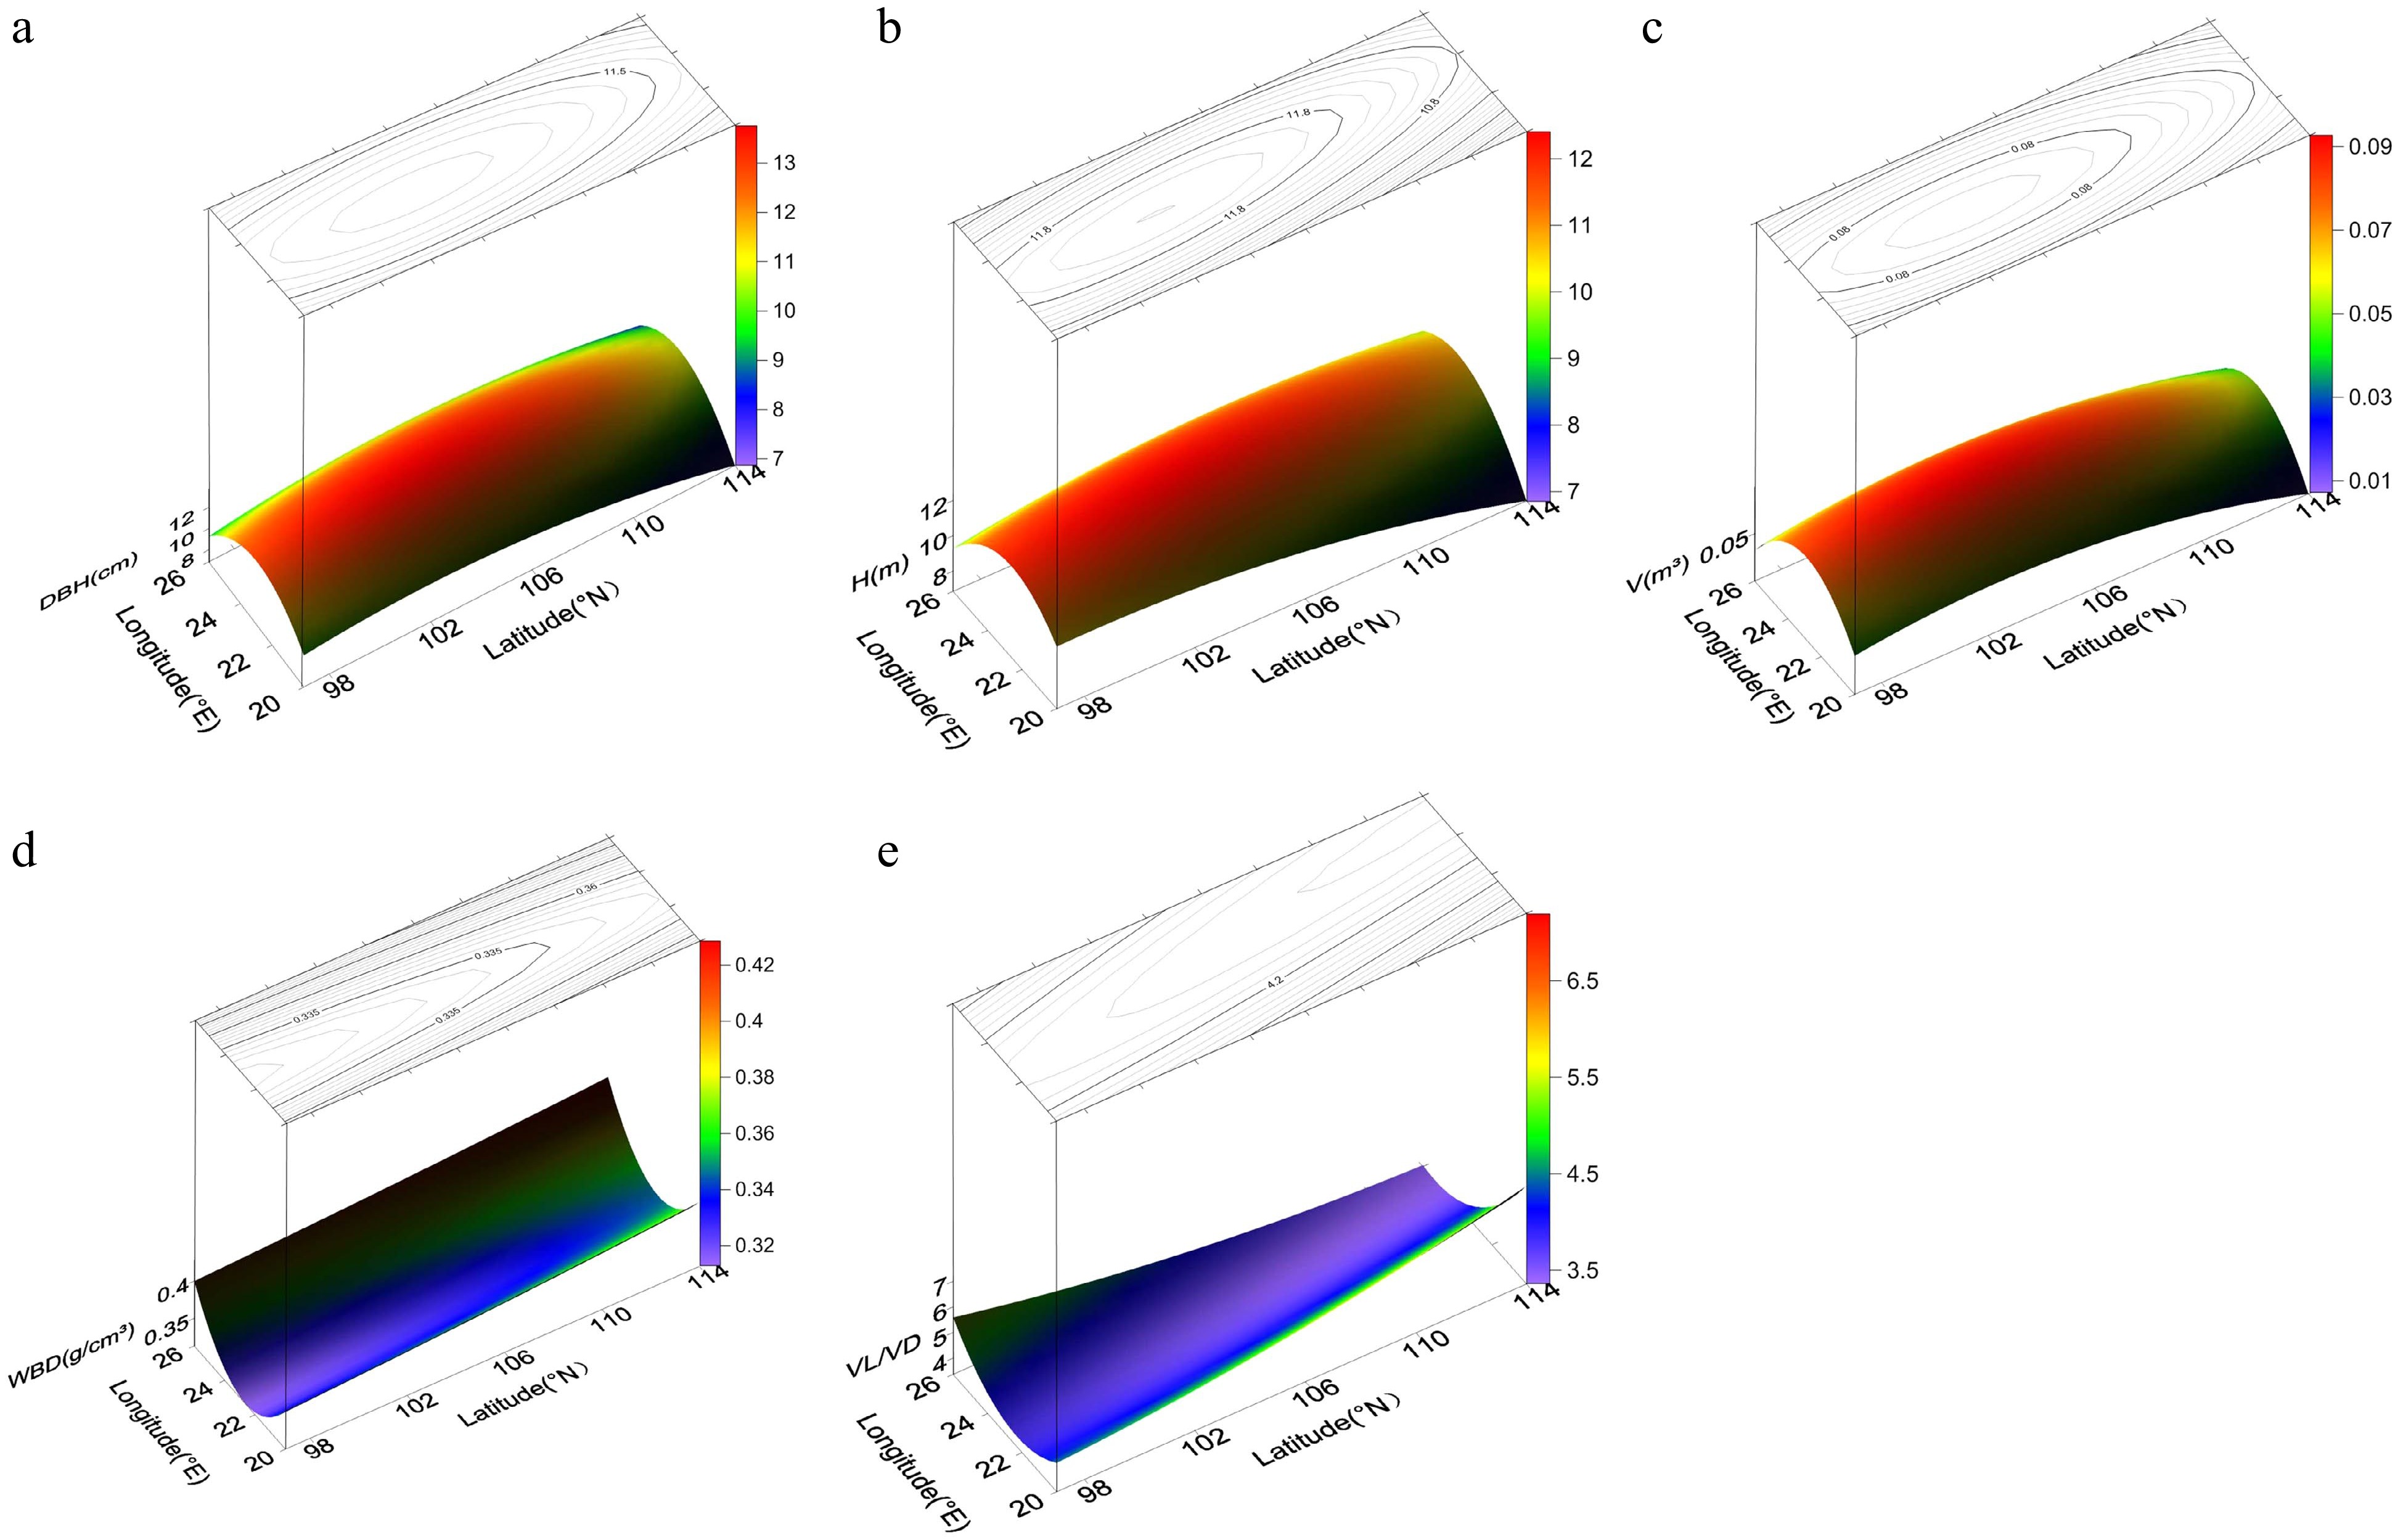
Figure 2.
Power contour-trend surfaces for (a) diameter breast height (DBH), (b) height (H), (c) volume (V), (d) wood basic density (WBD), and (e) vessel length/vessel diameter (VL/VD) of N. cadamba. The surface represents geographic variation, and the lines on the surface represent contours.
-
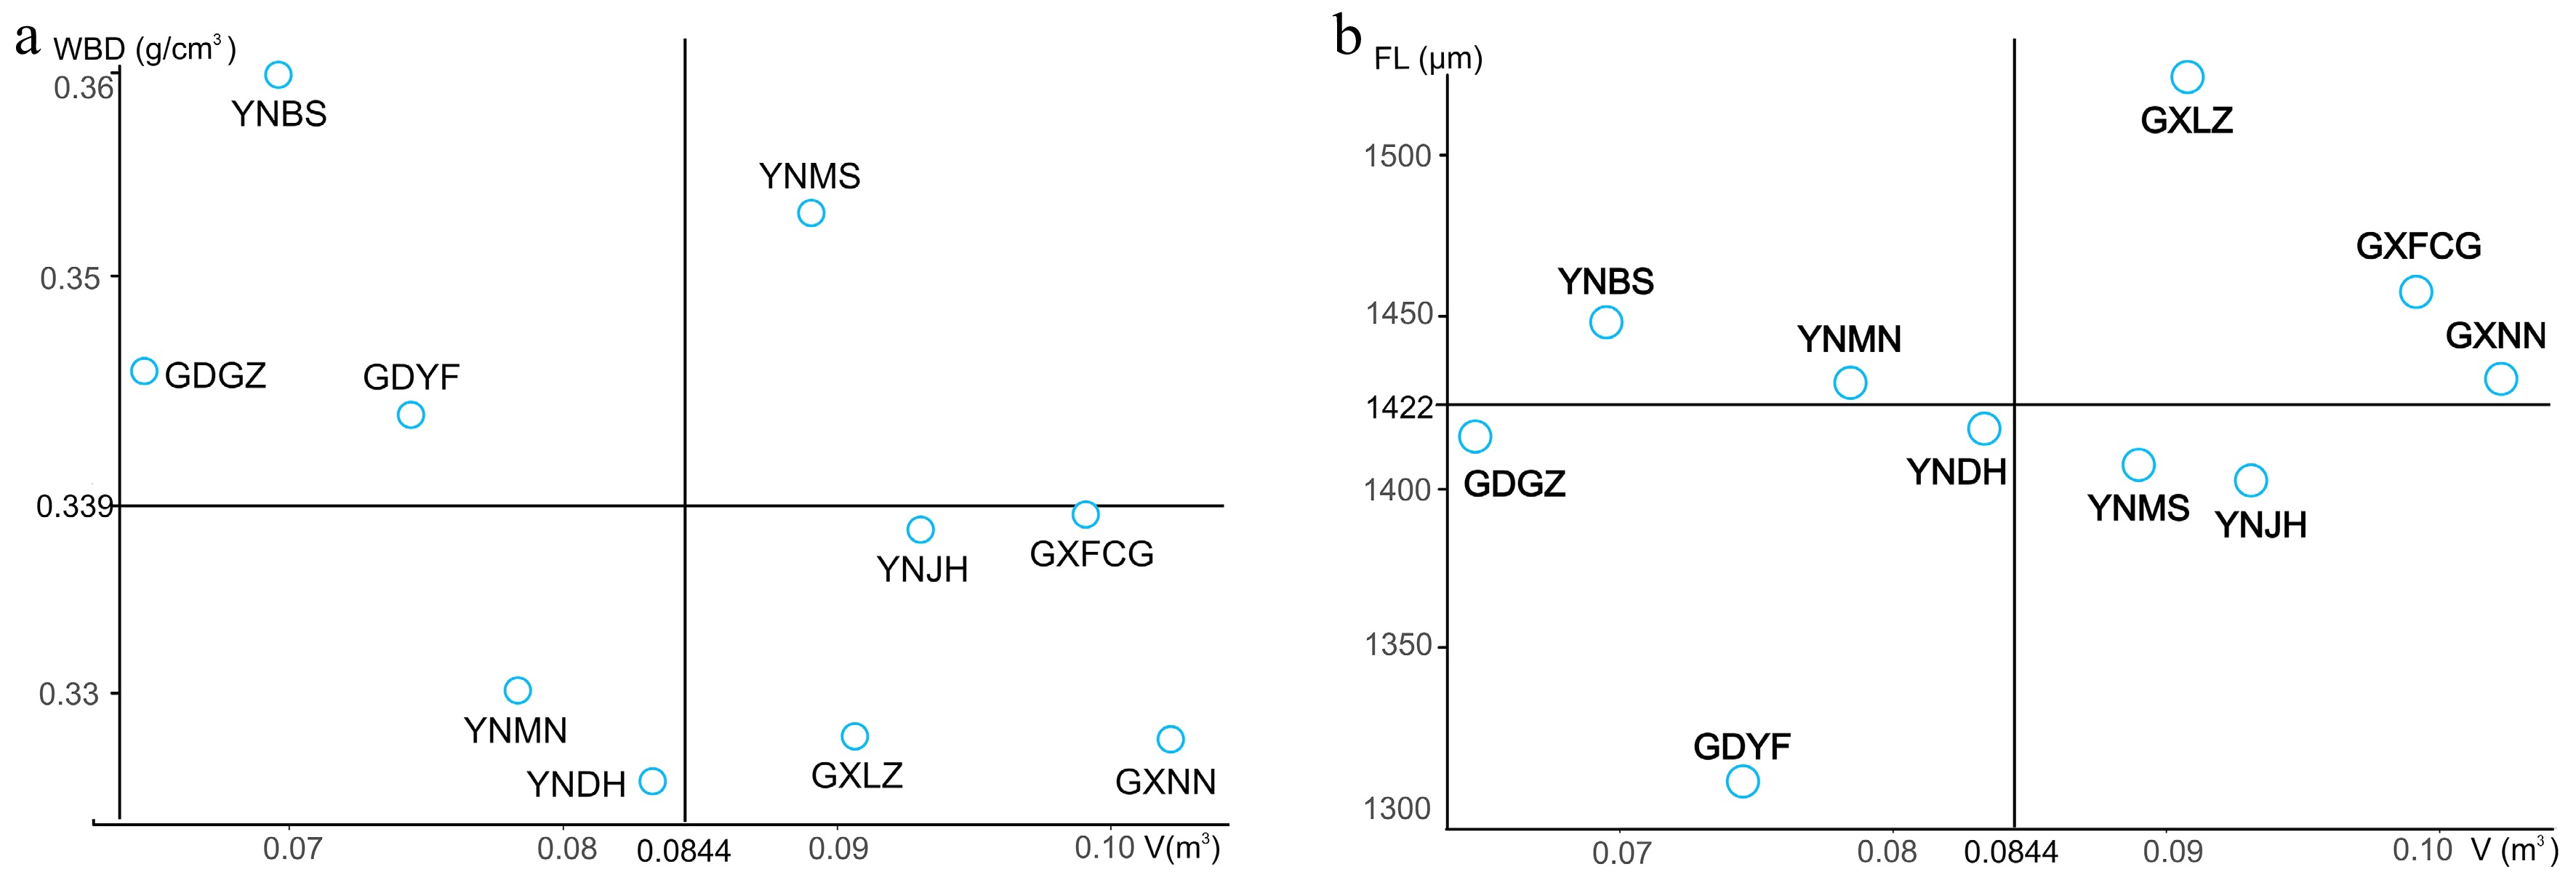
Figure 3.
Selection of superior provenances for wood products (a) and pulpwood (b).
-
Trait Provenance Mean Minimum Maximum CV (%) DBH (cm) GXLZ 12.92 ± 0.52ab 4.10 20.80 28.88 GXFCG 13.31 ± 0.45a 7.00 20.90 24.74 GXNN 13.26 ± 0.52a 4.40 20.10 28.84 GDGZ 11.41 ± 0.49b 5.60 19.30 28.07 GDYF 12.03 ± 0.56ab 4.80 20.10 30.12 YNBS 11.66 ± 0.50ab 4.20 17.80 27.86 YNDH 12.20 ± 0.54ab 3.90 19.80 31.54 YNJH 13.22 ± 0.44a 6.50 18.20 21.94 YNMS 13.01 ± 0.47ab 5.70 20.80 26.00 YNMN 12.14 ± 0.55ab 5.20 19.70 29.86 H (m) GXLZ 12.01 ± 0.54abcd 1.00 19.00 32.22 GXFCG 12.98 ± 0.44ab 7.00 19.50 24.79 GXNN 13.09 ± 0.46a 6.00 19.00 25.64 GDGZ 10.91 ± 0.51d 4.00 17.30 30.44 GDYF 11.28 ± 0.52cd 5.00 17.00 29.91 YNBS 11.29 ± 0.56cd 5.00 18.00 32.74 YNDH 11.91 ± 0.53abcd 4.00 19.00 31.75 YNJH 12.78 ± 0.46abc 7.00 18.00 23.64 YNMS 12.12 ± 0.48abcd 5.00 18.00 28.60 YNMN 11.43 ± 0.53bcd 5.00 18.00 30.81 V (m3) GXLZ 0.0907 ± 0.0096ab 0.0025 0.3033 75.40 GXFCG 0.0991 ± 0.0091a 0.0127 0.3143 67.23 GXNN 0.1022 ± 0.0095a 0.0043 0.2833 68.04 GDGZ 0.0647 ± 0.0078b 0.0058 0.2378 78.95 GDYF 0.0745 ± 0.0085ab 0.0043 0.2236 73.91 YNBS 0.0695 ± 0.0080b 0.0040 0.2104 75.09 YNDH 0.0833 ± 0.0094ab 0.0022 0.2504 80.04 YNJH 0.0930 ± 0.0083ab 0.0109 0.2128 58.79 YNMS 0.0890 ± 0.0079ab 0.0060 0.2249 64.20 YNMN 0.0784 ± 0.0096ab 0.0060 0.2291 81.63 H, height; DBH, diameter at breast height; V, volume; CV, coefficient of variation. In column three, values within a trait that share lowercase superscripts are not significantly different according to Duncan's multiple range test (p = 0.05). Table 1.
Comparison of growth traits among provenances of N. cadamba.
-
Trait Provenance Mean Minimum Maximum CV (%) FL (μm) GXLZ 1,525.52 ± 21.43a 1,442.72 1,635.32 3.97 GXFCG 1,459.09 ± 45.27a 1,191.38 1,630.81 9.81 GXNN 1,432.45 ± 23.75ab 1,334.34 1,555.94 5.50 GDGZ 1,411.77 ± 38.03ab 1,127.74 1547.69 9.33 GDYF 1,303.55 ± 70.03b 1,152.66 1,428.27 10.74 YNBS 1,450.56 ± 35.81a 1,072.86 1,692.28 11.84 YNDH 1,415.46 ± 24.41ab 1180.88 1,619.33 8.27 YNJH 1,398.71 ± 21.27ab 1,100.28 1,661.14 9.86 YNMS 1,403.86 ± 34.67ab 1,259.07 1,554.06 6.98 YNMN 1,428.68 ± 31.09ab 1,184.37 1,618.10 8.70 FD (μm) GXLZ 32.99 ± 0.40a 30.86 34.26 3.47 GXFCG 32.11 ± 0.44ab 29.11 33.39 4.29 GXNN 32.65 ± 0.28a 31.51 34.56 2.80 GDGZ 32.60 ± 0.38a 29.61 34.24 4.08 GDYF 31.35 ± 0.35b 30.36 32.02 2.25 YNBS 32.31 ± 0.32ab 28.45 35.85 4.73 YNDH 32.57 ± 0.21a 30.54 34.27 3.03 YNJH 32.38 ± 0.18ab 28.66 34.20 3.67 YNMS 31.96 ± 0.35ab 30.24 32.97 3.14 YNMN 32.30 ± 0.25ab 30.30 33.84 3.11 FL/FD GXLZ 46.27 ± 0.72a 44.18 50.27 4.40 GXFCG 45.37 ± 0.98a 40.93 48.85 6.81 GXNN 43.87 ± 0.57ab 41.84 47.78 4.30 GDGZ 43.23 ± 0.74ab 36.96 45.73 5.94 GDYF 41.53 ± 1.89b 37.97 44.99 9.10 YNBS 44.77 ± 0.77a 37.71 49.41 8.24 YNDH 43.42 ± 0.59ab 37.50 50.06 6.55 YNJH 43.15 ± 0.54ab 36.98 50.55 8.15 YNMS 43.90 ± 0.78ab 40.96 47.38 5.00 YNMN 44.22 ± 0.86ab 37.16 50.98 7.82 VL (μm) GXLZ 696.34 ± 33.29a 572.87 873.28 13.52 GXFCG 656.88 ± 26.47ab 522.80 802.90 12.74 GXNN 601.42 ± 20.41b 521.48 732.25 11.26 GDGZ 643.94 ± 19.49ab 551.55 748.09 10.48 GDYF 676.82 ± 60.44ab 549.34 823.63 17.86 YNBS 691.06 ± 20.35a 547.53 875.98 14.12 YNDH 651.15 ± 23.54ab 491.42 866.51 17.34 YNJH 659.95 ± 12.82ab 532.67 833.18 12.59 YNMS 654.00 ± 26.61ab 550.01 787.49 11.51 YNMN 639.87 ± 16.40ab 551.43 822.21 10.25 VD (μm) GXLZ 176.31 ± 5.97a 151.27 195.29 9.58 GXFCG 164.43 ± 9.94ab 108.29 207.51 19.11 GXNN 165.83 ± 6.23ab 140.70 203.94 12.46 GDGZ 168.49 ± 10.19ab 120.39 243.96 20.95 GDYF 144.87 ± 12.75b 118.55 177.27 17.60 YNBS 158.96 ± 5.95ab 107.95 226.68 17.97 YNDH 162.25 ± 6.13ab 111.55 231.30 18.11 YNJH 160.13 ± 3.27ab 99.36 193.57 13.25 YNMS 157.31 ± 7.60ab 120.70 176.66 13.67 YNMN 165.72 ± 5.31ab 129.60 213.93 12.81 VL/VD GXLZ 3.95 ± 0.12bc 3.57 4.60 8.73 GXFCG 4.06 ± 0.15bc 3.56 4.83 11.75 GXNN 3.65 ± 0.12c 3.06 4.50 10.81 GDGZ 3.93 ± 0.19bc 2.86 4.90 16.33 GDYF 4.68 ± 0.21a 4.16 5.17 8.90 YNBS 4.41 ± 0.11ab 3.52 5.64 12.43 YNDH 4.08 ± 0.15bc 3.28 5.68 17.72 YNJH 4.16 ± 0.09abc 3.10 5.63 13.27 YNMS 4.22 ± 0.24ab 3.12 5.19 15.88 YNMN 3.89 ± 0.10bc 3.33 4.77 10.07 WBD (g/cm3) GXLZ 0.3275 ± 0.0101bc 0.2886 0.3782 8.74 GXFCG 0.3389 ± 0.0099abc 0.2878 0.3896 9.20 GXNN 0.3274 ± 0.0081bc 0.2980 0.3820 8.21 GDGZ 0.3457 ± 0.0067abc 0.3188 0.3900 6.69 GDYF 0.3435 ± 0.0160abc 0.3146 0.3892 9.31 YNBS 0.3600 ± 0.0046a 0.3302 0.4128 6.15 YNDH 0.3253 ± 0.0048c 0.2656 0.3660 7.13 YNJH 0.3381 ± 0.0042abc 0.2960 0.3958 8.14 YNMS 0.3533 ± 0.0085ab 0.3252 0.3872 6.83 YNMN 0.3298 ± 0.0092bc 0.2606 0.4000 11.13 Cr (%) GXLZ 50.24 ± 0.89a 47.9 53.96 5.04 GXFCG 50.15 ± 0.45a 47.44 51.81 2.87 GXNN 52.17 ± 0.70a 47.84 56.36 4.43 GDGZ 50.62 ± 0.85a 45.17 55.38 5.80 GDYF 51.19 ± 0.62a 49.87 52.77 2.43 YNBS 51.90 ± 0.67a 45.91 55.79 6.22 YNDH 51.87 ± 0.47a 47.93 58.23 4.33 YNJH 52.10 ± 0.47a 40.95 61.11 5.87 YNMS 52.62 ± 0.84a 50.05 57.39 4.50 YNMN 50.63 ± 0.76a 45.73 56.01 6.00 FL, fiber length; FD, fiber diameter; FL/FD, the ratio of FL to FD; VL, vessel length; VD, vessel diameter; VL/VD, the ratio of VL to VD; WBD, wood basic density; Cr, Degree of crystallinity; CV, coefficient of variation. In column three, values within a trait that share lowercase superscripts are not significantly different according to Duncan’s multiple range test (p = 0.05). Table 2.
Comparison of wood properties among provenances of N. cadamba.
-
Trait VP
(SE)VPB
(SE)Ve
(SE)h2 CVG (%) DBH 0.47
(0.22)0.08
(0.07)8.97
(0.32)0.67 5.46 H 0.23
(0.14)0.26
(0.10)5.46
(0.19)0.59 4.00 V 9.98e−05
(5.91e−05)3.39e−05
(2.64e−05)2.17e−03
(7.85e−05)0.64 11.83 FL 69.50
(533.00)NE 17,595.30
(2037.00)0.02 0.59 FD 0.00
(0.03)NE 1.41
(0.16)NE NE FL/FD 0.31
(0.46)NE 10.03
(1.16)0.16 1.26 VL 94.03
(277.50)NE 7,771.29
(900.80)0.07 1.48 VD 0.00
(17.78)NE 644.00
(74.50)NE NE VL/VD 3.52e−02
(2.81e−02)NE 0.31
(0.03)0.40 4.57 WBD 1.01e−04
(7.48e−05)NE 7.35e−04
(8.56e−05)0.45 2.96 Cr 0.16
(0.31)NE 7.61
(0.88)0.11 0.78 H, height; DBH, diameter at breast height; V, volume; FL, fiber length; FD, fiber diameter; FL/FD, the ratio of FL to FD; VL, vessel length; VD, vessel diameter; VL/VD, the ratio of VL to VD; WBD, wood basic density; Cr, degree of crystallinity; VP, provenance variance; VPB, provenance by block interaction variance; Ve, random error variance; h2, provenance heritability; CVG genetic variation coefficient; SE, standard error. NE, not estimated and assumed to be zero. Table 3.
Variance components, provenance heritabilities, and genetic variation coefficients among the provenances.
-
DBH
(SE)H
(SE)V
(SE)FL
(SE)FD
(SE)FL/FD
(SE)VL
(SE)VD
(SE)VL/VD
(SE)WBD
(SE)Cr
(SE)DBH 0.97
(0.01)0.99
(0.01)−0.07
(0.27)NE −0.21
(0.69)−0.22
(0.24)NE −0.05
(0.15)−0.17
(0.16)−0.02
(0.42)H 0.87
(0.01)0.97
(0.02)0.10
(0.37)NE 0.01
(0.19)−0.18
(0.26)NE −0.03
(0.12)−0.16
(0.12)−0.02
(0.34)V 0.98
(0.01)0.91
(0.05)−0.09
(0.19)NE −0.15
(0.39)−0.15
(0.30)NE −0.02
(0.13)−0.18
(0.15)−0.03
(0.41)FL 0.34
(0.07)0.39
(0.07)0.36
(0.07)NE 0.99
(0.01)0.58
(0.82)NE 0.17
(0.22)0.01
(0.45)−0.14
(0.17)FD 0.32
(0.07)0.32
(0.07)0.30
(0.07)0.71
(0.04)NE NE NE NE NE NE FL/FD 0.28
(0.08)0.34
(0.07)0.30
(0.07)0.99
(0.01)0.41
(0.07)−0.02
(0.58)NE 0.17
(0.83)0.46
(0.79)−0.41
(0.68)VL 0.17
(0.08)0.18
(0.08)0.16
(0.08)0.60
(0.05)0.70
(0.10)0.51
(0.06)NE 0.66
(0.01)0.44
(0.56)0.09
(0.69)VD 0.41
(0.07)0.39
(0.07)0.38
(0.07)0.70
(0.04)0.99
(0.07)0.56
(0.06)0.47
(0.23)NE NE NE VL/VD −0.35
(0.07)−0.31
(0.09)−0.31
(0.08)−0.28
(0.08)−0.53
(0.10)−0.20
(0.08)0.57
(0.16)−0.66
(0.05)0.02
(0.19)0.87
(0.82)WBD −0.12
(0.08)−0.11
(0.08)−0.10
(0.08)−0.14
(0.08)−0.52
(0.10)−0.02
(0.08)−0.99
(0.86)−0.28
(0.07)0.20
(0.09)0.29
(0.81)Cr −0.12
(0.08)−0.08
(0.08)−0.07
(0.08)−0.02
(0.12)−0.06
(0.08)0.02
(0.12)0.07
(0.08)−0.15
(0.12)0.18
(0.08)0.14
(0.08)Above the diagonal are genetic correlations, and below the diagonal are phenotypic correlations. H, height; DBH, diameter at breast height; V, volume; FL, fiber length; FD, fiber diameter; FL/FD, the ratio of FL to FD; VL, vessel length; VD, vessel diameter; VL/VD, the ratio of VL to VD; WBD, wood basic density; Cr, degree of crystallinity; SE, Standard error. NE, not estimated and assumed to be zero. Table 4.
Genetic (rg) and phenotypic (rP) correlations between all studied traits.
-
Trait Regression equation of trend surface analysis Fitting coefficient p-value DBH Z = −393.1 + 14.85x + 4.574y − 0.3657x2 − 0.02434y2 + 0.01936xy 0.0195 7.34e−07 H Z = −169.6 + 7.012x + 1.971y−0.2409x2− 0.01412y2 + 0.04008xy 0.0153 1.68e−05 V Z = −5.54 + 0.2083x + 0.06306y − 0.004804x2 − 0.0003198y2 + 0.0001185xy 0.0171 4.73e−06 FL Z = −16750 + 145.6x + 309.1y − 7.195x2 − 1.695y2 + 2.044xy 0.0409 0.2709 FD Z = 76.805095 − 2.054393x − 0.447867y − 0.099681x2 − 0.005207y2 + 0.06647xy 0.0226 0.6524 FL/FD Z = −587.30009 + 7.92364x + 10.20365y − 0.11231x2 − 0.04611y2 − 0.02193xy 0.0578 0.1059 VL Z = −691.3203 − 145.7474x + 58.2785y + 11.404x2 + 0.1355y2 − 3.7184xy 0.0372 0.3282 VD Z = −531.15 + 12.6525x + 9.5999y − 2.3297x2 − 0.1494y2 + 0.9469xy 0.0230 0.6162 VL/VD Z = 25.438914 − 1.402947x − 0.076717y + 0.135262x2 + 0.005649y2 − 0.047789xy 0.1181 0.0018 WBD Z = 4.142 − 0.3356x − 0.002205y + 0.00756x2 + 0.00002628y2 − 0.0000636xy 0.0272 0.0007 Cr Z = 305.50611 − 11.71736x − 2.30488y + 0.06669x2 + 0.00115y2 + 0.08674xy 0.0309 0.4412 H, height; DBH, diameter at breast height; V, volume; FL, fiber length; FD, fiber diameter; FL/FD, ratio of FL to FD; VL, vessel length; VD, vessel diameter; VL/VD, ratio of VL to VD; WBD, wood basic density; Cr, degree of crystallinity. Table 5.
Regression equations obtained by binary quadratic trend surface analysis.
-
Purpose Wood products Pulpwood Trait Overall mean Mean value of superior provenance G (%) Mean value of superior provenances G (%) DBH (cm) 12.52 ± 0.22 13.01 ± 0.47 3.91 13.16 ± 0.12 5.11 H (m) 11.98 ± 0.24 12.12 ± 0.48 1.17 12.69 ± 0.34 5.93 V (m3) 0.08 ± 0.00 0.09 ± 0.01 12.50 0.10 ± 0.00 25.00 FL (μm) 1,422.97 ± 17.67 1,403.86 ± 34.67 −1.34 1,472.35 ± 27.67 3.47 FD (μm) 32.32 ± 0.14 31.96 ± 0.35 −1.11 32.58 ± 0.26 0.80 FL/FD 43.97 ± 0.41 43.90 ± 0.78 −0.16 45.17 ± 0.70 2.73 VL (μm) 657.14 ± 8.63 654.00 ± 26.61 −0.48 651.55 ± 27.53 −0.85 VD (μm) 162.43 ± 2.60 157.31 ± 7.60 −3.15 168.86 ± 3.75 3.96 VL/VD 4.10 ± 0.09 4.22 ± 0.24 2.93 3.89 ± 0.12 −5.12 WBD (g/cm3) 0.34 ± 0.00 0.35 ± 0.01 2.94 0.33 ± 0.00 −2.94 Cr (%) 51.35 ± 0.28 52.62 ± 0.84 2.47 50.85 ± 0.66 −0.97 Table 6.
Realized gains in all studied traits based on selection of superior N. cadamba provenances using the overall mean of each trait as a threshold.
-
Provenance Latitude
(°N)Longitude
(°E)Altitude
(m)Annual average temperature
(°C)Minimum temperature
(°C)Maximum temperature
(°C)Frostless
period
(d)Average annual precipitation
(mm)GXLZ 22.36 106.84 269 22.2 0.8 39.9 352 1,260 GXFCG 21.77 107.35 235 21.8 1.4 37.8 360 2,512 GXNN 22.85 108.4 80 21.7 −2.4 40.4 364 1,304.2 GDGZ 23.1 113.21 10 22.1 0 39.3 346 1,696.5 GDYF 22.1 112.02 346 21.5 −1 39.1 345 1,670.5 YNBS 25.08 99.16 1670 17.4 −4.2 40.4 283 1,710 YNDH 24.08 97.39 780 18.9 −2.9 35.7 299 1,544 YNJH 21.02 101.04 552.7 21 2.7 41.1 365 1,197 YNMS 24.2 98.95 913 19.6 −0.6 36.2 315 1,650 YNMN 21.4 101.3 631 21 0.5 38.4 331 1,540 Table 7.
Geographic locations of the sampled N. cadamba populations and their climatic properties
Figures
(3)
Tables
(7)