-
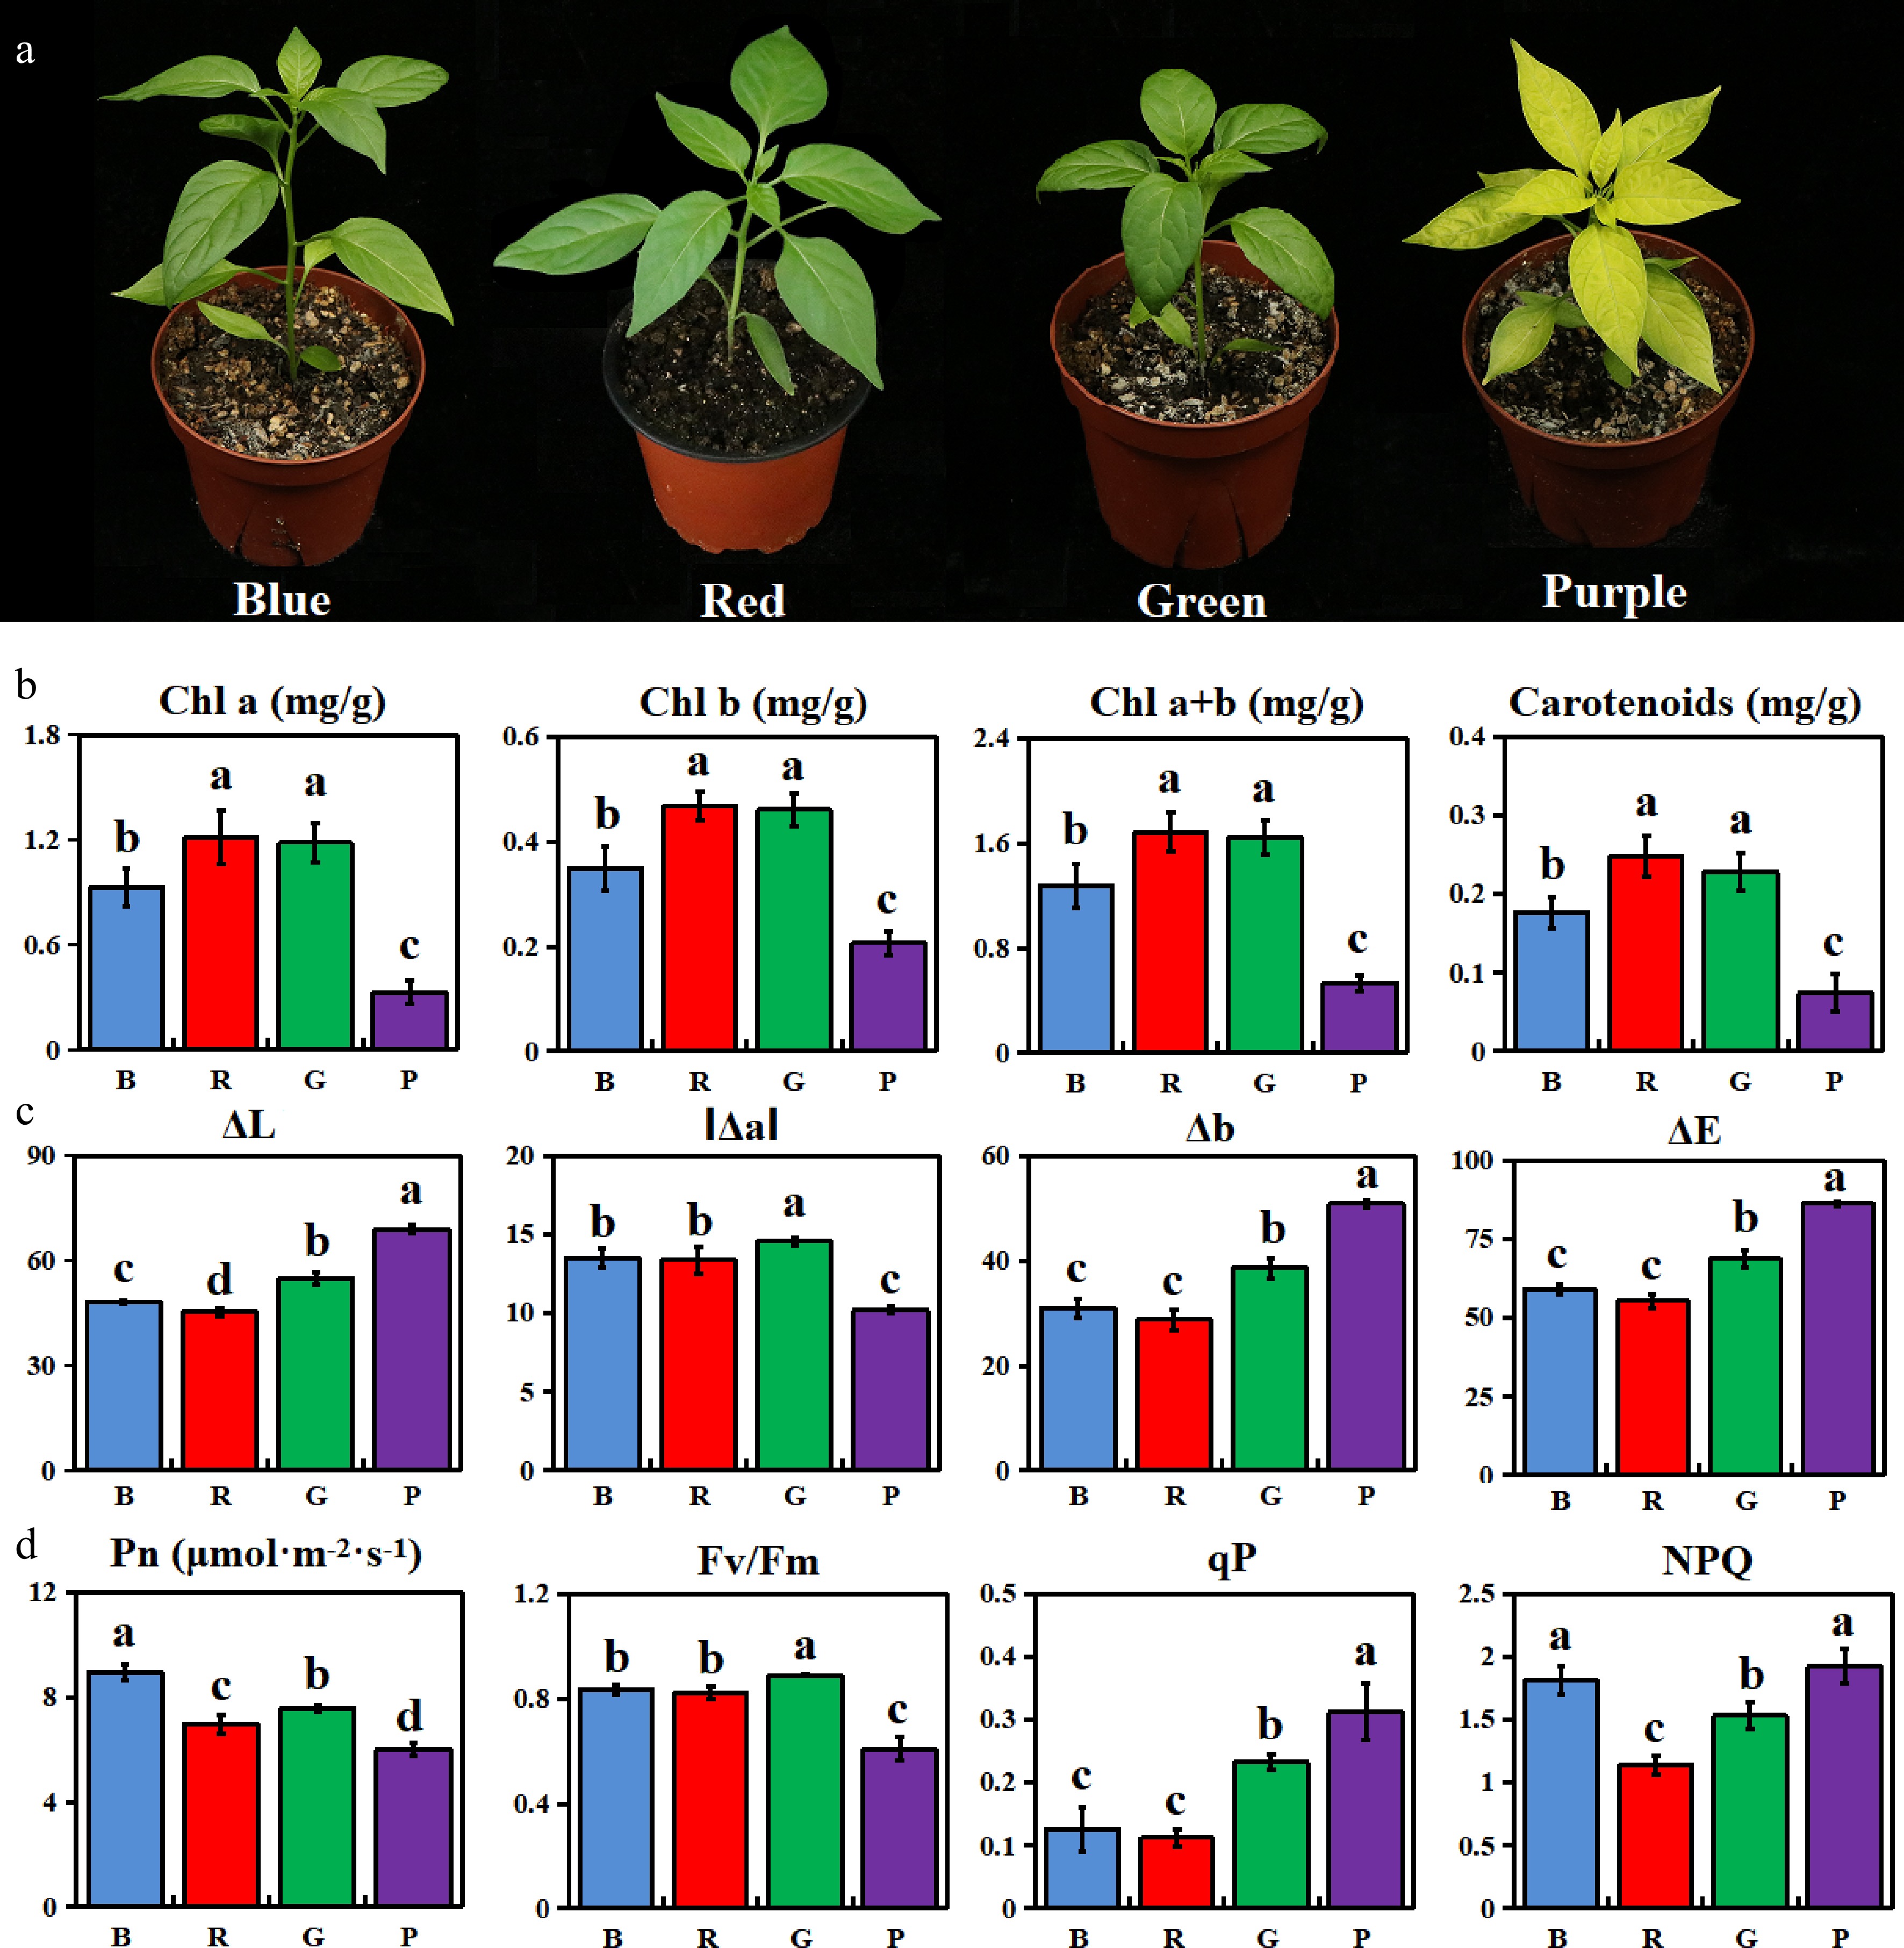
Figure 1.
Analysis of phenotypes and physiological characteristics of mutants under different light qualities. (a) Phenotypic identification of pepper leaves; (b) Photosynthetic pigment content; (c) Color chromaticity value; (d) Characteristics of photosynthesis and chlorophyll fluorescence.
-
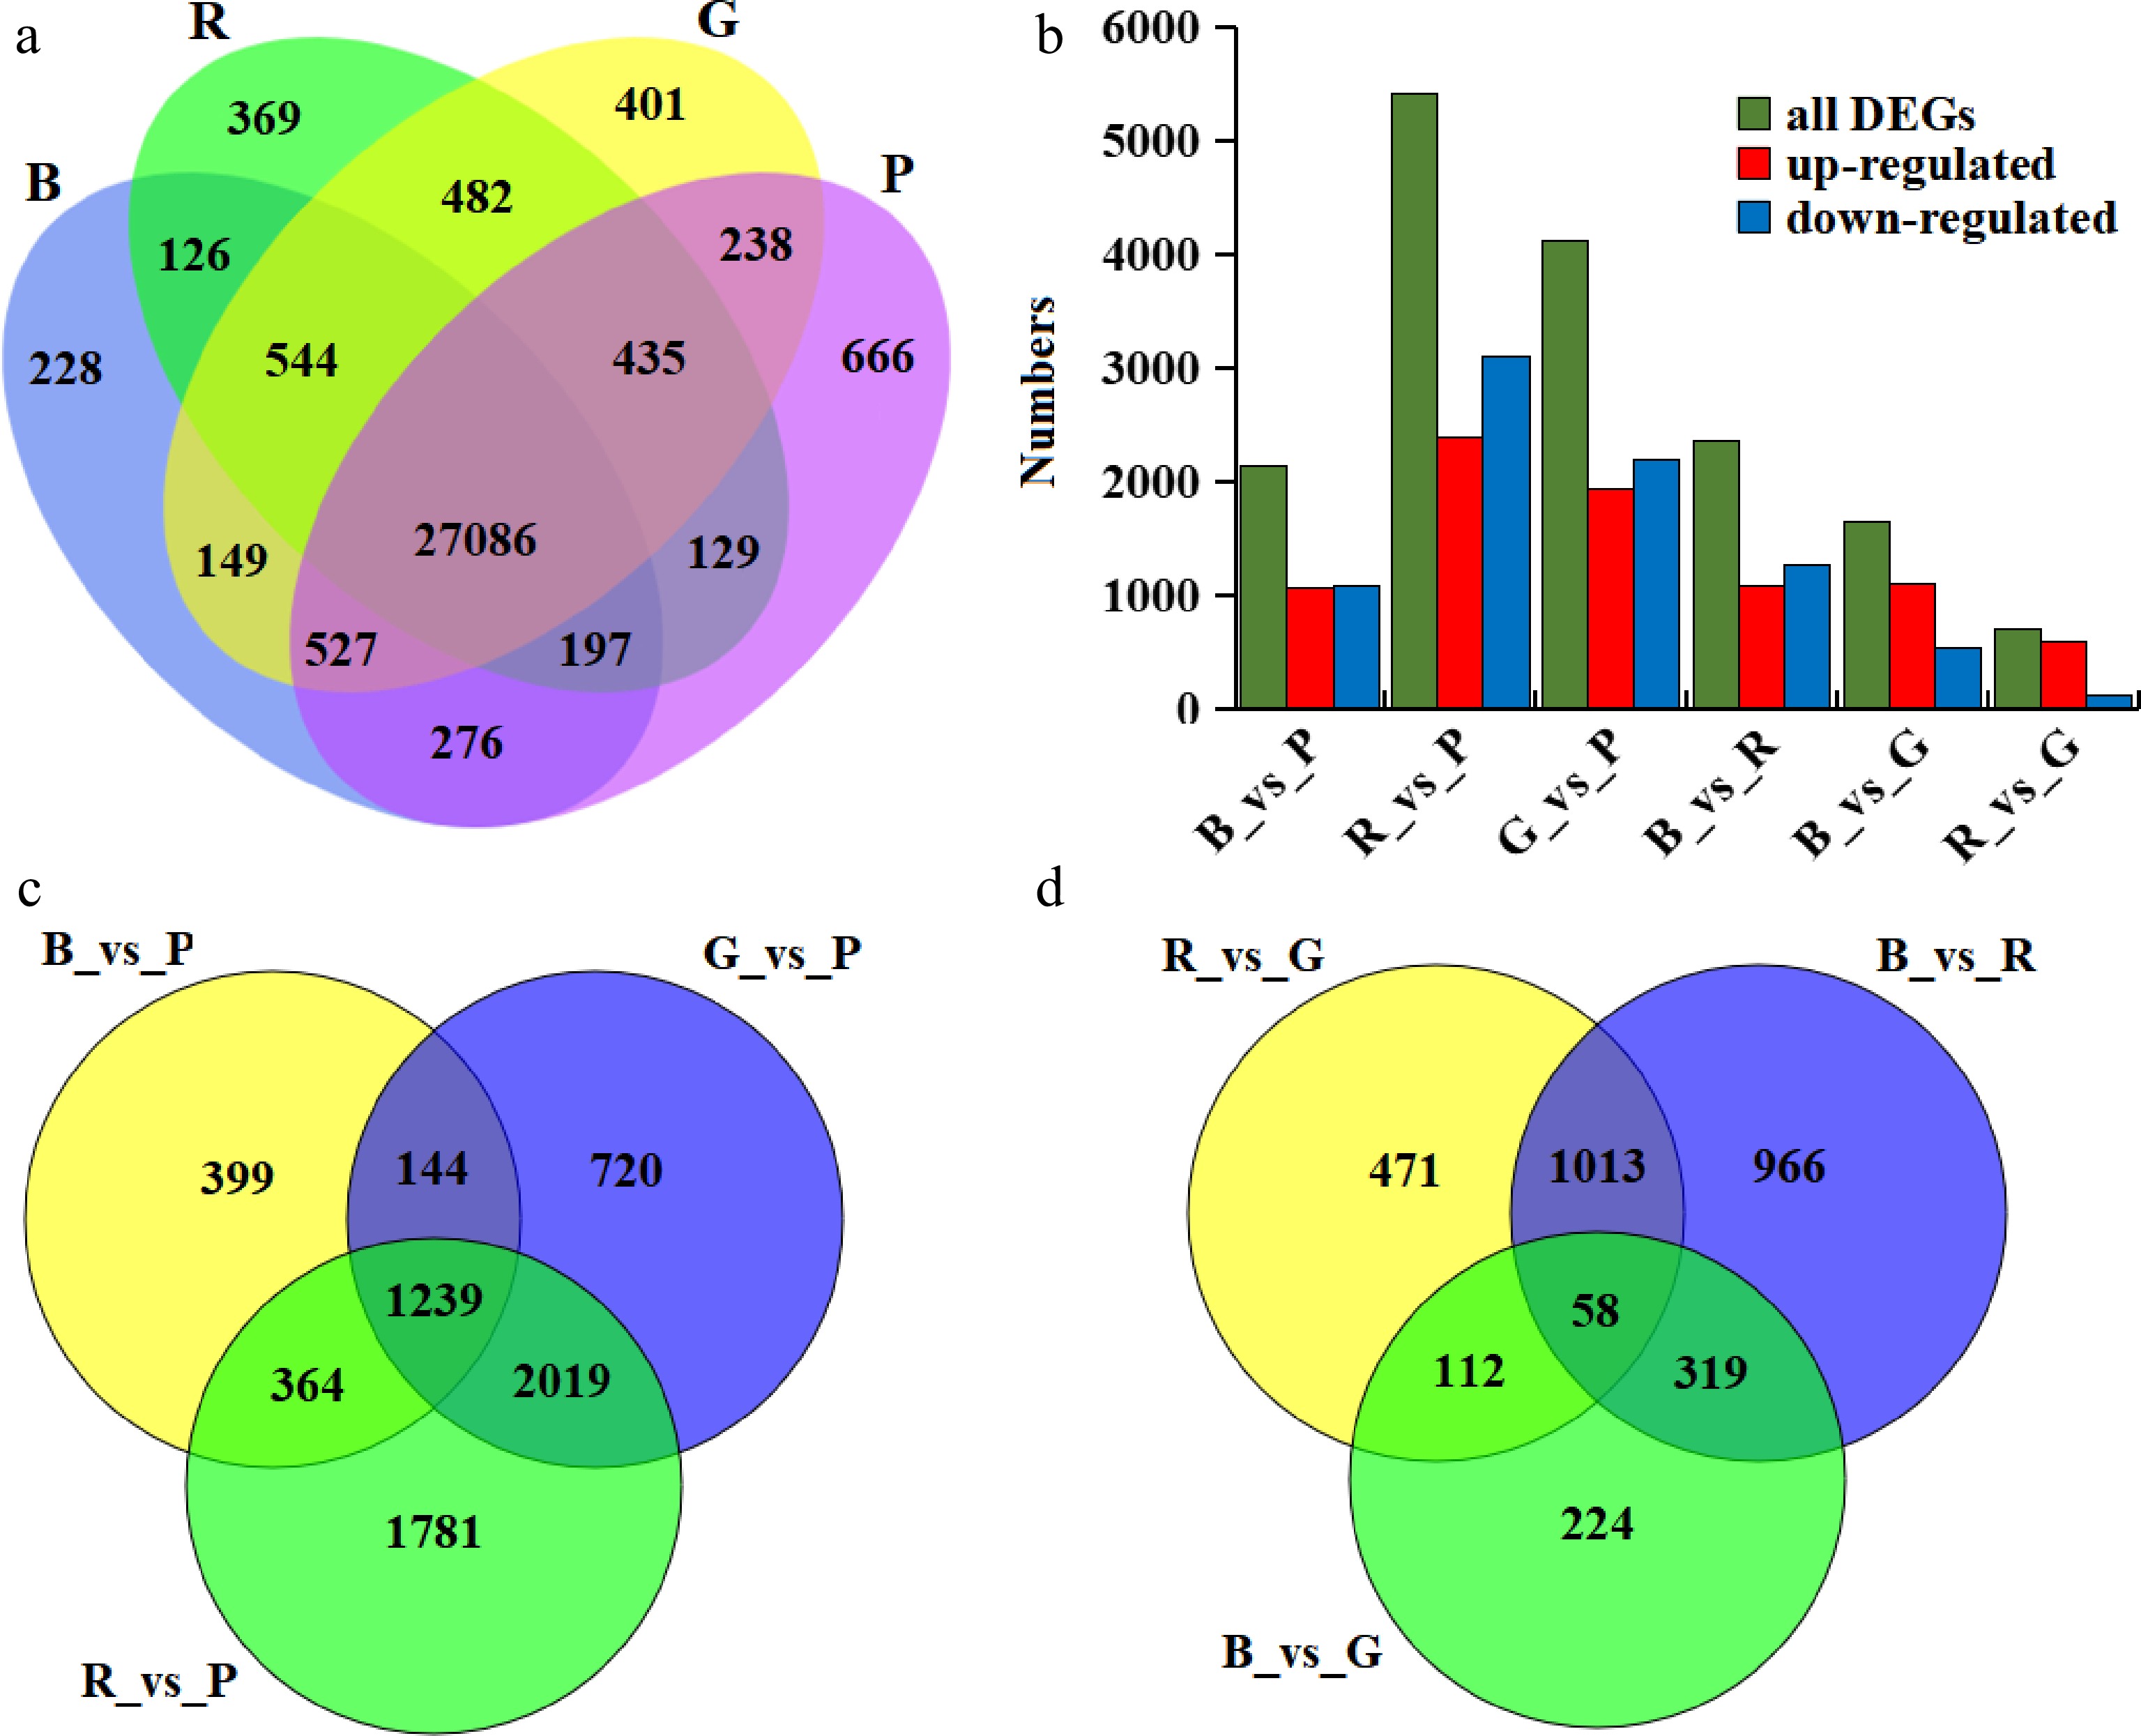
Figure 2.
Statistical analysis of the genes identified by transcriptome analysis. (a) Quantified genes under different light qualities; (b) Differentially expressed genes under different light qualities; (c) Venn diagram of differentially expressed genes between purple light compared to red, blue, and green light; (d) Venn diagram of differential genes between red, blue, and green light.
-
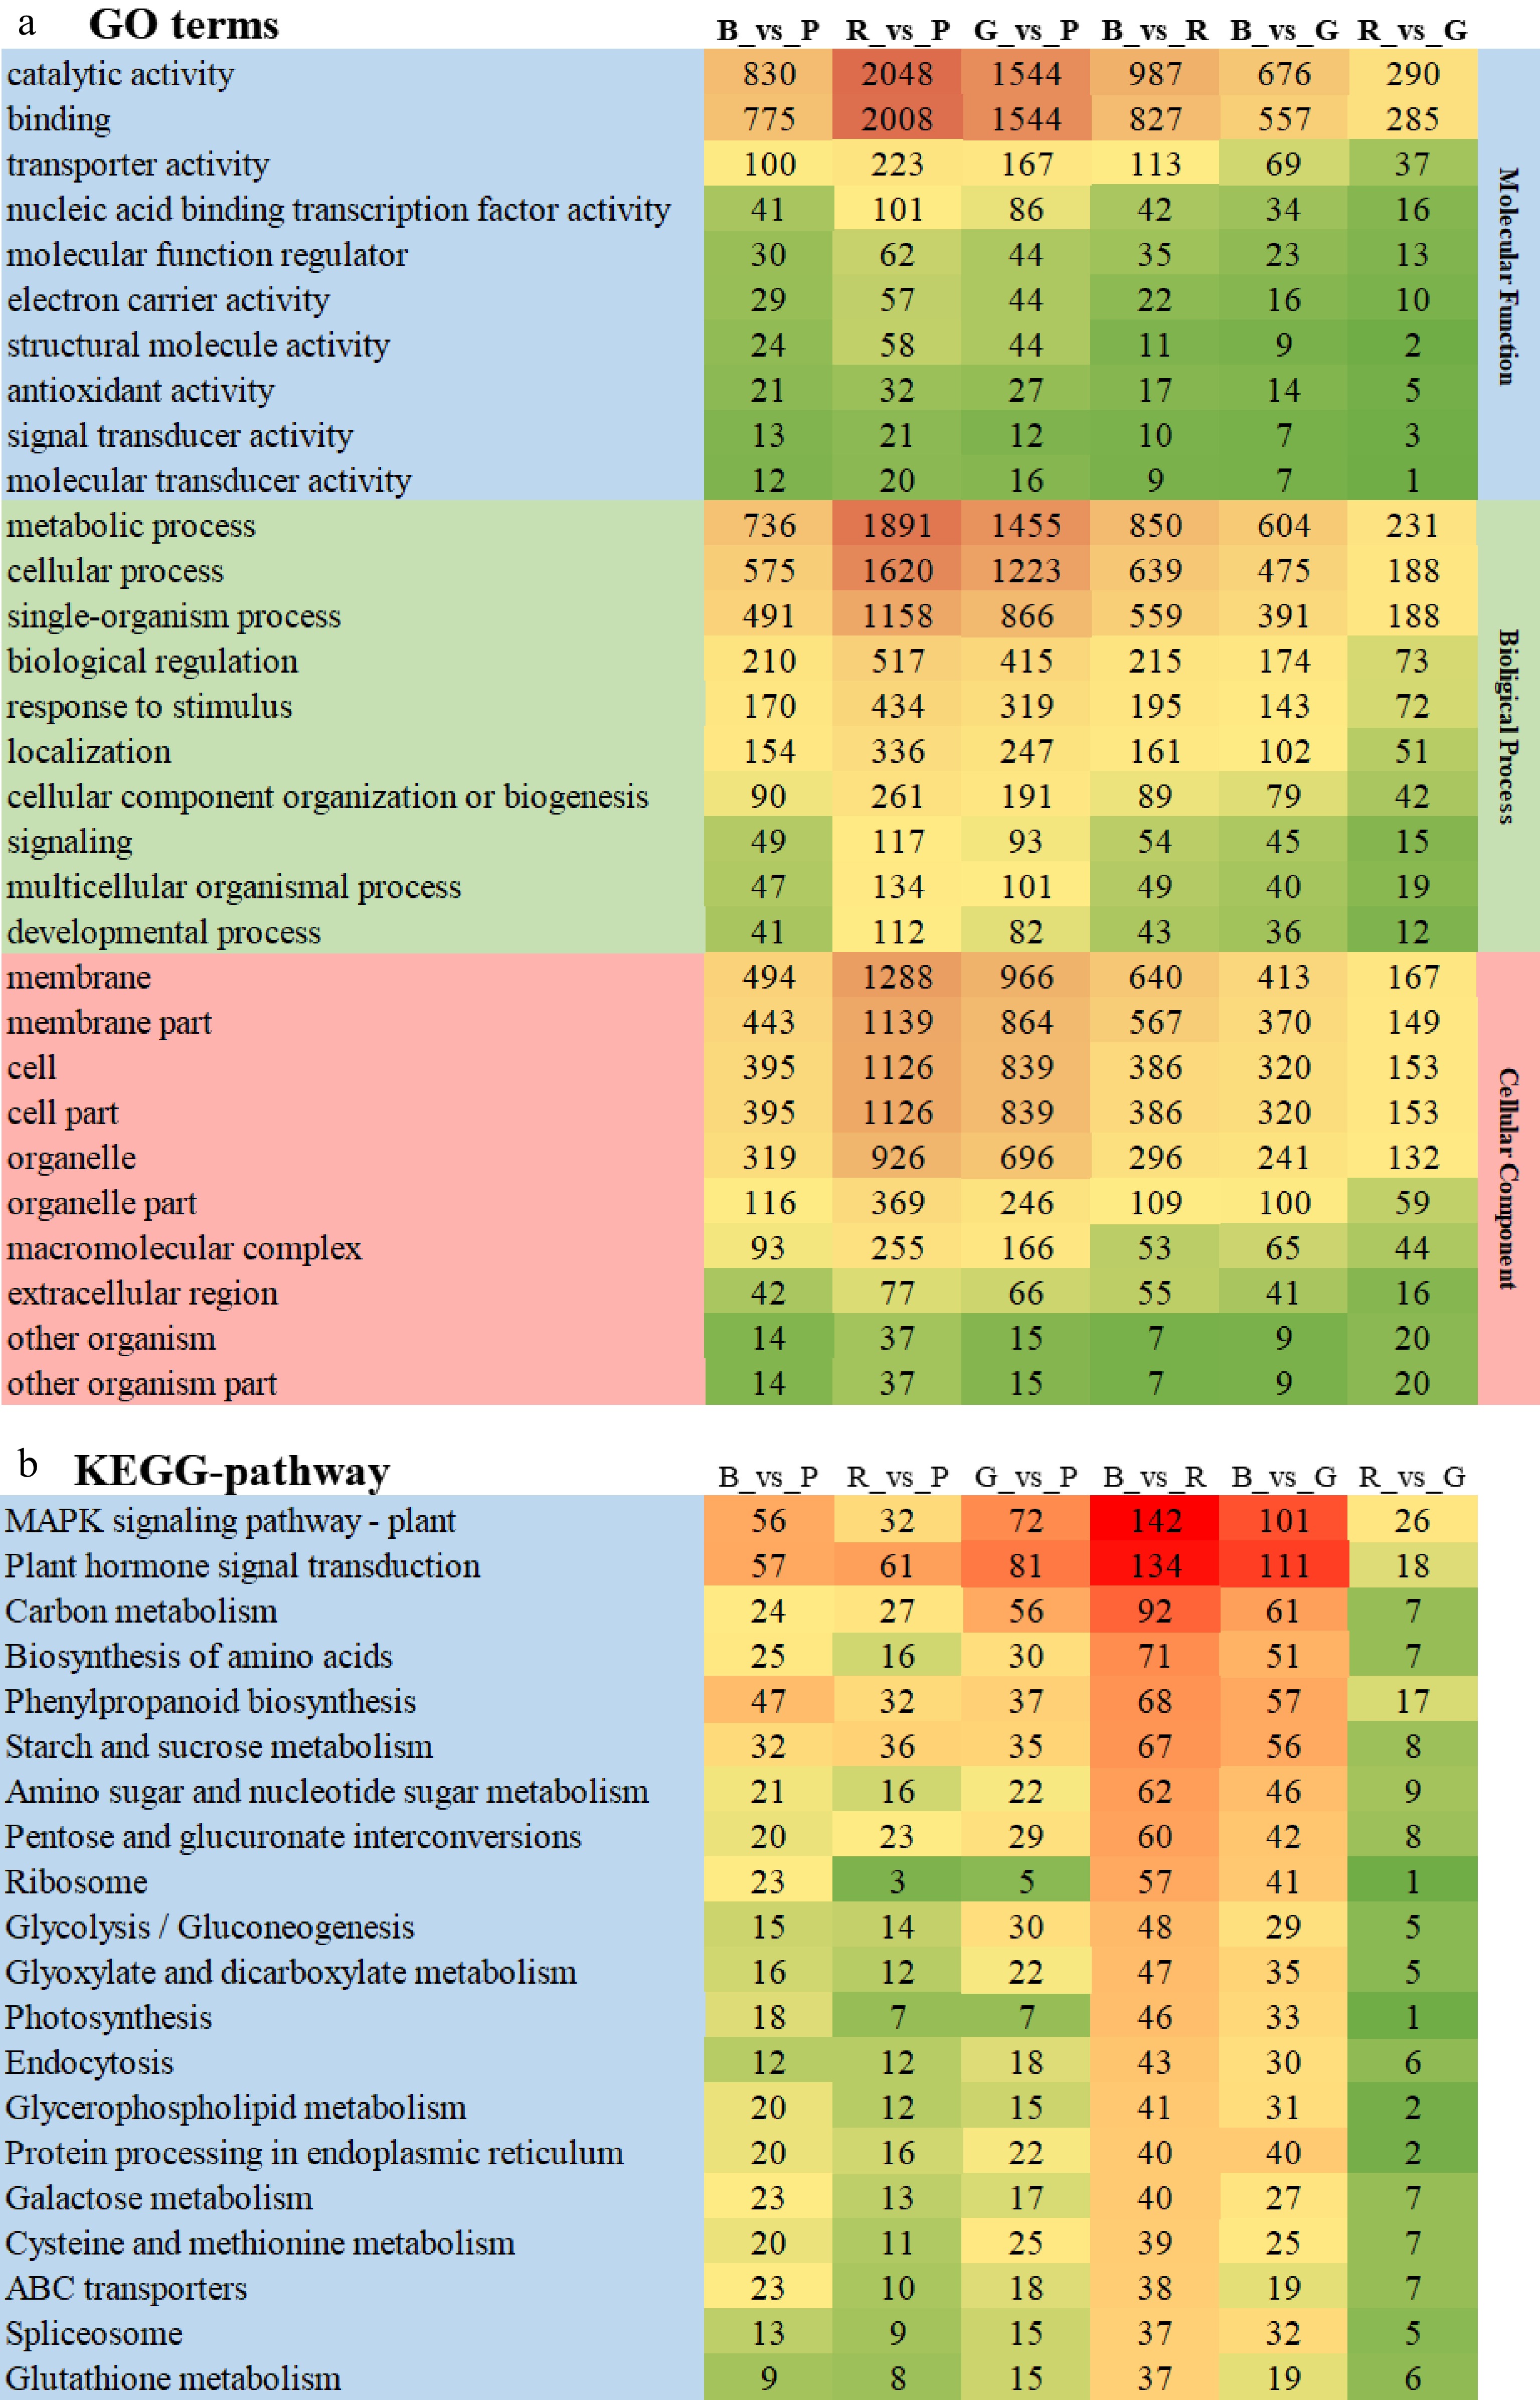
Figure 3.
Functional enrichment analysis of DEGs. (a) GO enrichment analysis; (b) KEGG enrichment analysis.
-
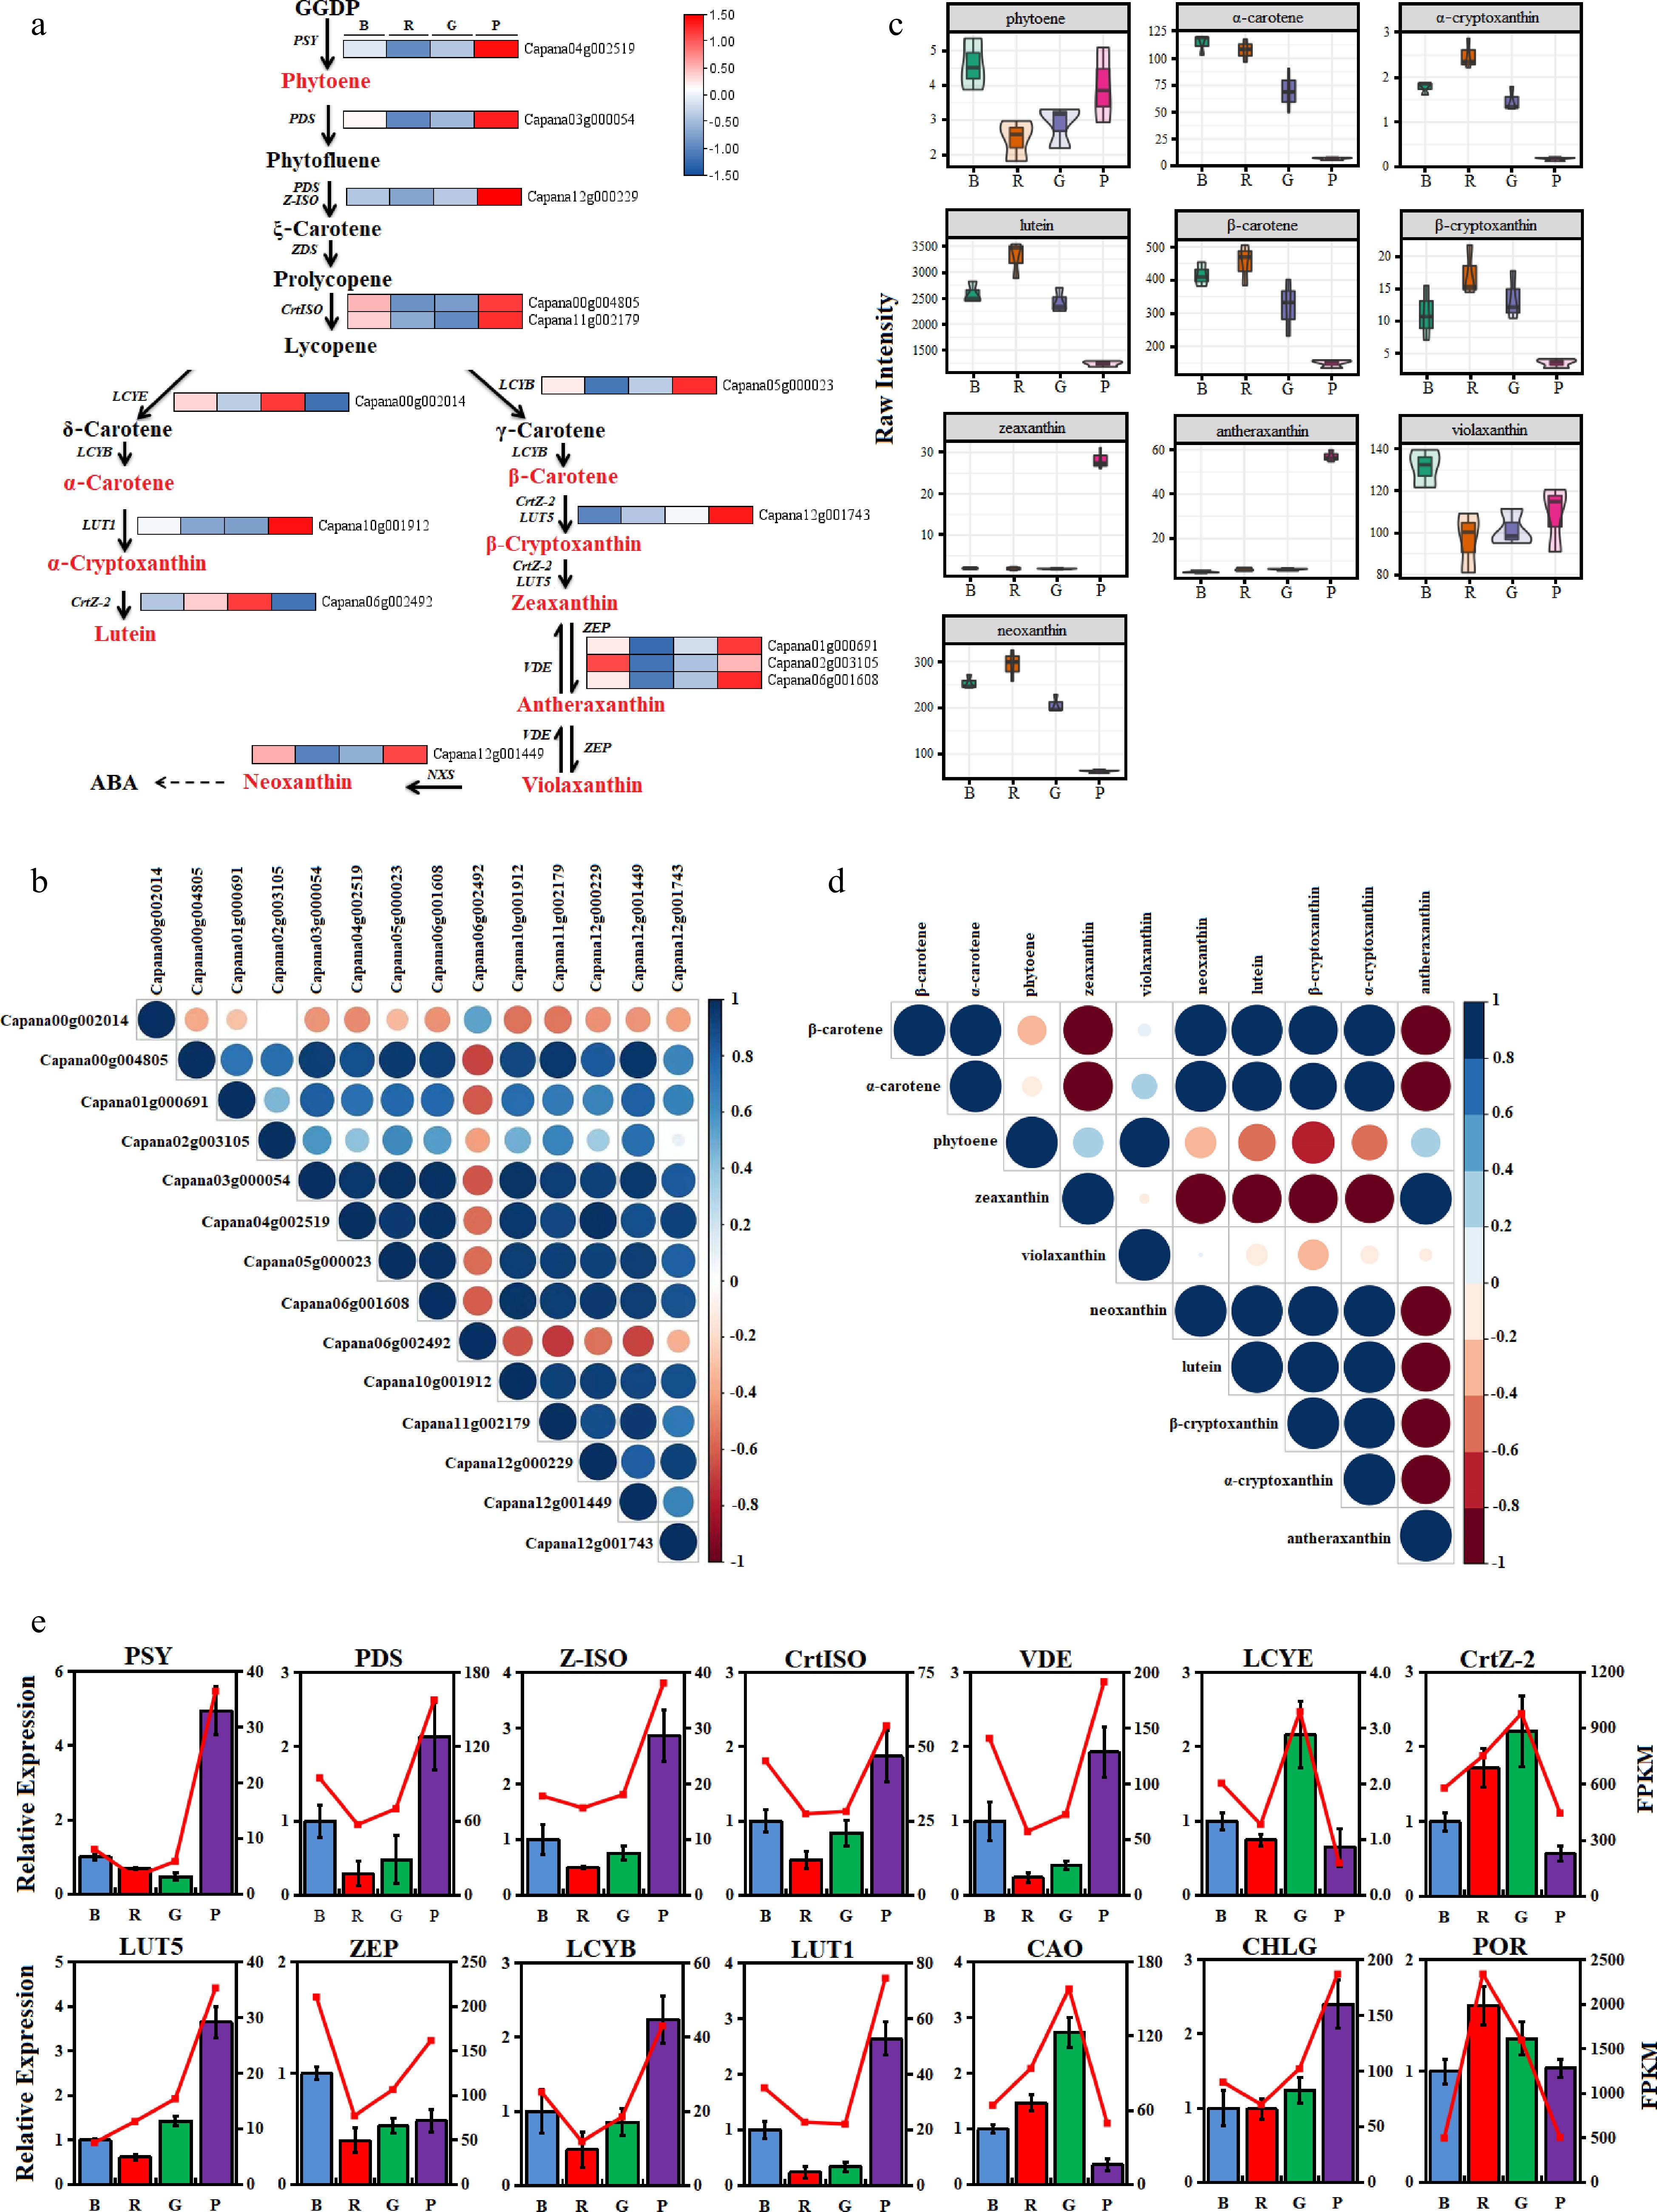
Figure 4.
Expression of carotenoid pathway genes and metabolites. (a) Analysis of gene expression; (b) Gene correlation analysis; (c) Analysis of metabolites synthesis; (d) Metabolite correlation analysis; (e) Quantitative verification of carotenoid pathway genes and chlorophyll metabolism related genes.
-
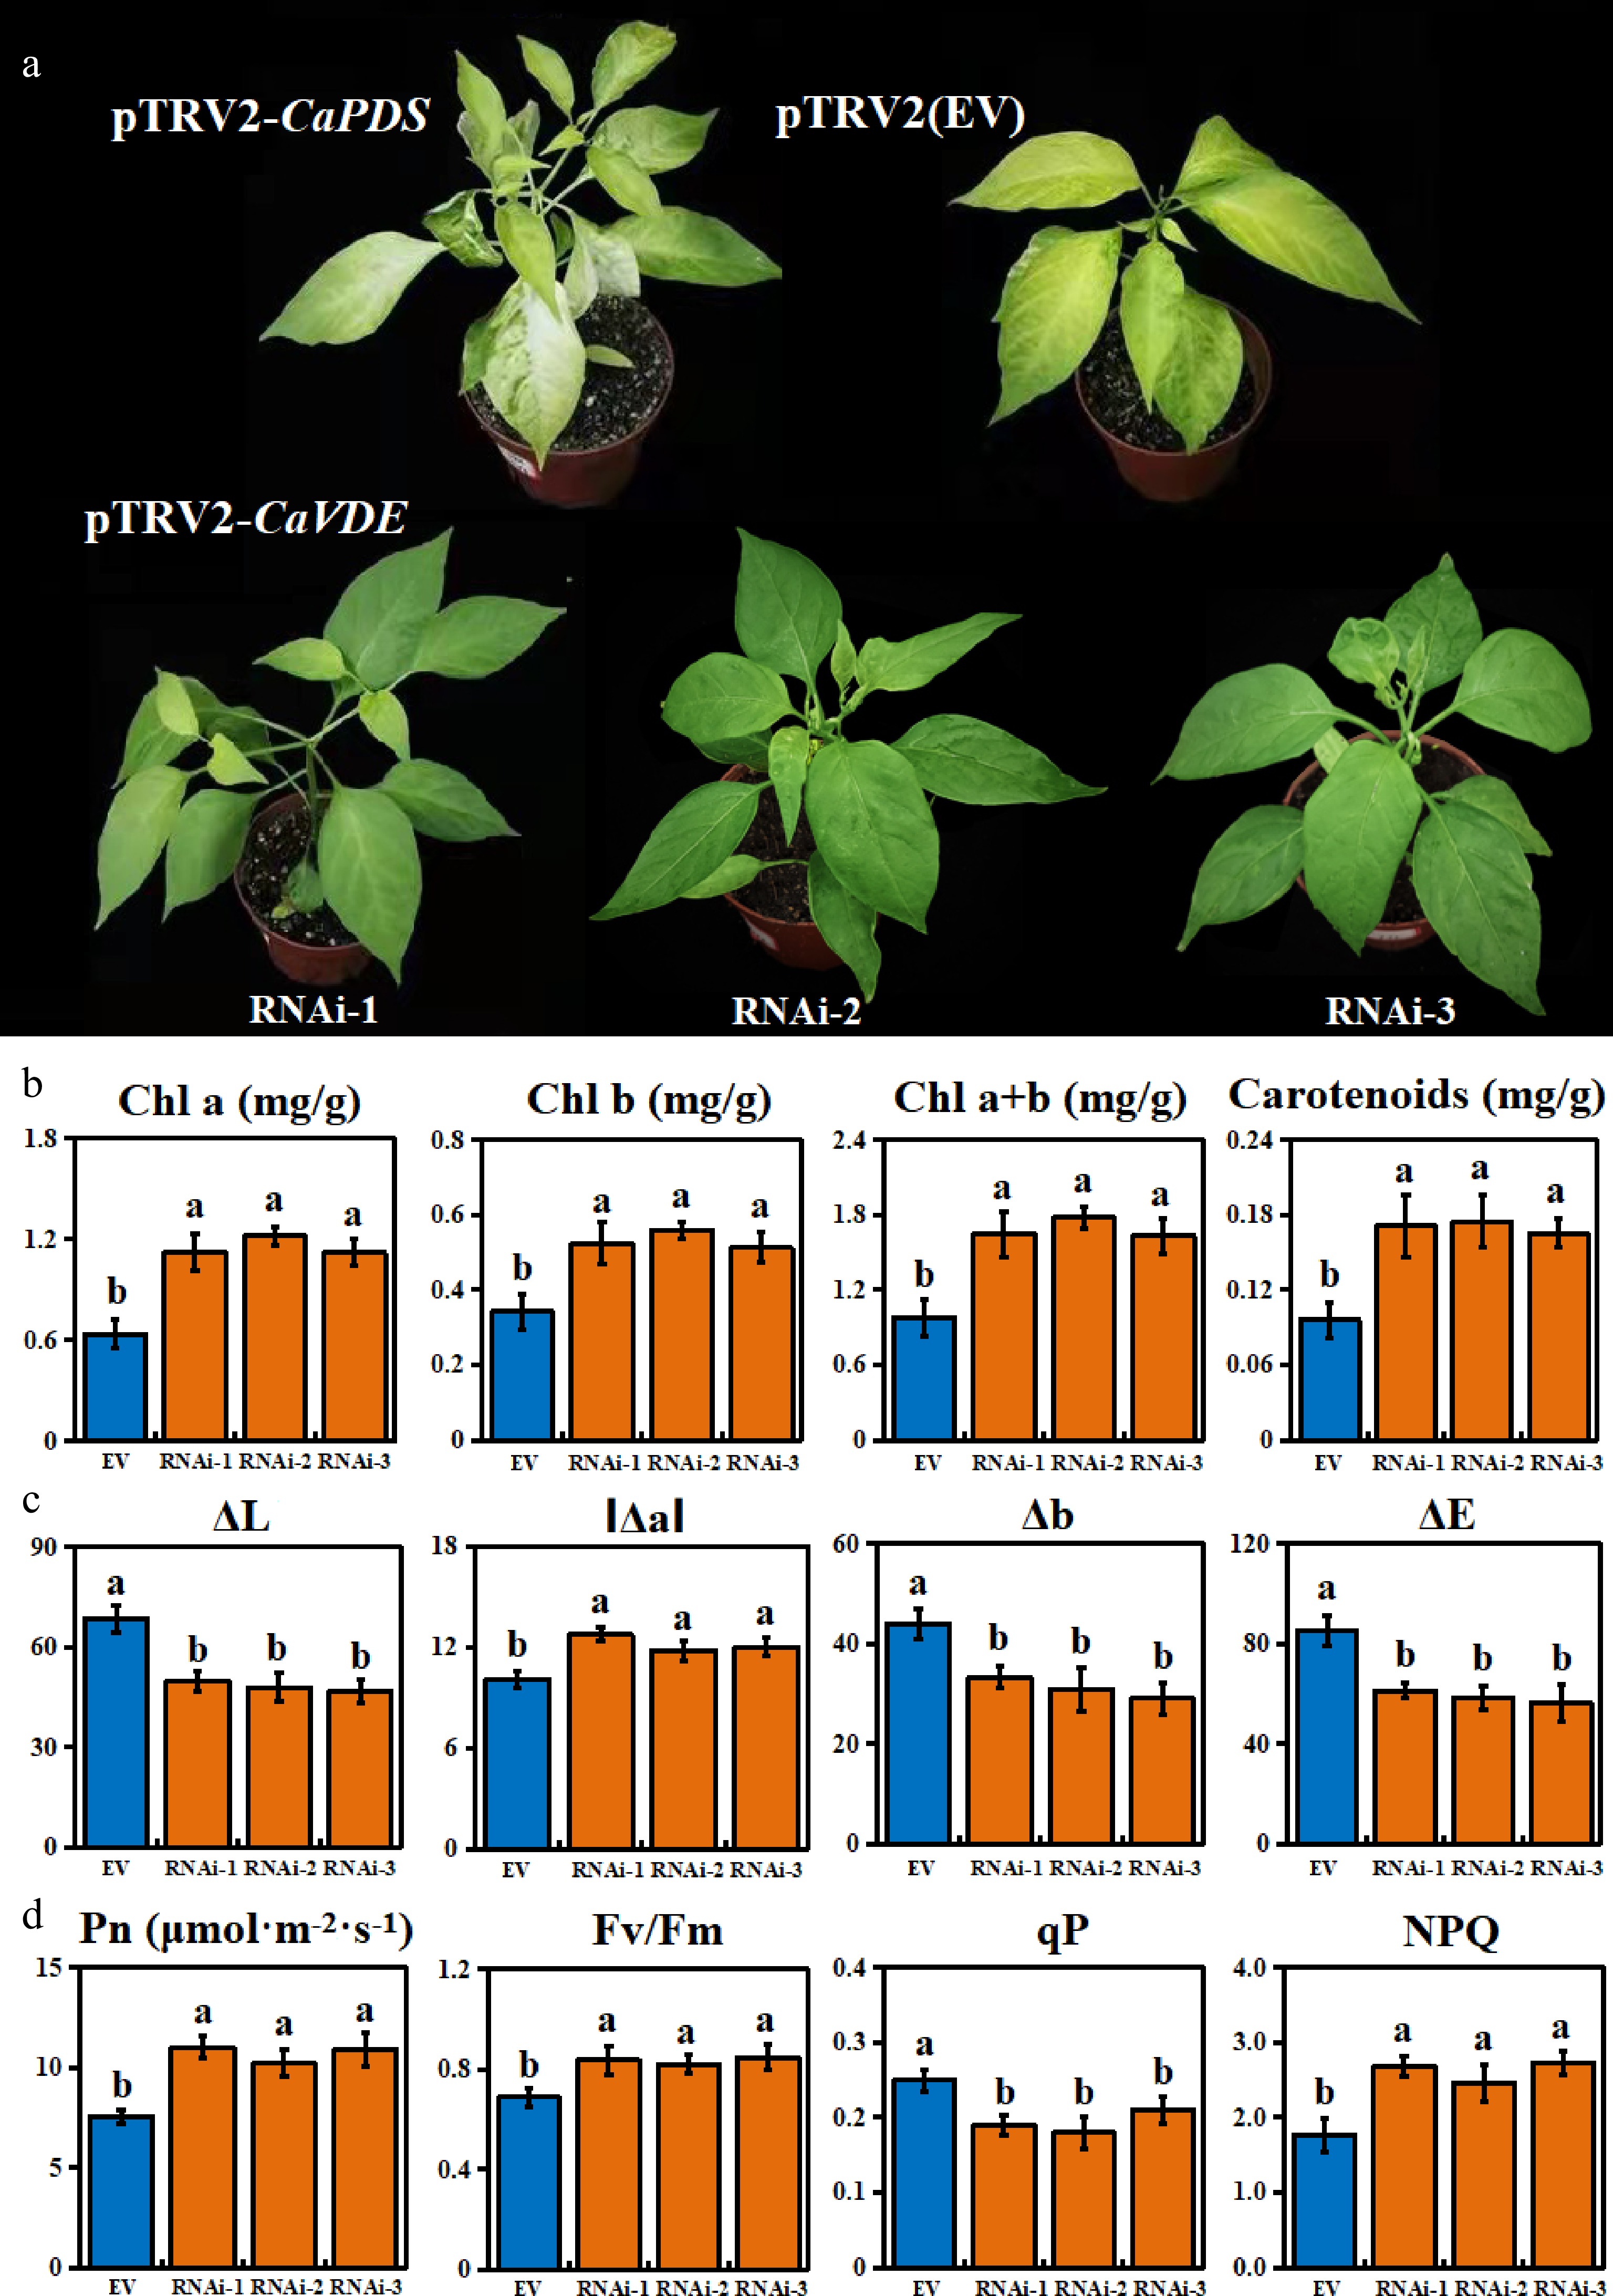
Figure 5.
Phenotype and physiological characteristics of CaVDE silenced lines. (a) Phenotypic identification of CaVDE silenced and EV line; (b) Photosynthetic pigment content of CaVDE silenced and EV line; (c) Color chromaticity value of CaVDE silenced and EV line; (d) Characteristics of photosynthesis and chlorophyll fluorescence of CaVDE silenced and EV line.
-
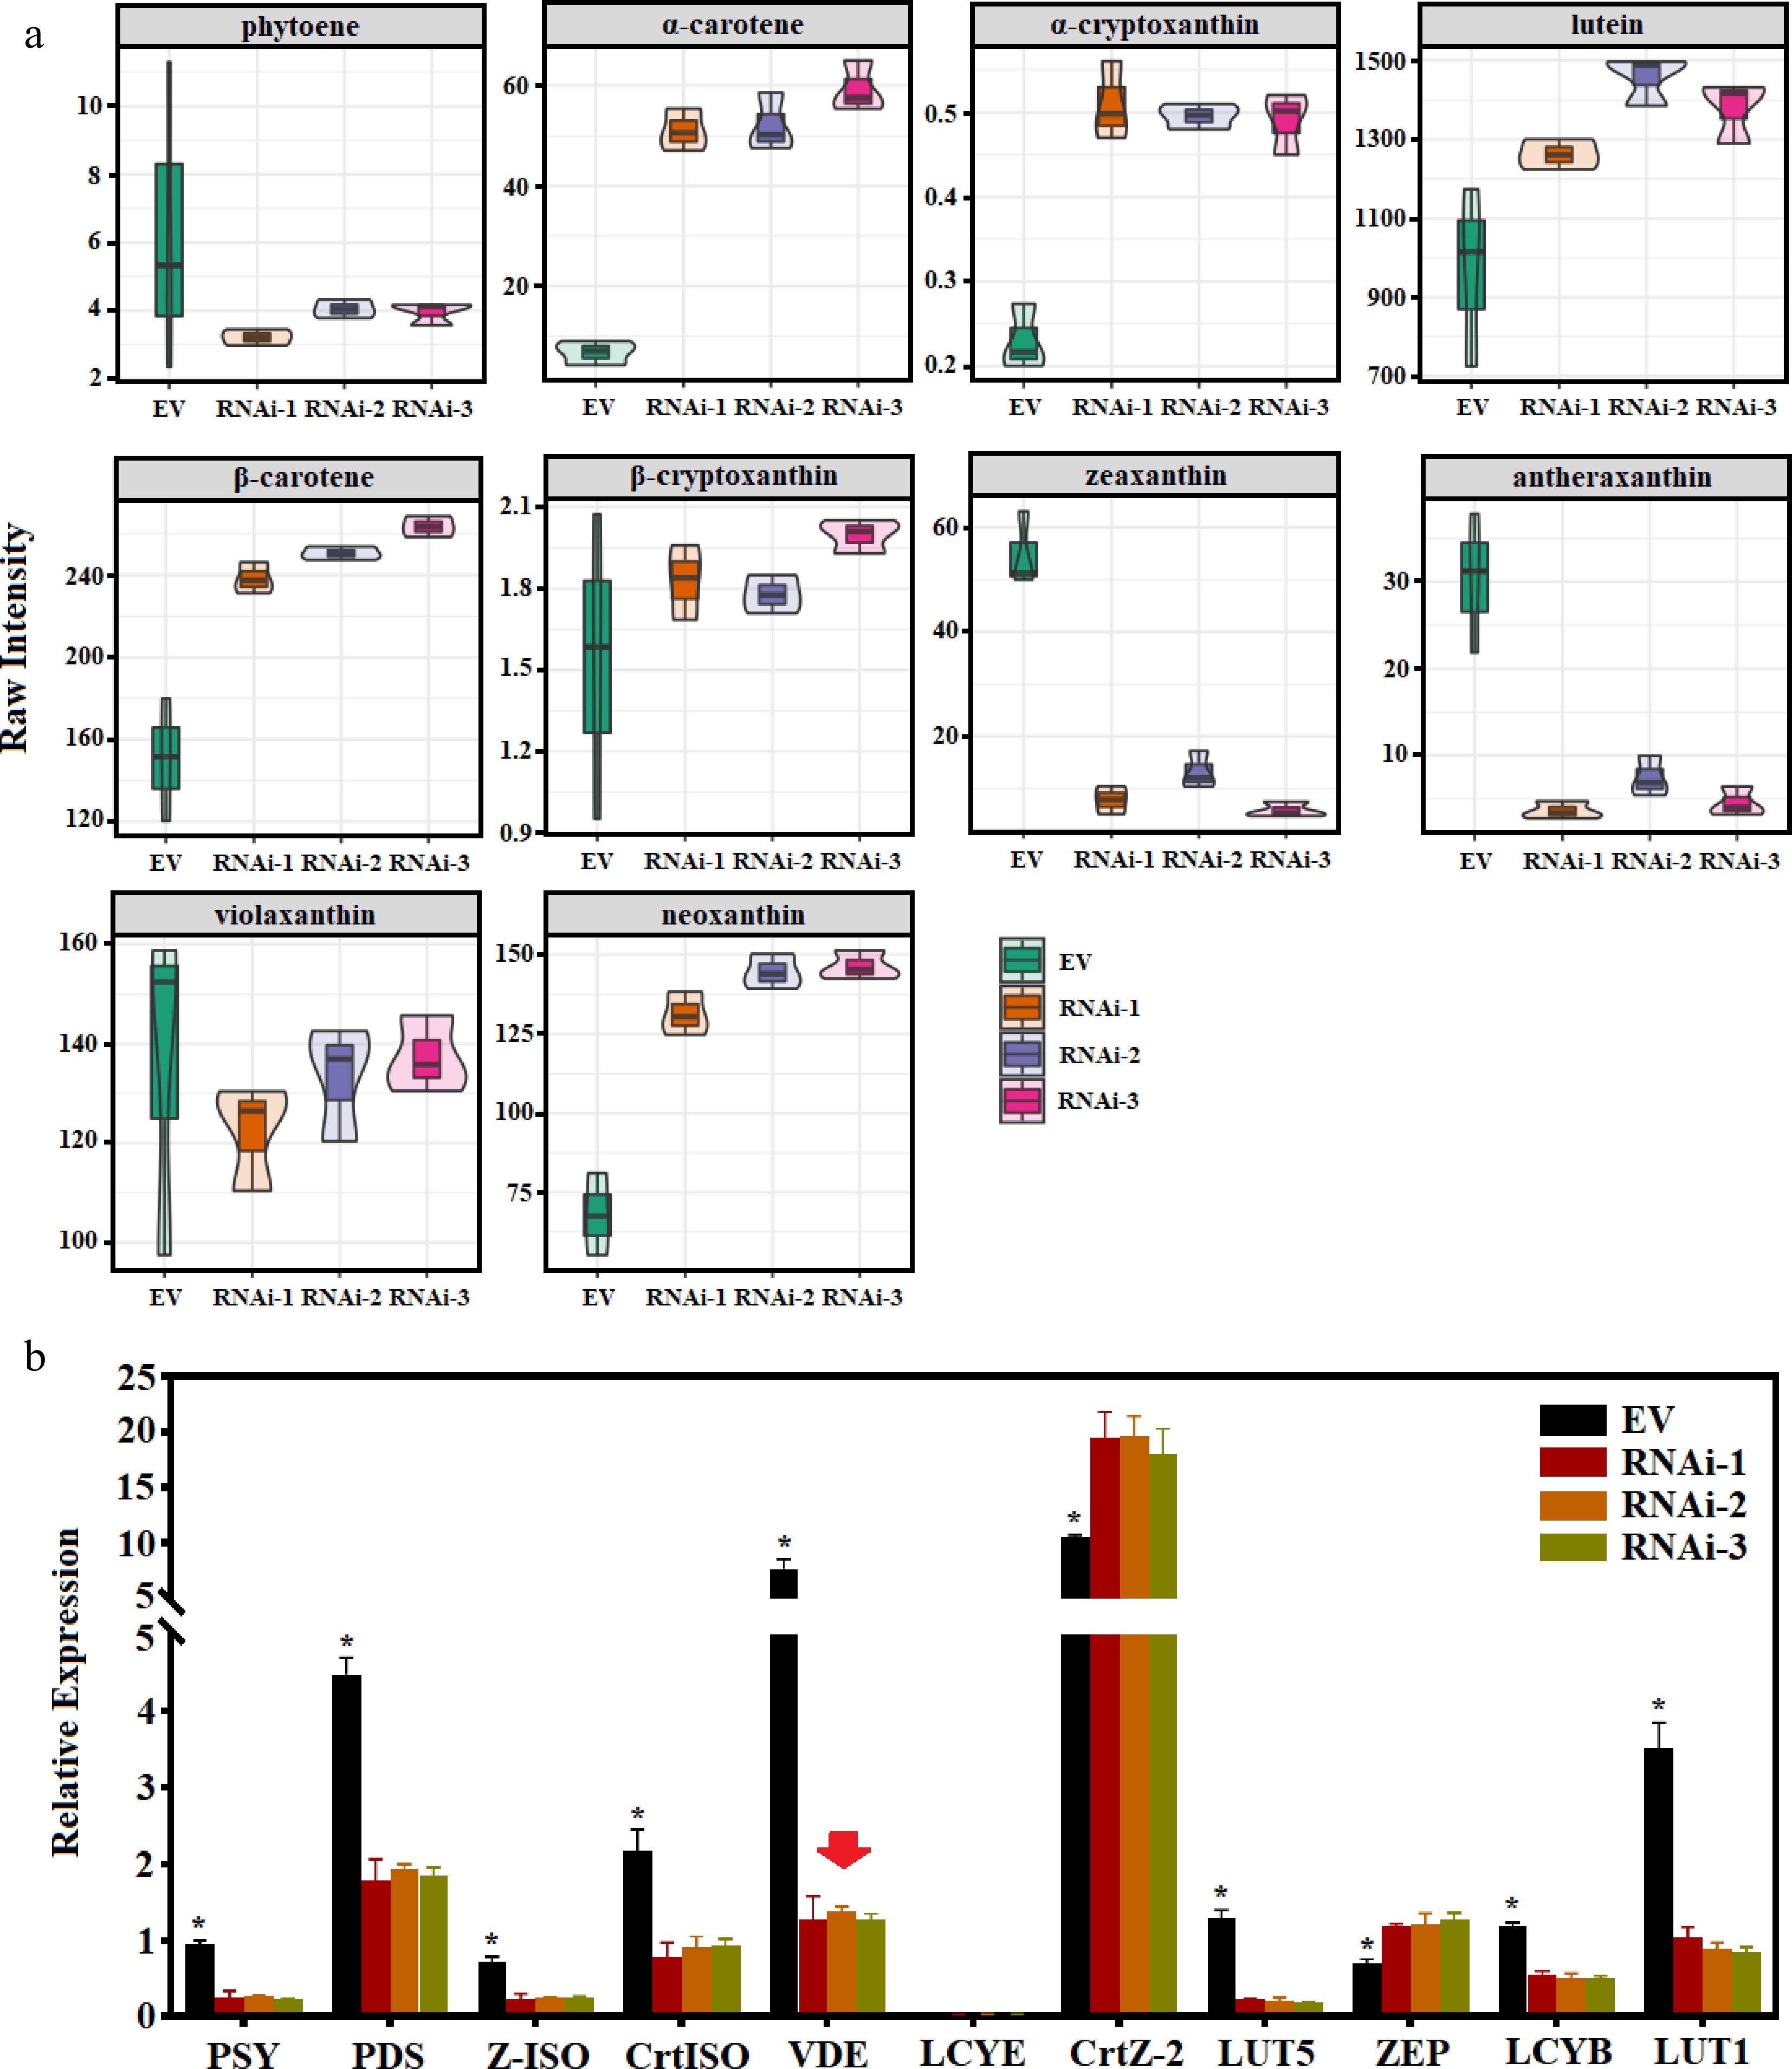
Figure 6.
Carotenoid content and gene expression of CaVDE silenced lines. (a) Volin plot of raw values of CaVDE silenced and EV line; (b) Quantitative verification of carotenoid pathway genes of CaVDE silenced and EV line.
Figures
(6)
Tables
(0)