-
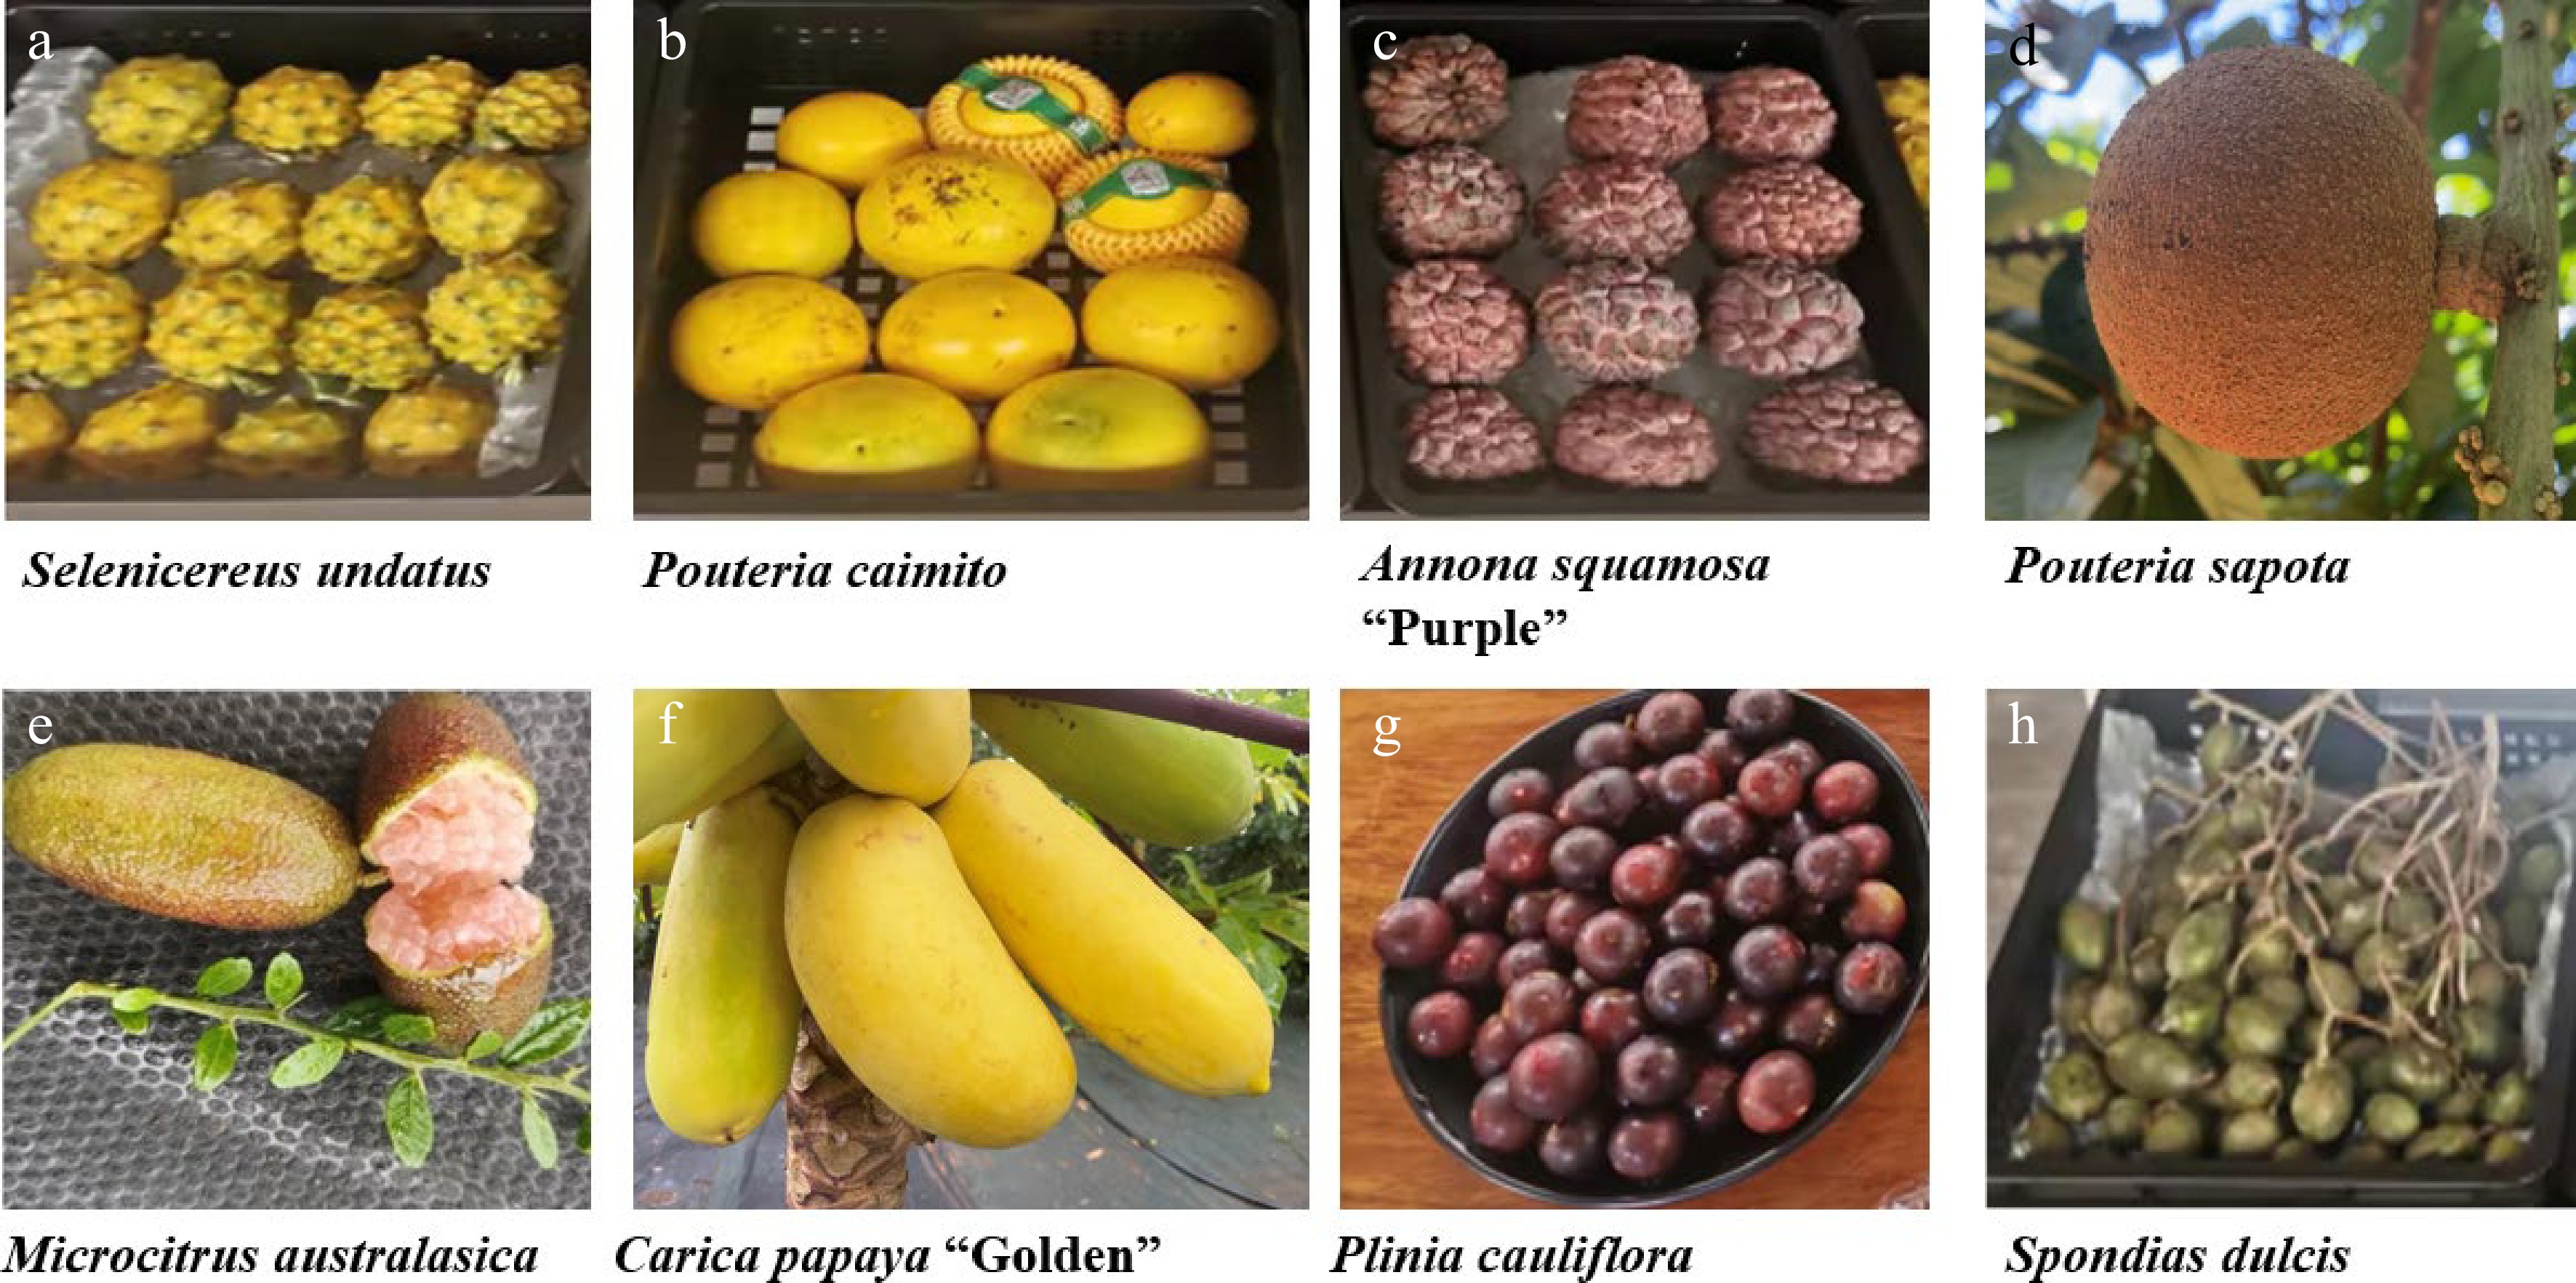
Figure 1.
Tropical fruits cultivated by Qionghai Shengda Modern Agricultural Development Co. Ltd., Qionghai city, Hainan province, China. Tropical fruits are currently grown in the region and contributing to socio-economic development including the following: (a) Selenicereus undatus, (b) Pouteria caimito, (c) Annona squamosa (Purple variety), (d) Pouteria sapota, (e) Citrus australasica, (f) Carica papaya (Golden variety), (g) Plinia cauliflora, (h) Spondias dulcis.
-
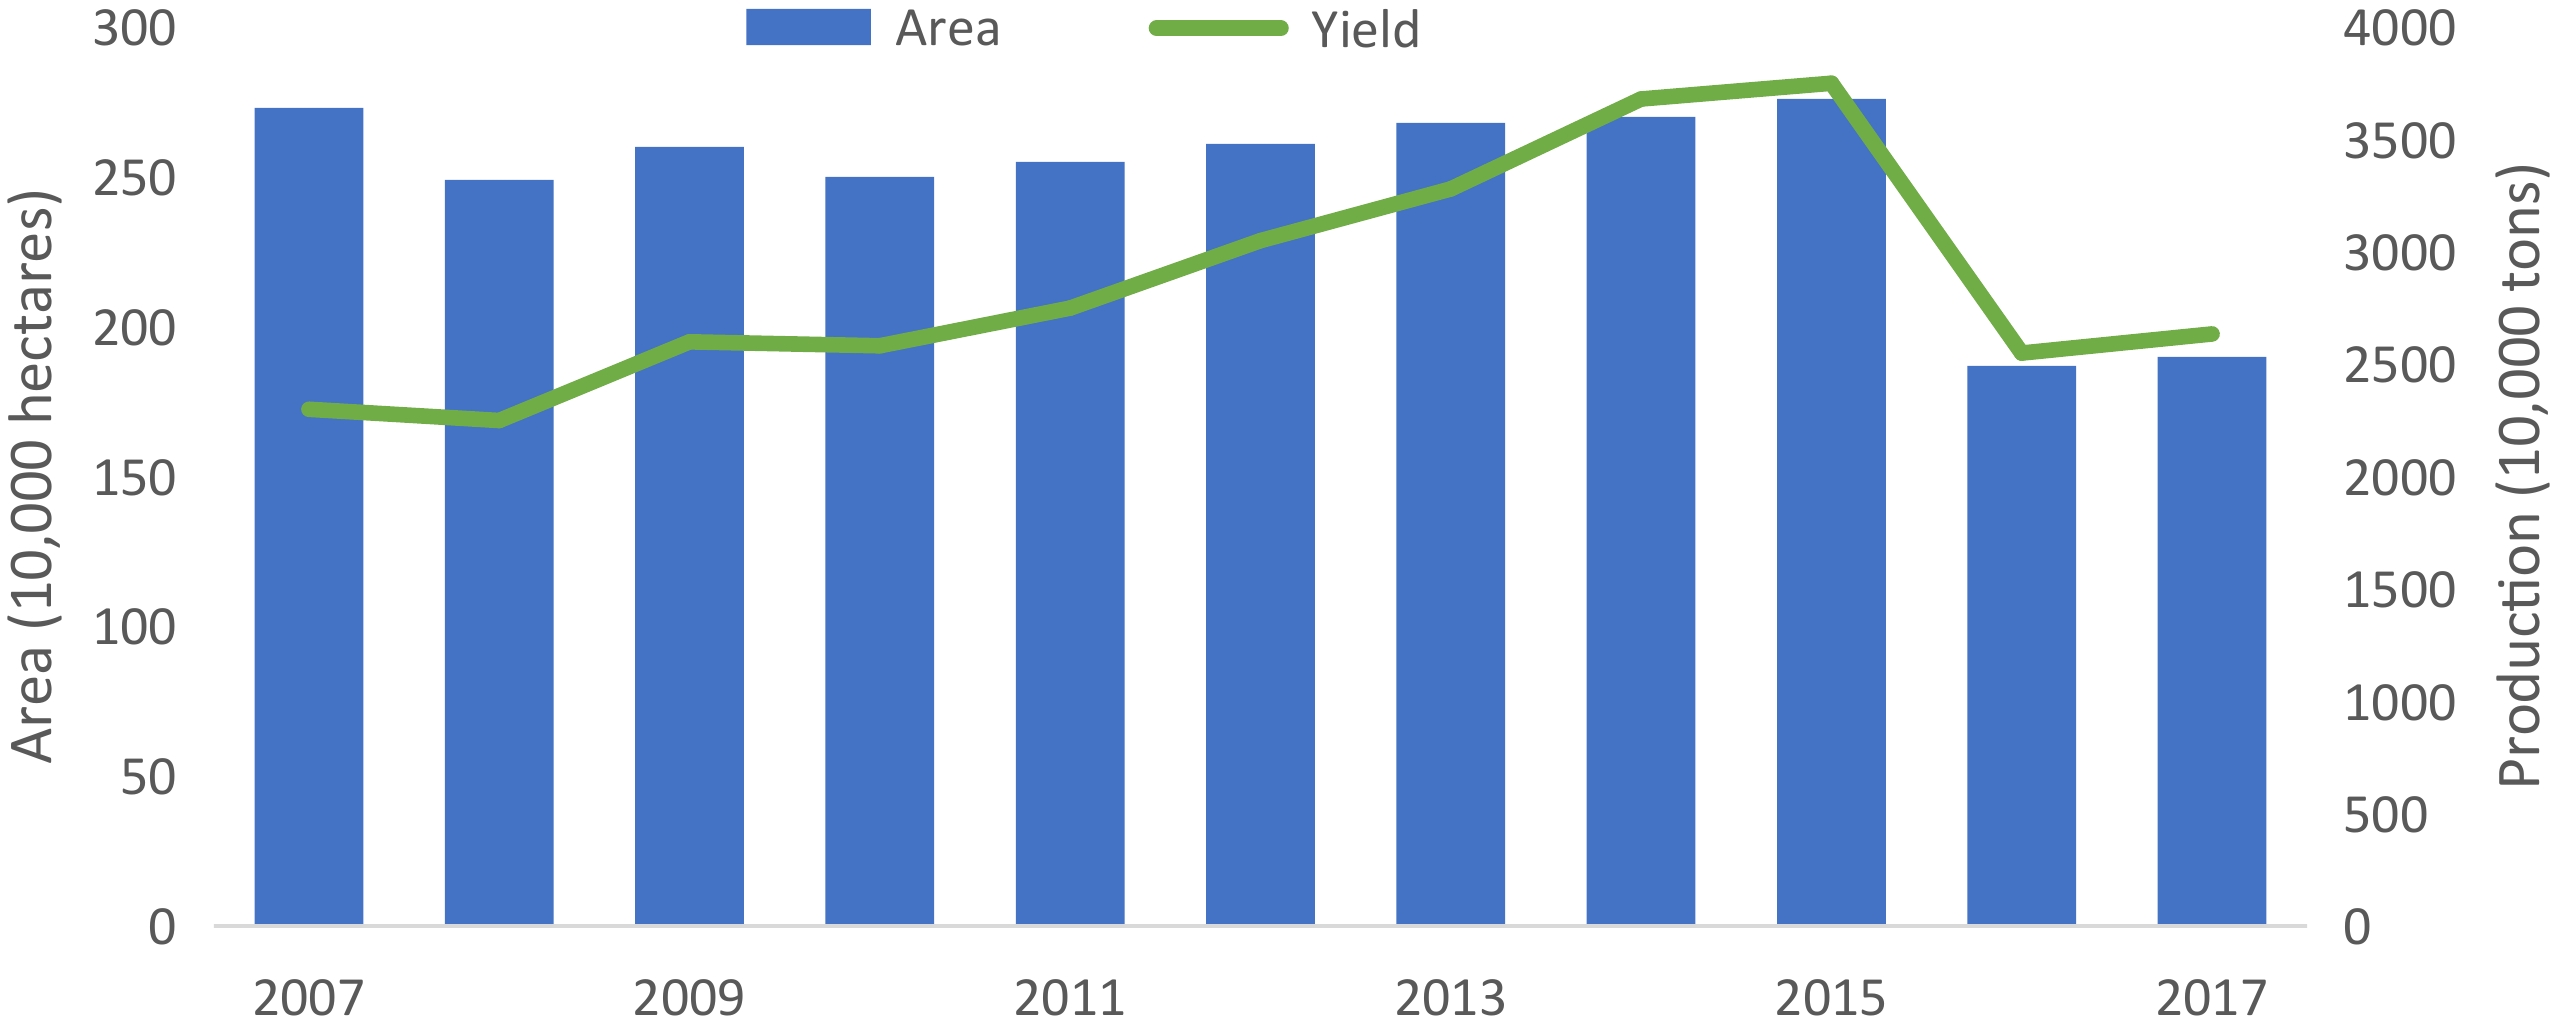
Figure 2.
Production area and quantity of tropical fruits in China between 2007−2017. From 2016, the statistics of tropical fruits in China excluded the data of citrus, lemon and other Rutaceae fruits; therefore, a downward trend was seen in 2016.
-
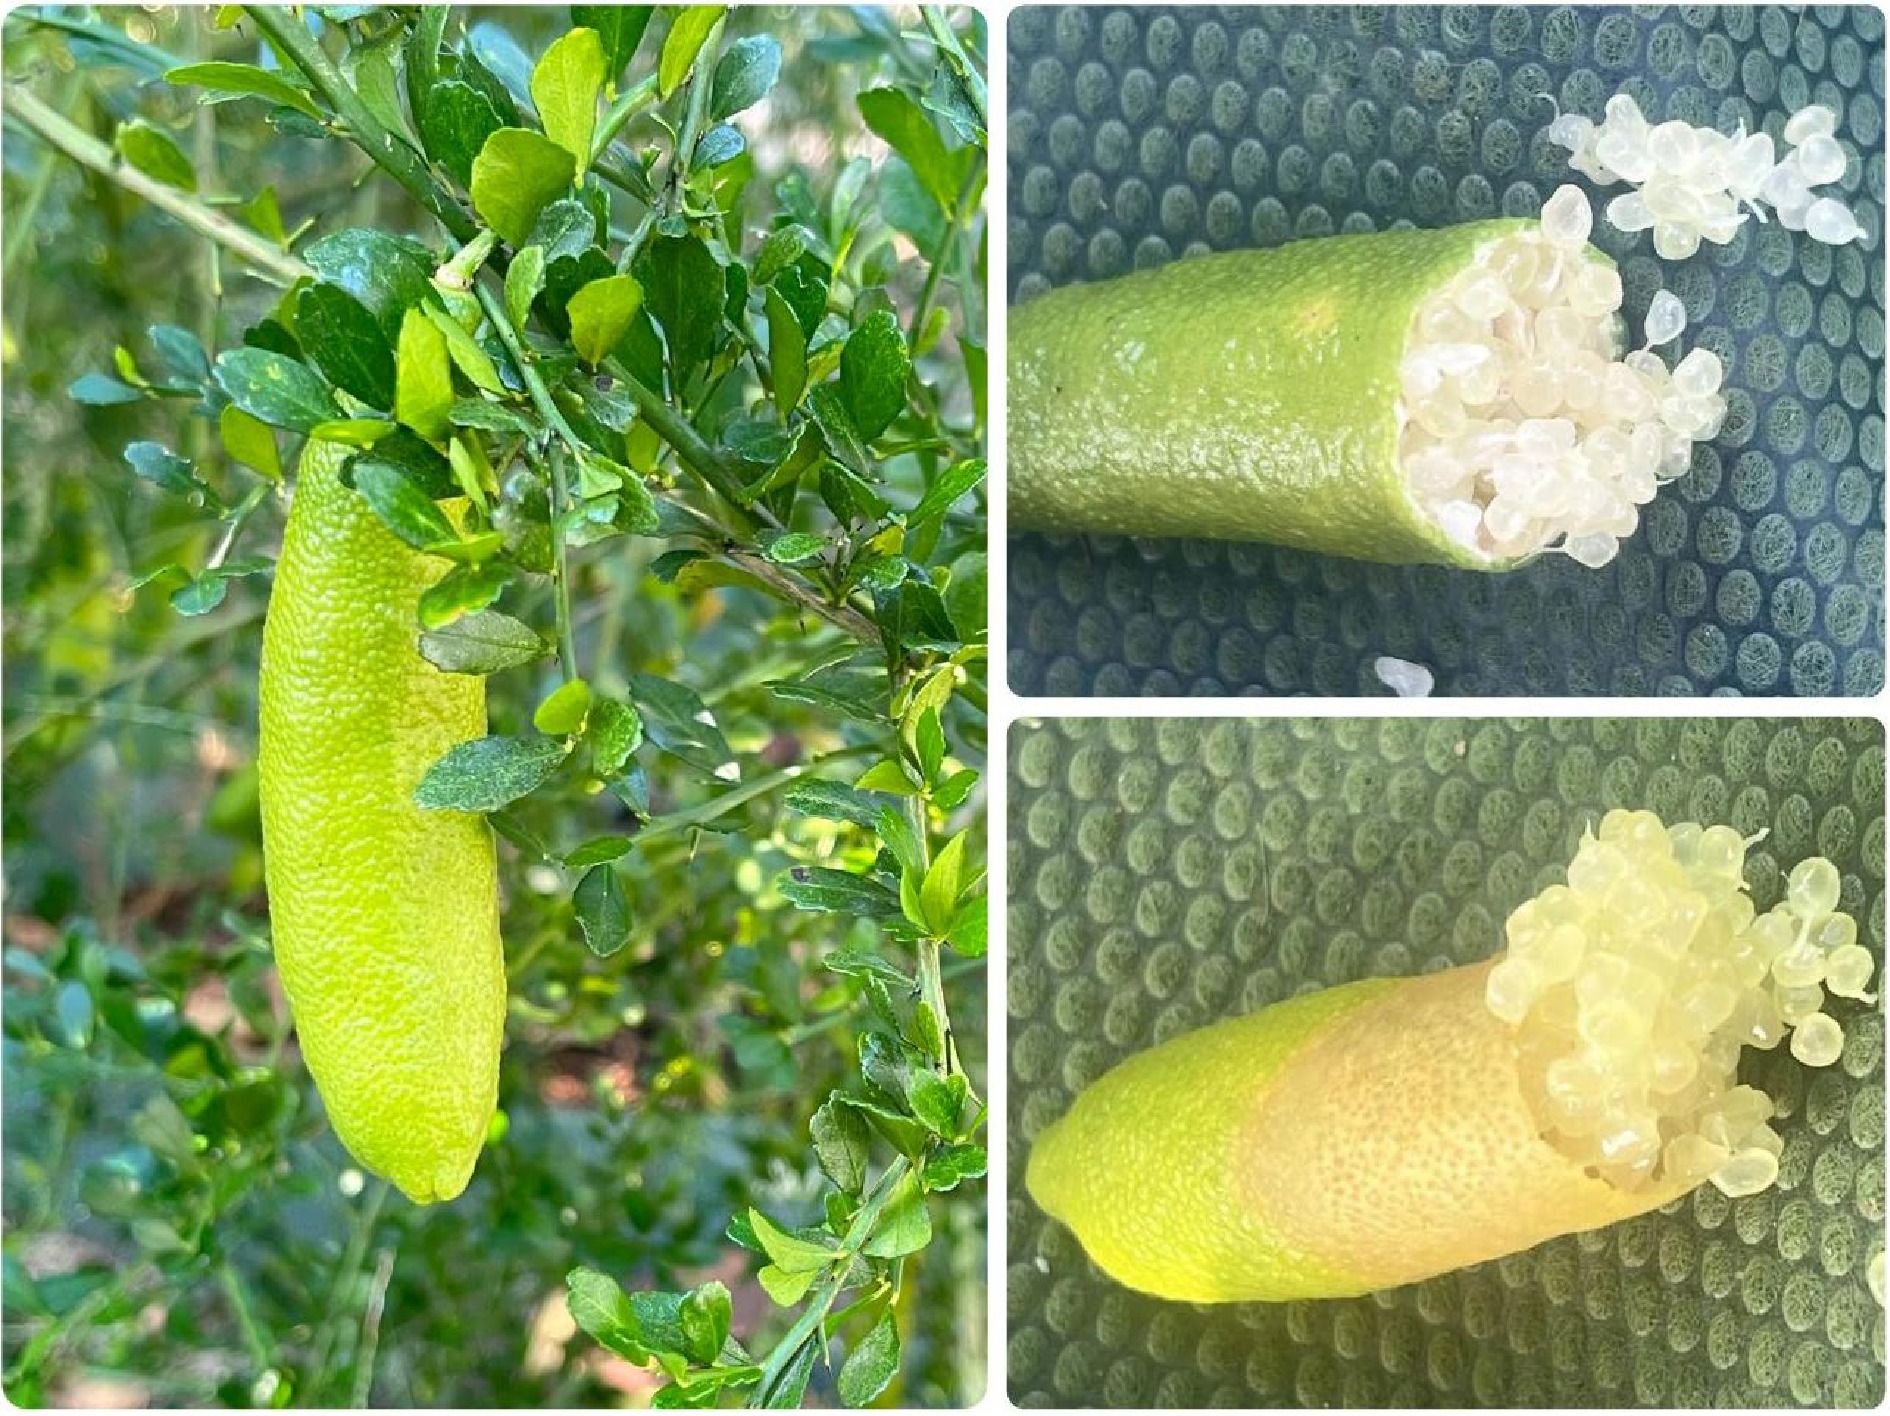
Figure 3.
Finger lime (Citrus australasica), also known as Australian finger lime or caviar lime, cultivated in Hainan.
-
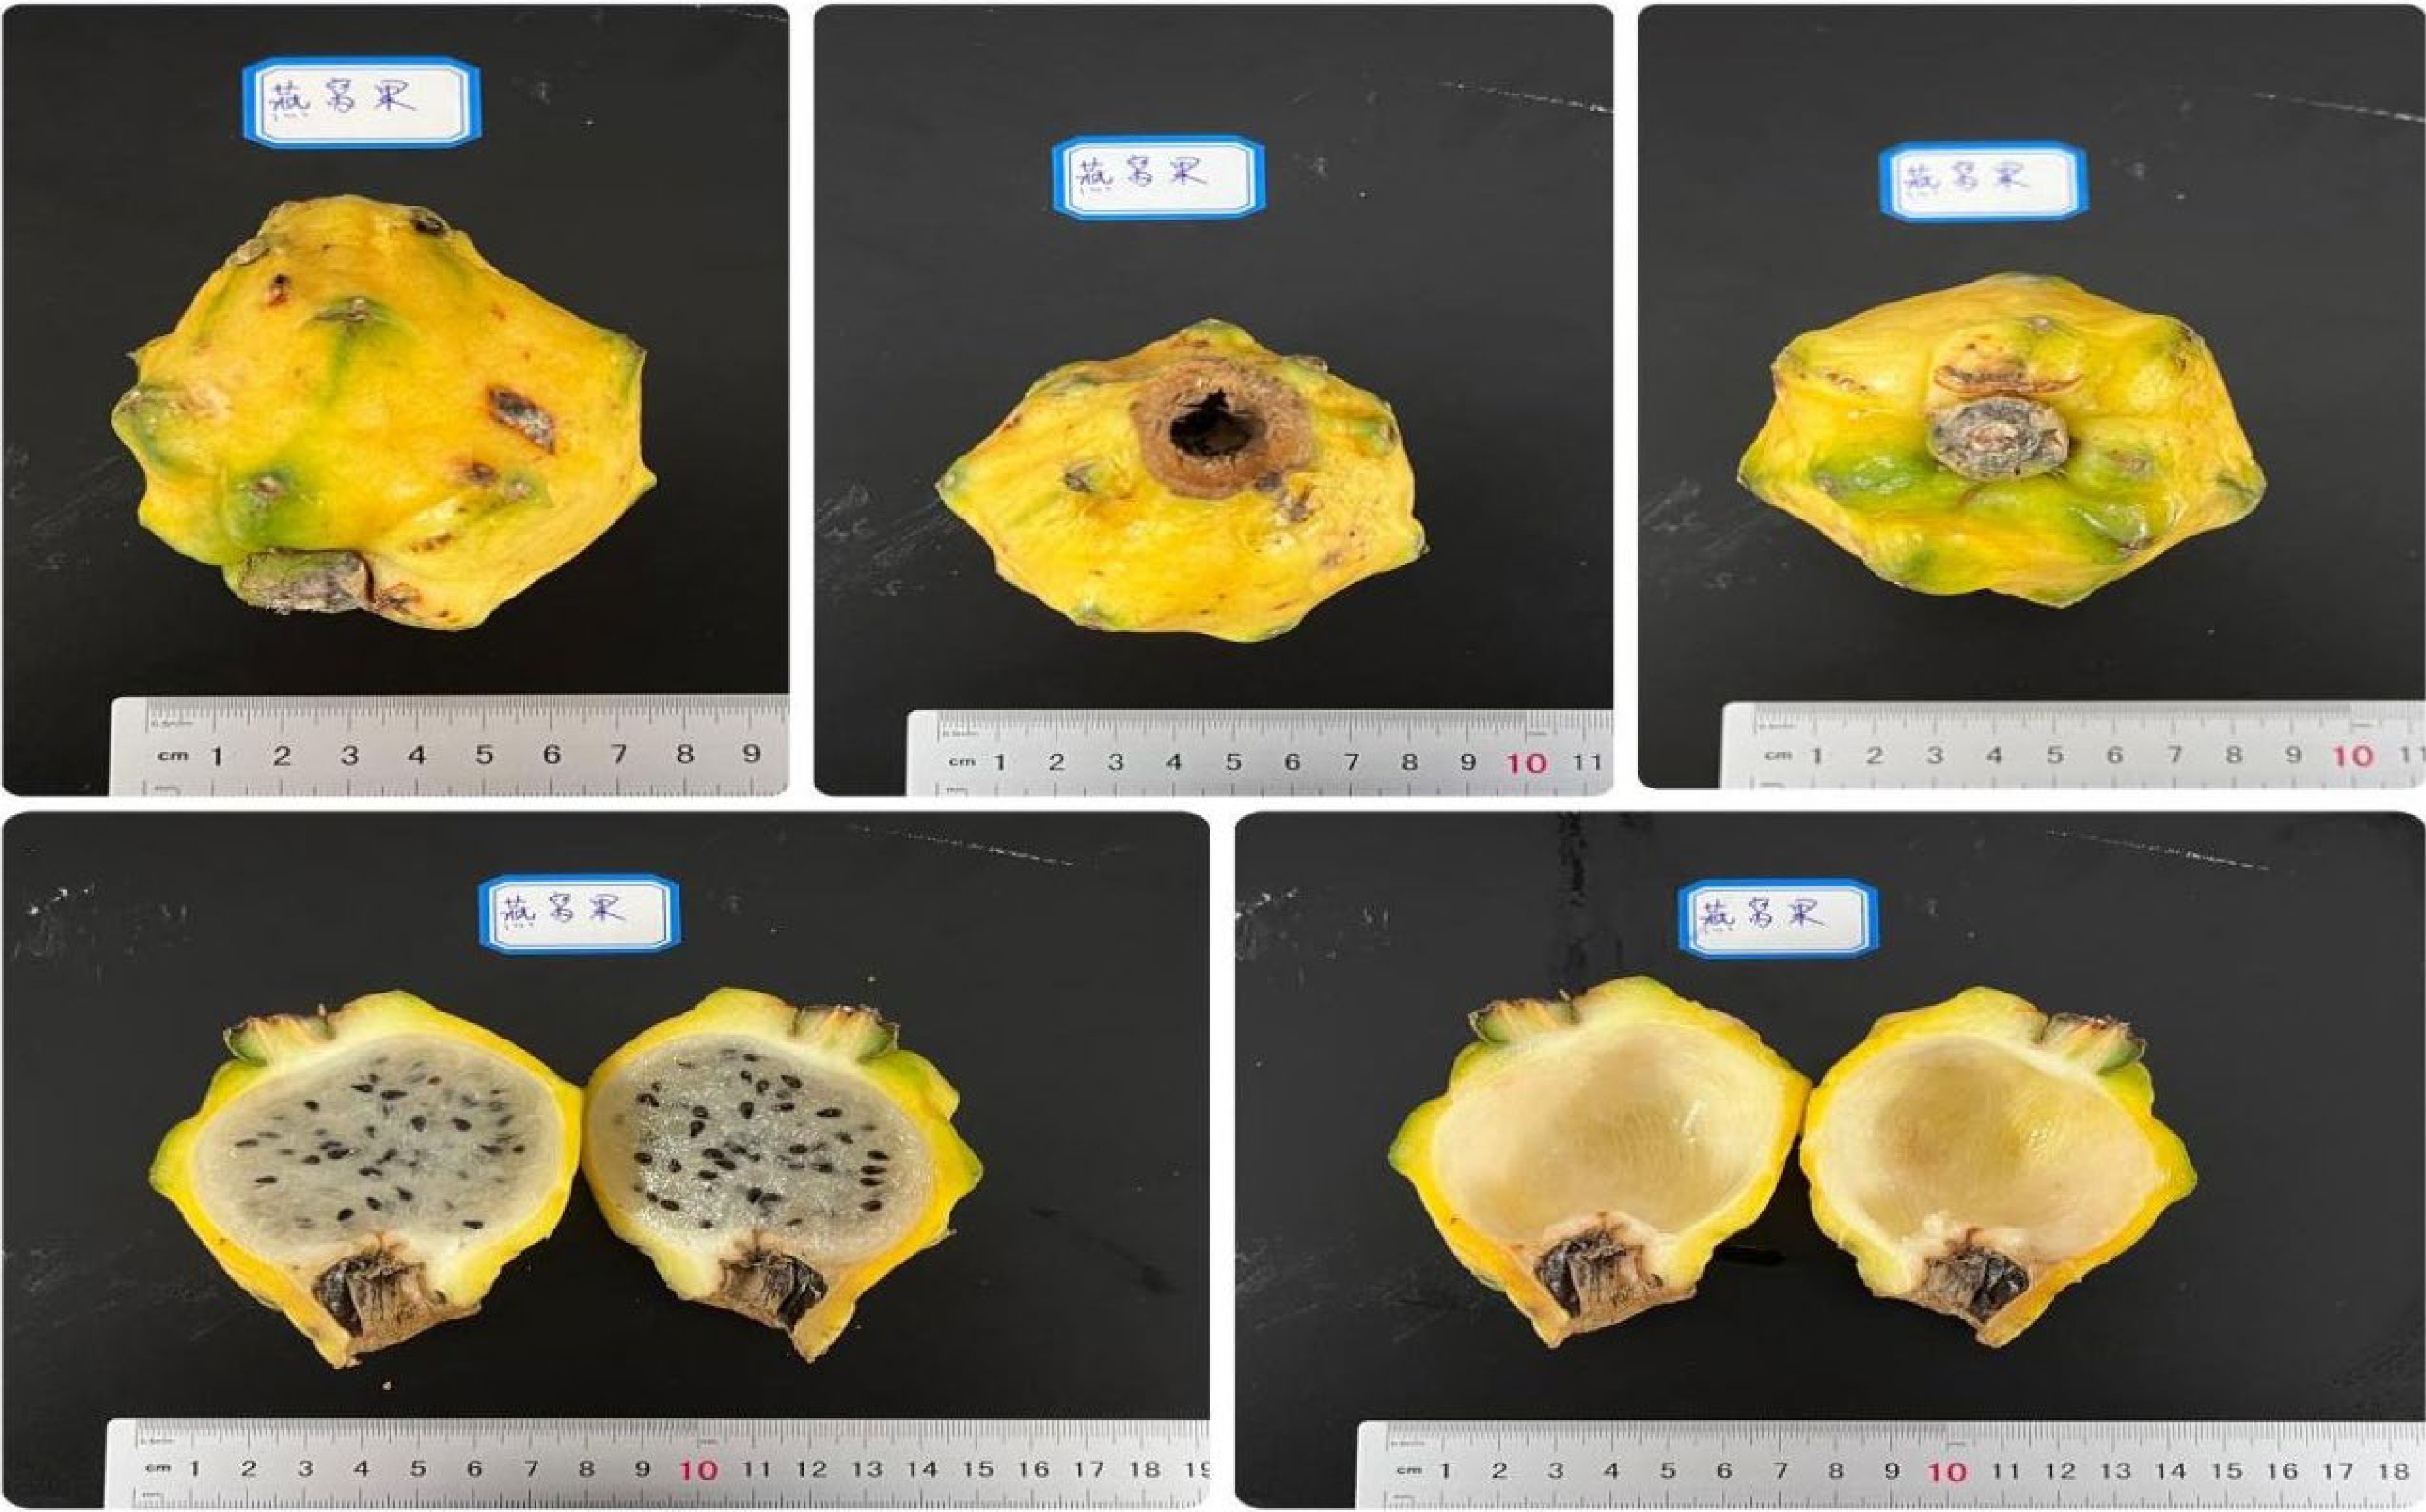
Figure 4.
Different views of the bird's nest fruit, a yellow Pitaya cultivar known as Yanwo in Hainan (Selenicereus undatus).
-
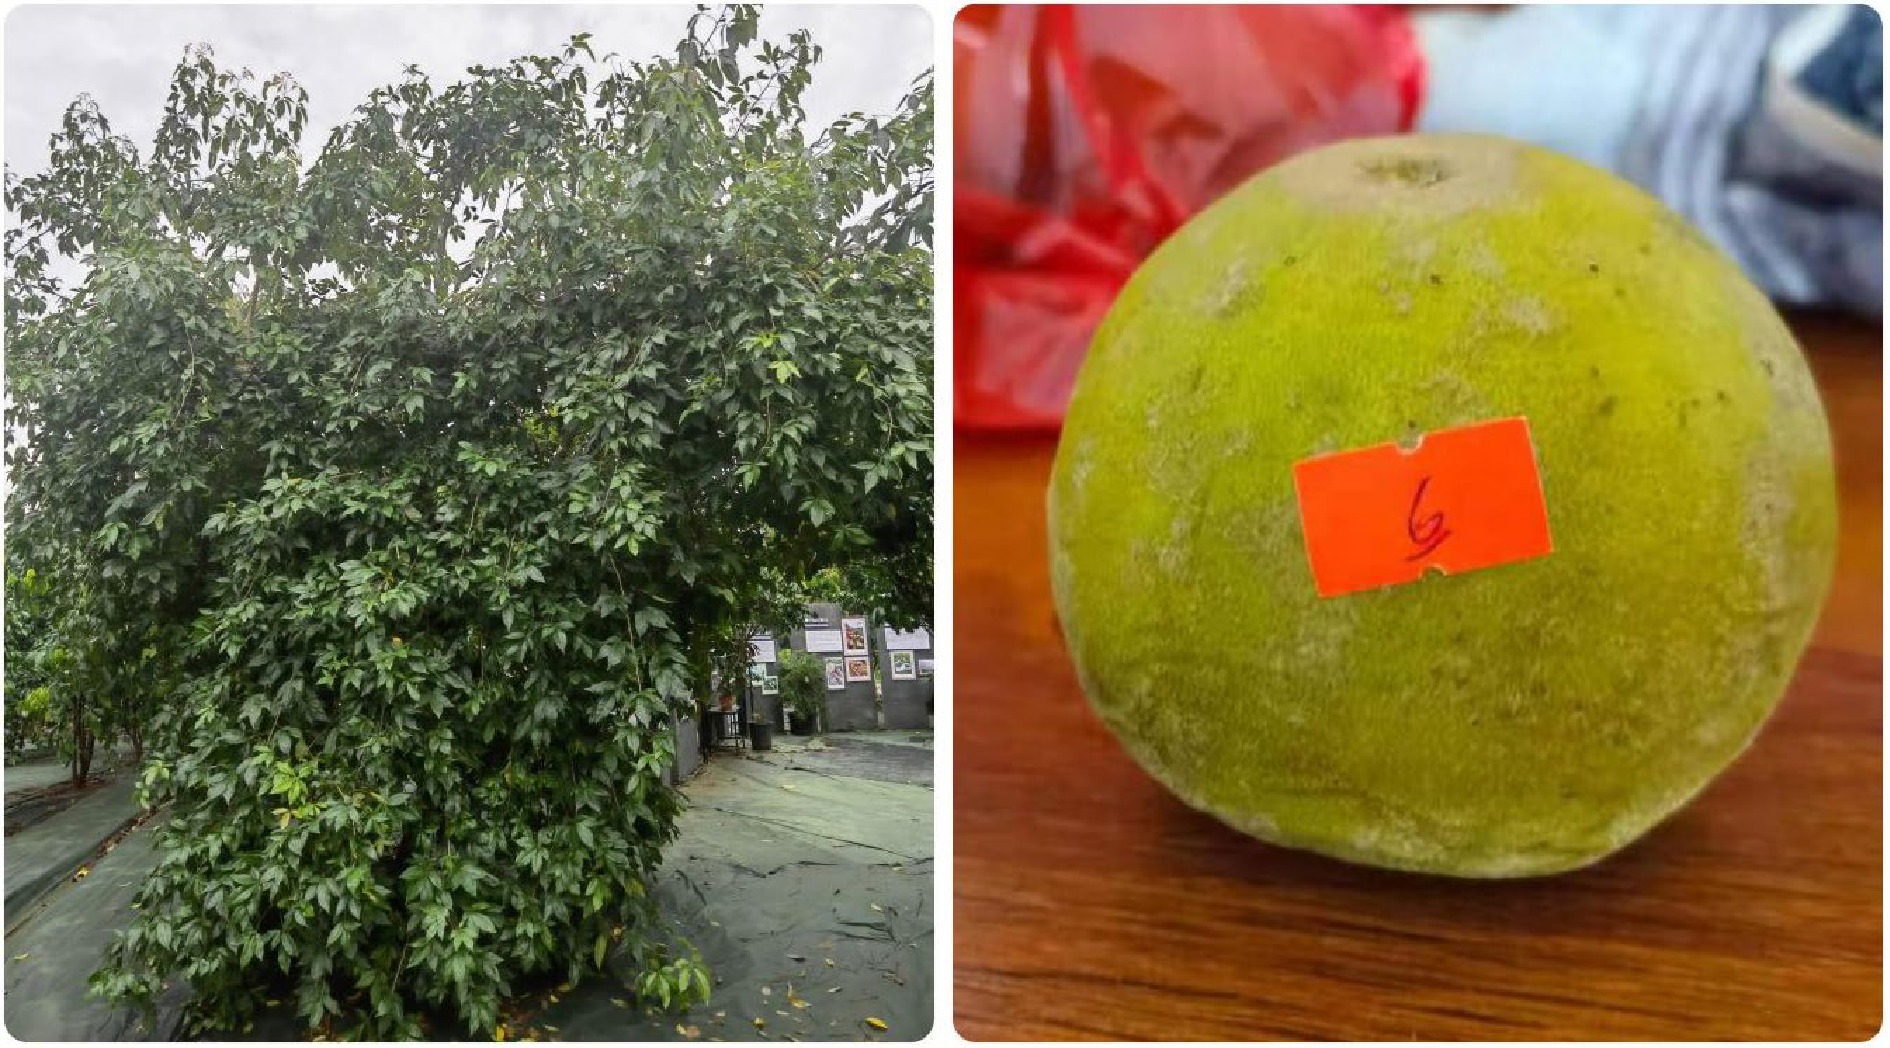
Figure 5.
An ice cream fruit tree (Casimiroa edulis) and a fully mature ice cream fruit.
-
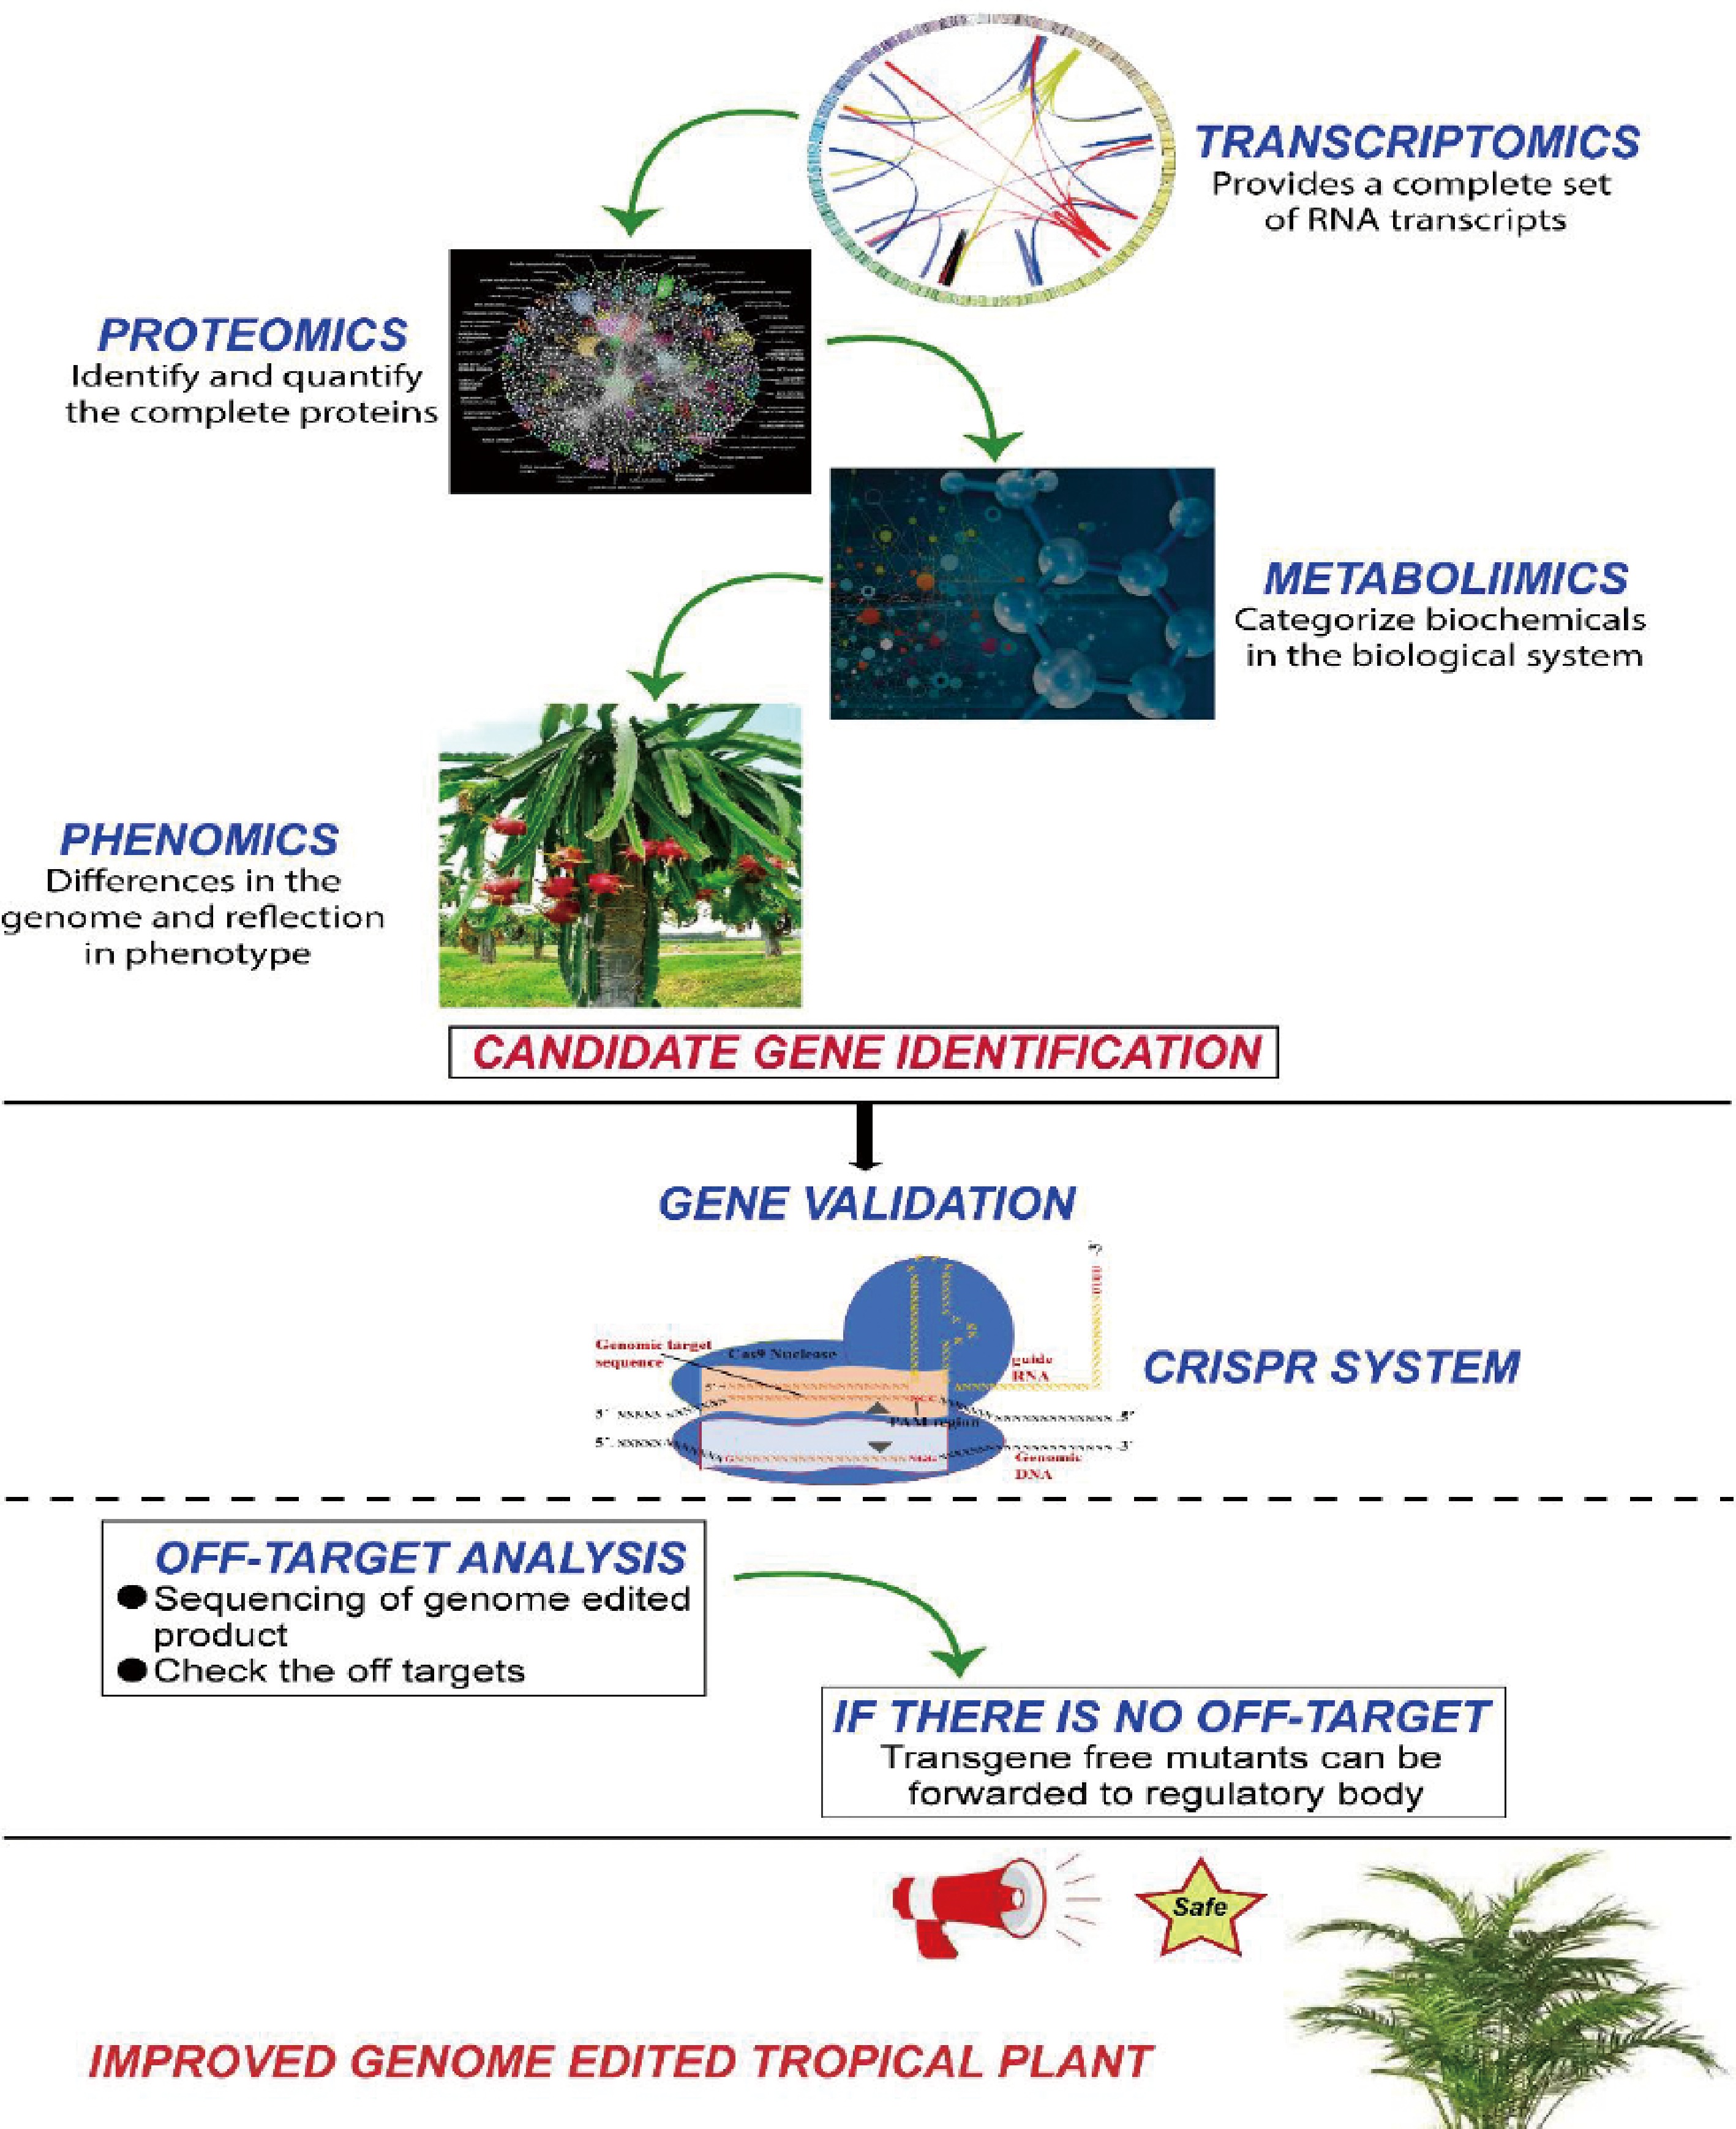
Figure 6.
Omics and CRISPR based strategy to improve tropical fruit crops.
-
Year 2005 2010 2014 2015 2016 2017 2018 2019 Farm output value 179.63 337.89 555.72 598.7 676.56 707.42 729.51 819.58 Fruit crops − 120.55 151.03 157.96 180.96 200.69 201.78 256.54 Table 1.
Value of total agricultural production and fruit crops in Hainan between 2005 and 2019 (Values given in 10,000 CNY; data taken from Hainan Agricultural Yearbook 2020).
-
Year Planting
area (mu)New planted area
that year (mu)Harvest
area (mu)Total output
(10,000 tons)2008 256.62 32.30 190.71 246.12 2009 255.90 42.52 204.60 267.90 2010 261.80 40.90 208.38 285.35 2011 269.37 48.78 221.60 308.17 2012 269.68 39.96 227.09 334.63 2013 256.65 31.67 226.89 342.54 2014 248.05 33.47 210.16 311.35 2015 243.30 23.14 204.22 296.68 2016 240.30 18.89 205.53 291.53 2017 251.30 23.77 210.60 303.81 2018 256.08 26.88 225.71 322.12 mu = 667 m2 Table 2.
Overview of tropical fruit production in Hainan from 2008 to 2018.
Figures
(6)
Tables
(2)