-
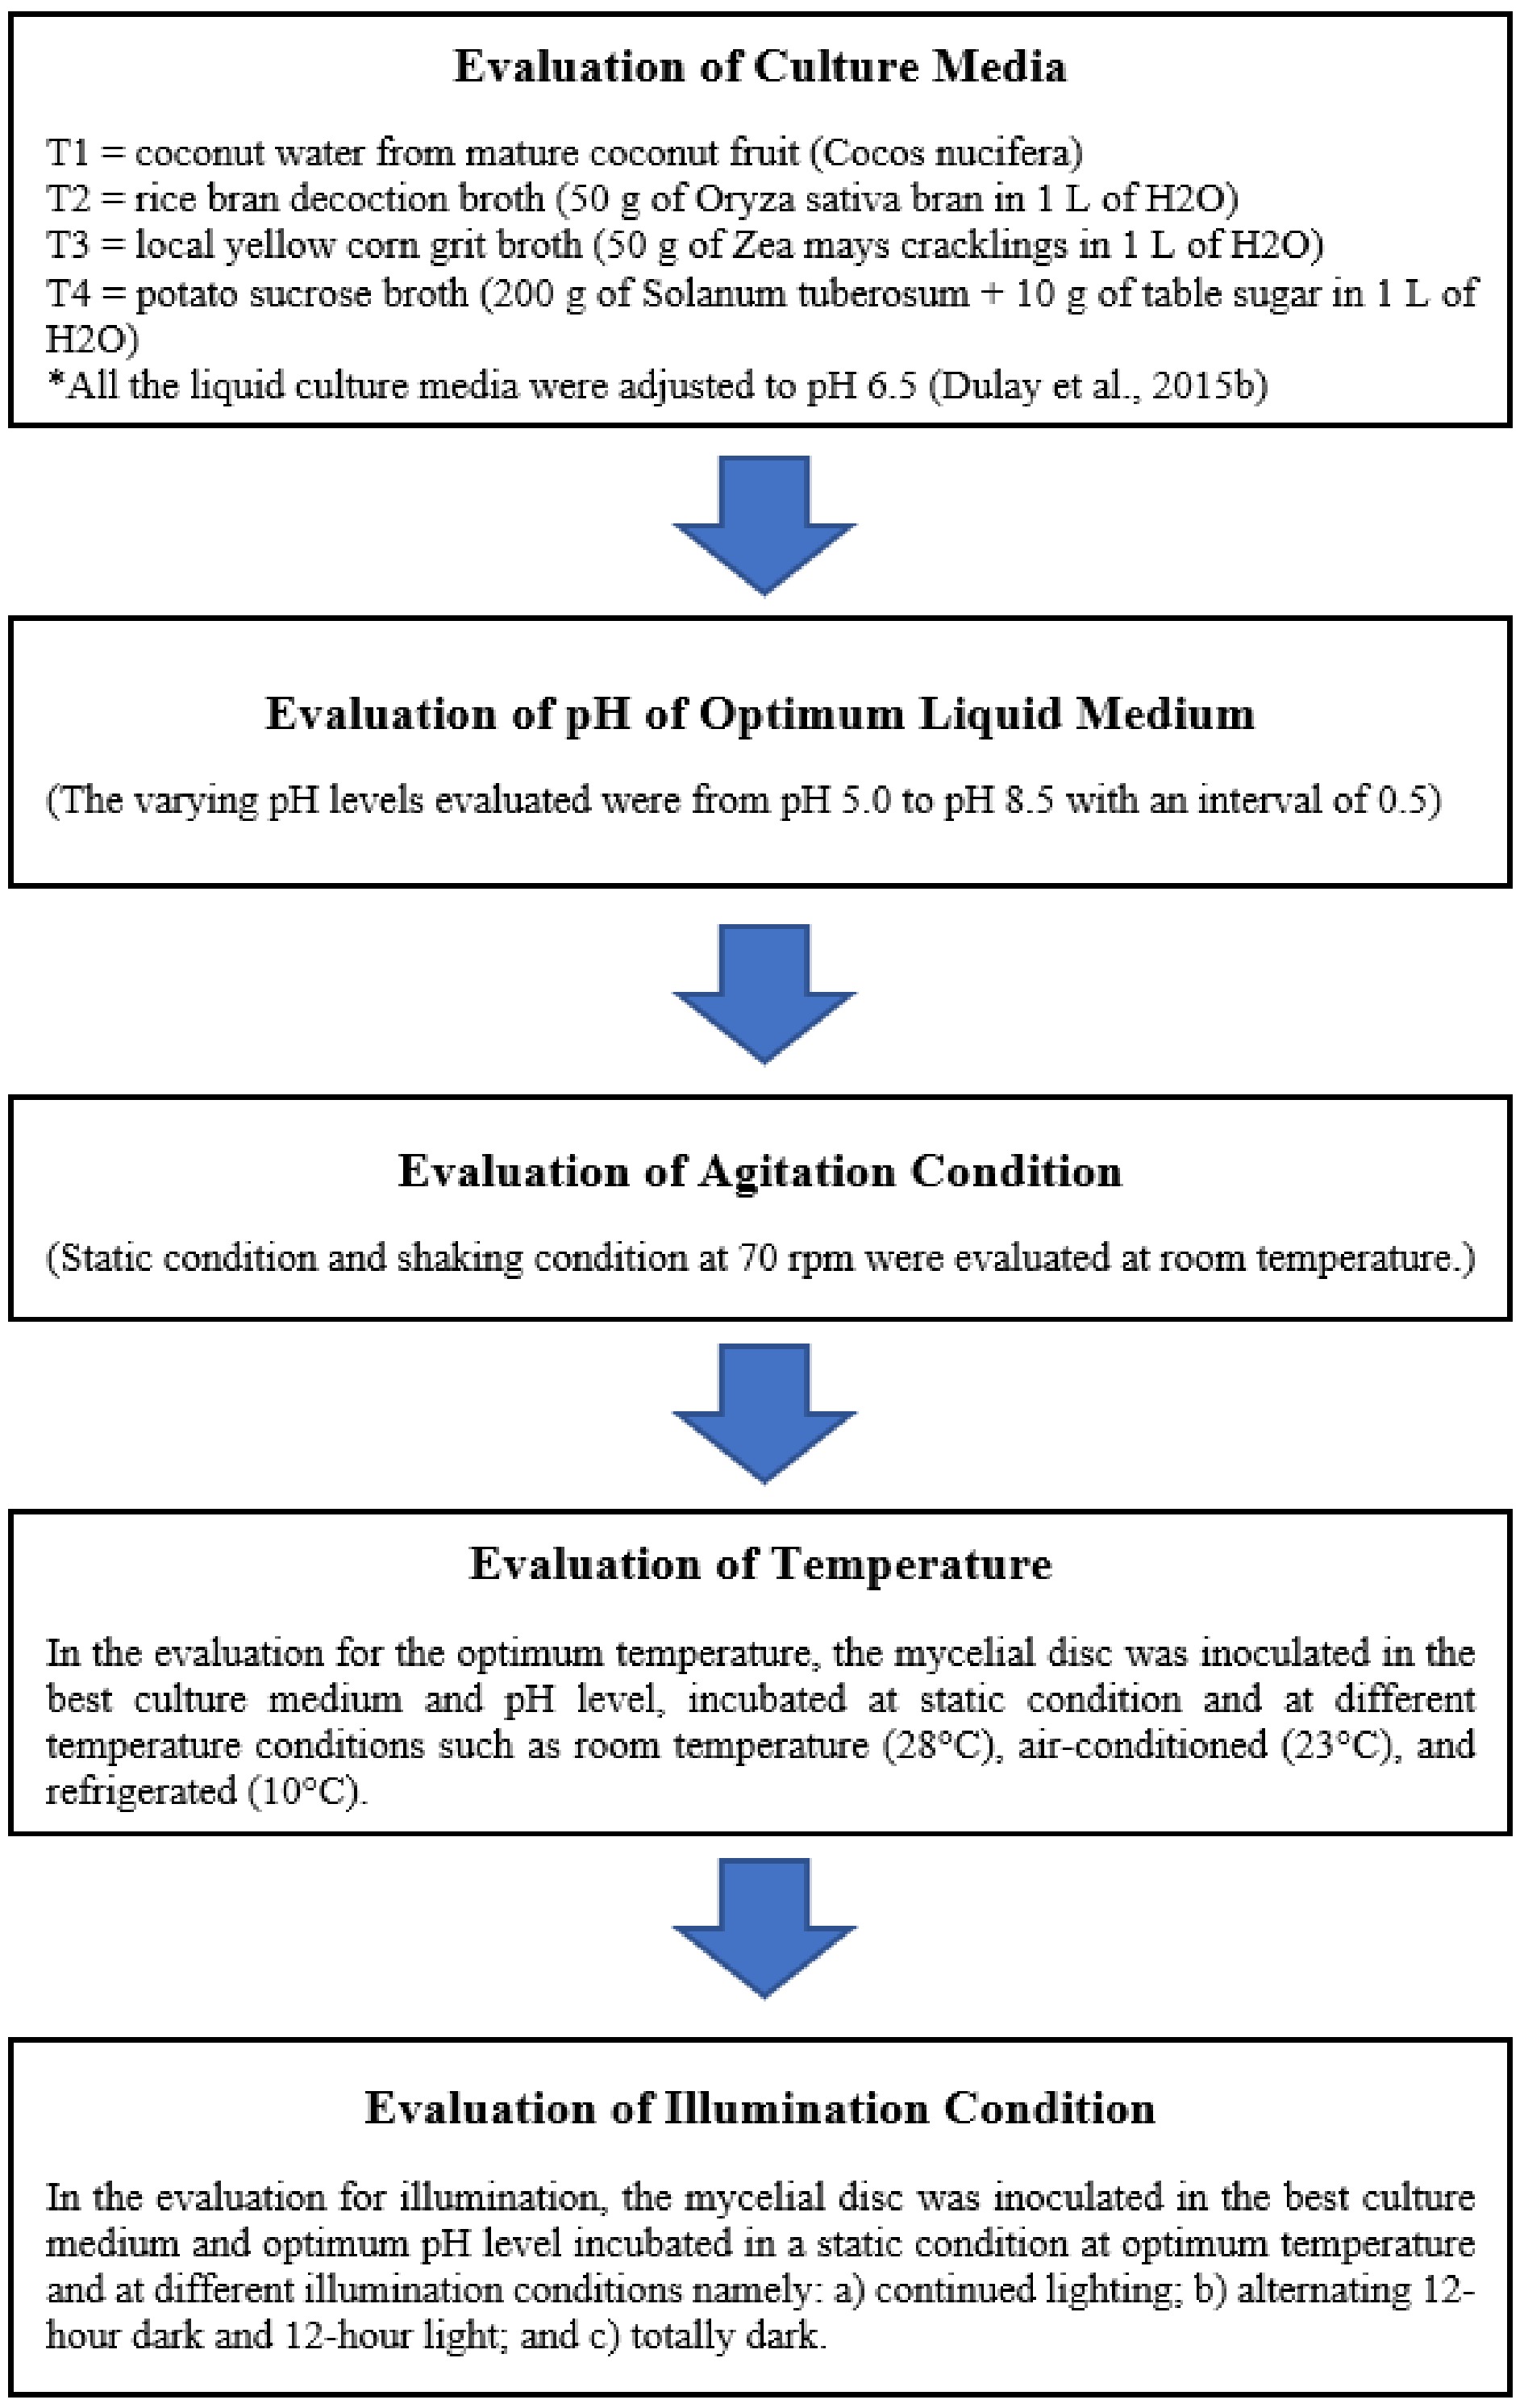
Figure 1.
Flow chart showing the step-by-step procedure done in the evaluation of optimum culture conditions for the mycelial growth of Xylaria papulis Lloyd.
-
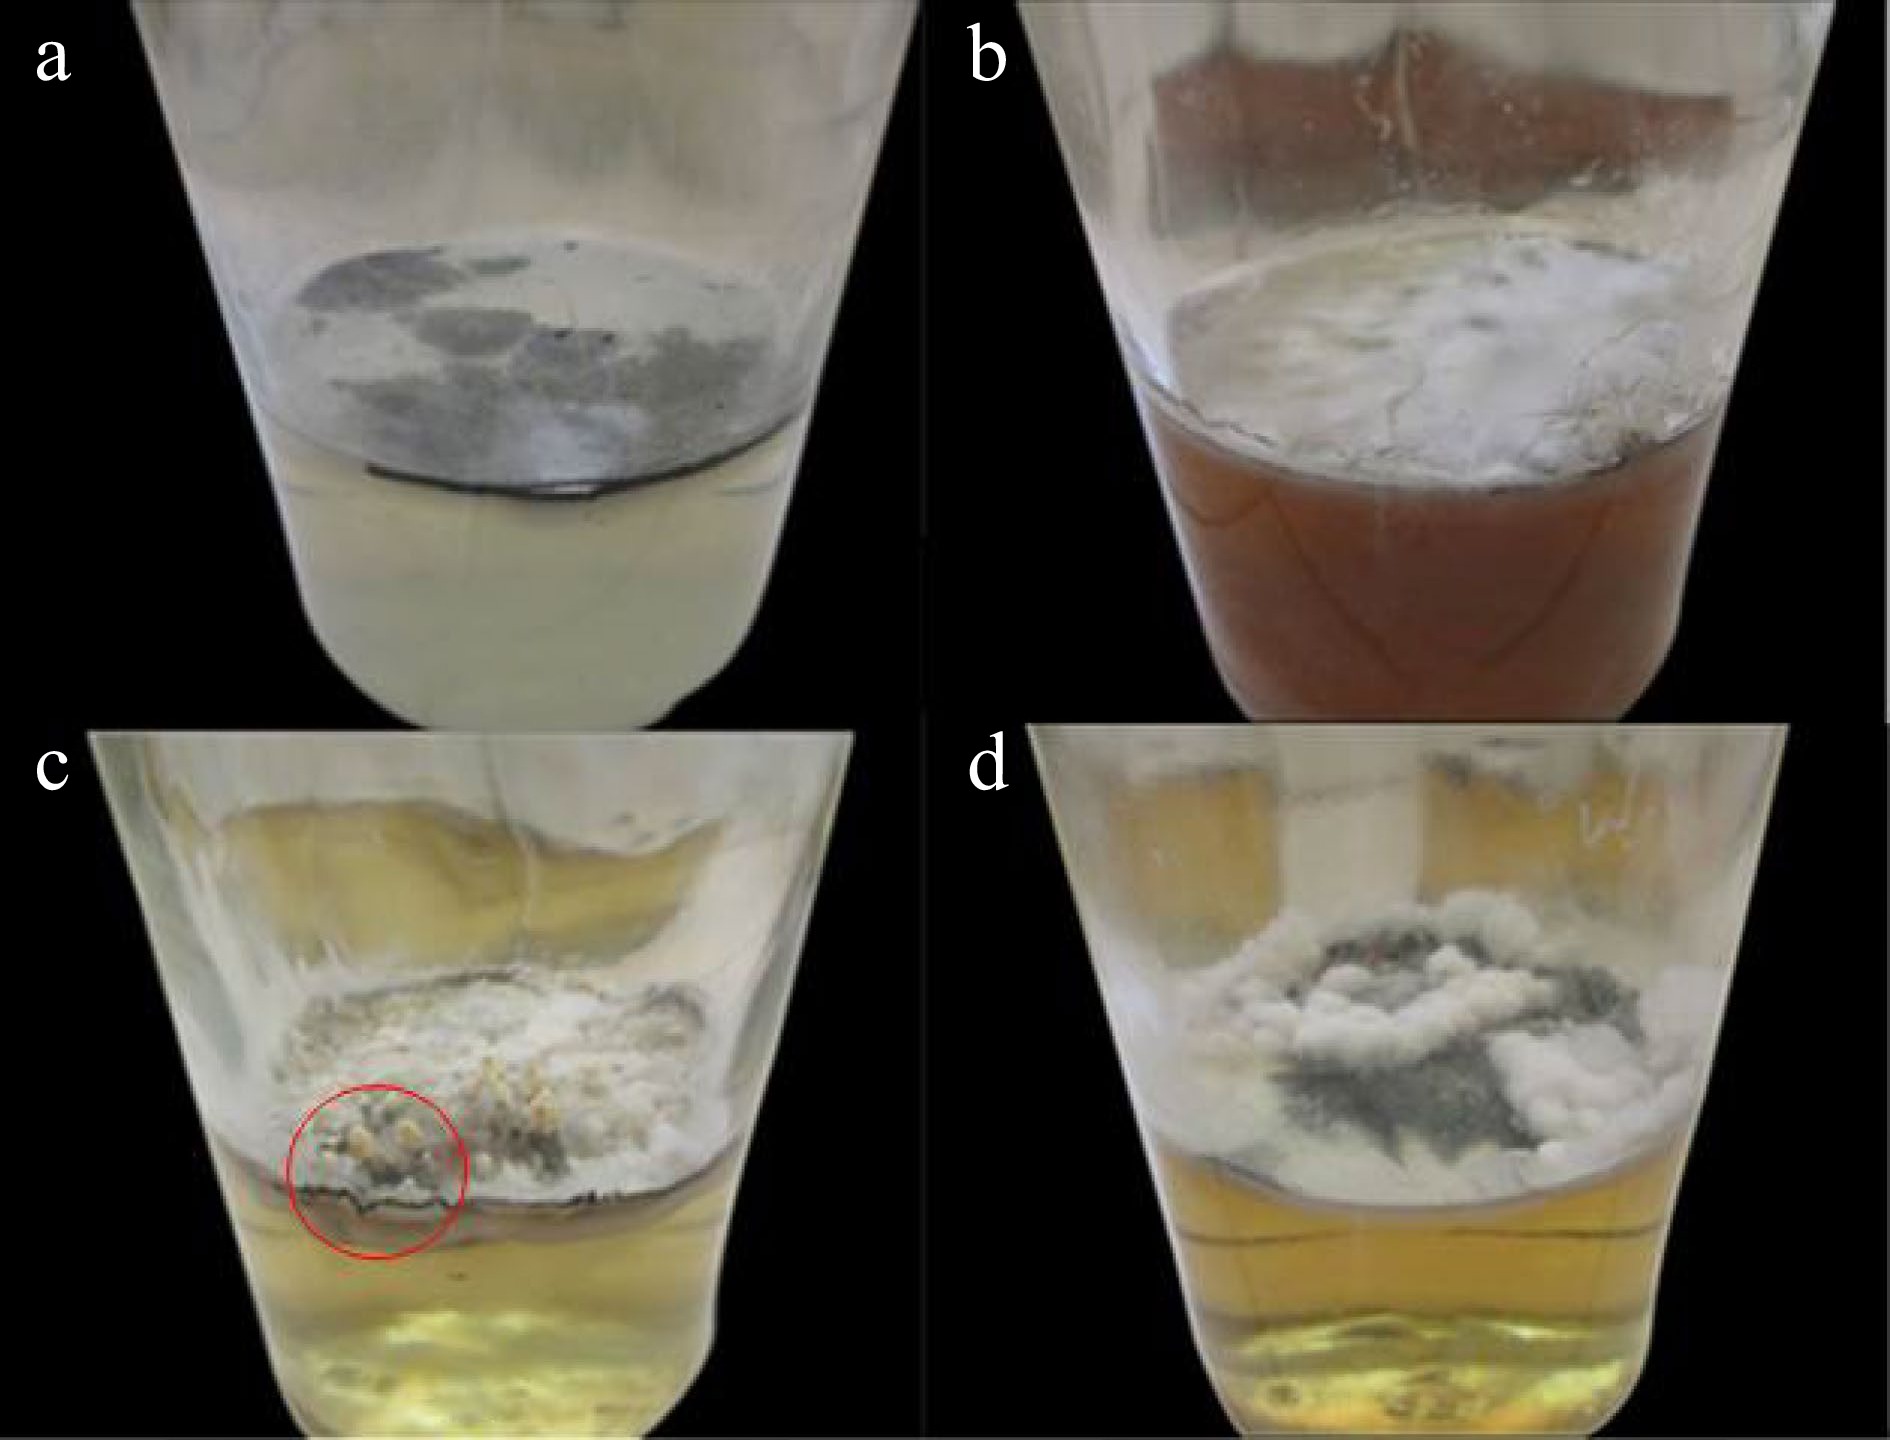
Figure 2.
Mycelia of X. papulis Lloyd produced from (a) Corn Grit Broth, (b) Rice Bran Broth, (c) Potato Sucrose Broth (sprouting young fruiting bodies encircled), and (d) Coconut Water.
-
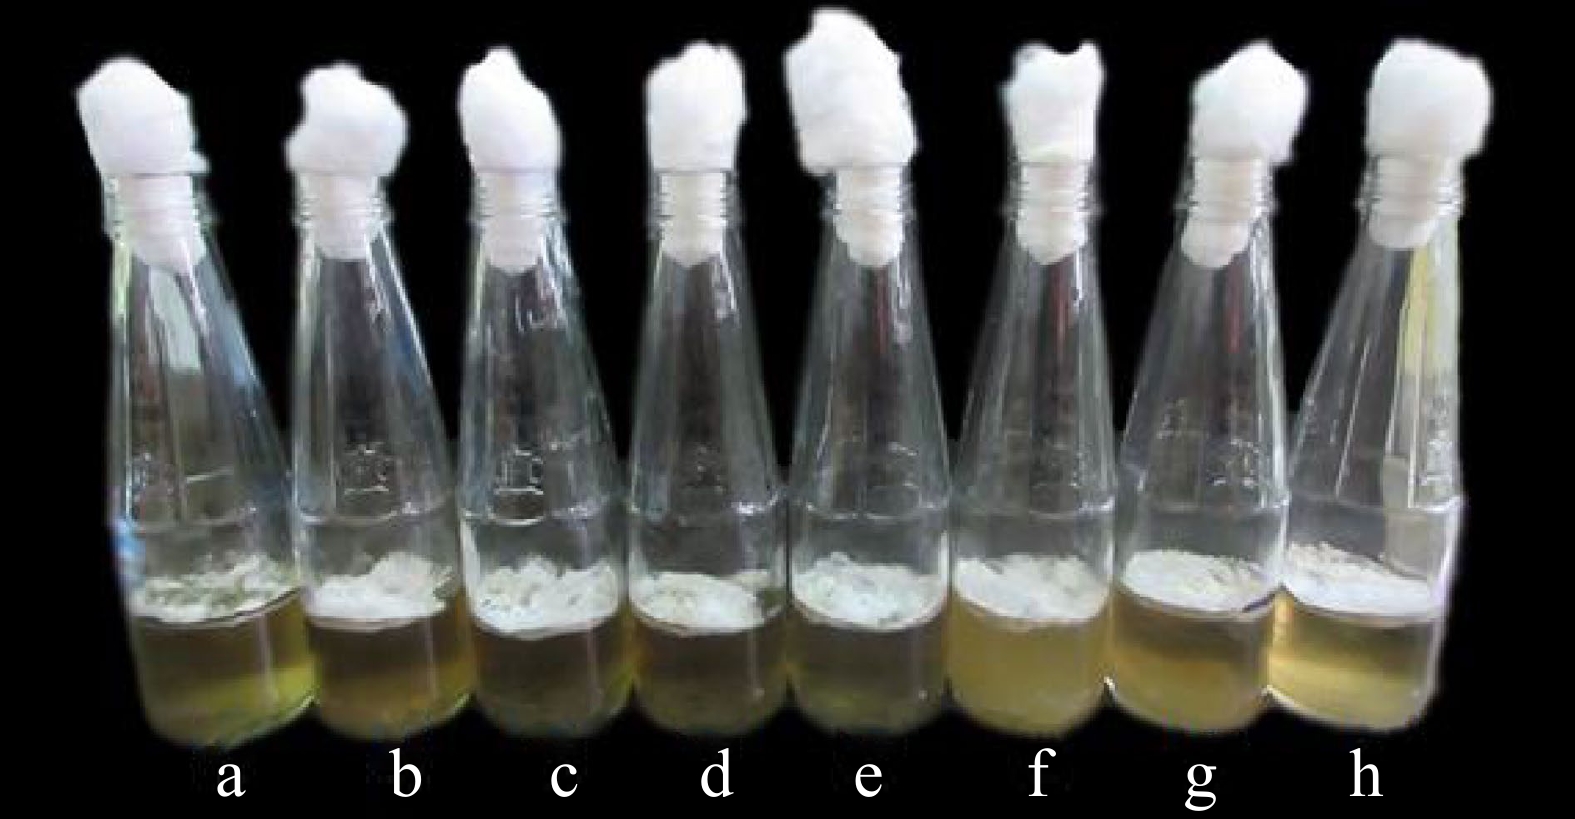
Figure 3.
Mycelia of X. papulis Lloyd produced from different pH levels of PSB such as (a) pH 8.5, (b) pH 8.0, (c) pH 7.5, (d) pH 7.0, (e) pH 6.5, (f) pH 6.0, (g) pH 5.0, and (h) pH 5.5 after 10 d of incubation.
-
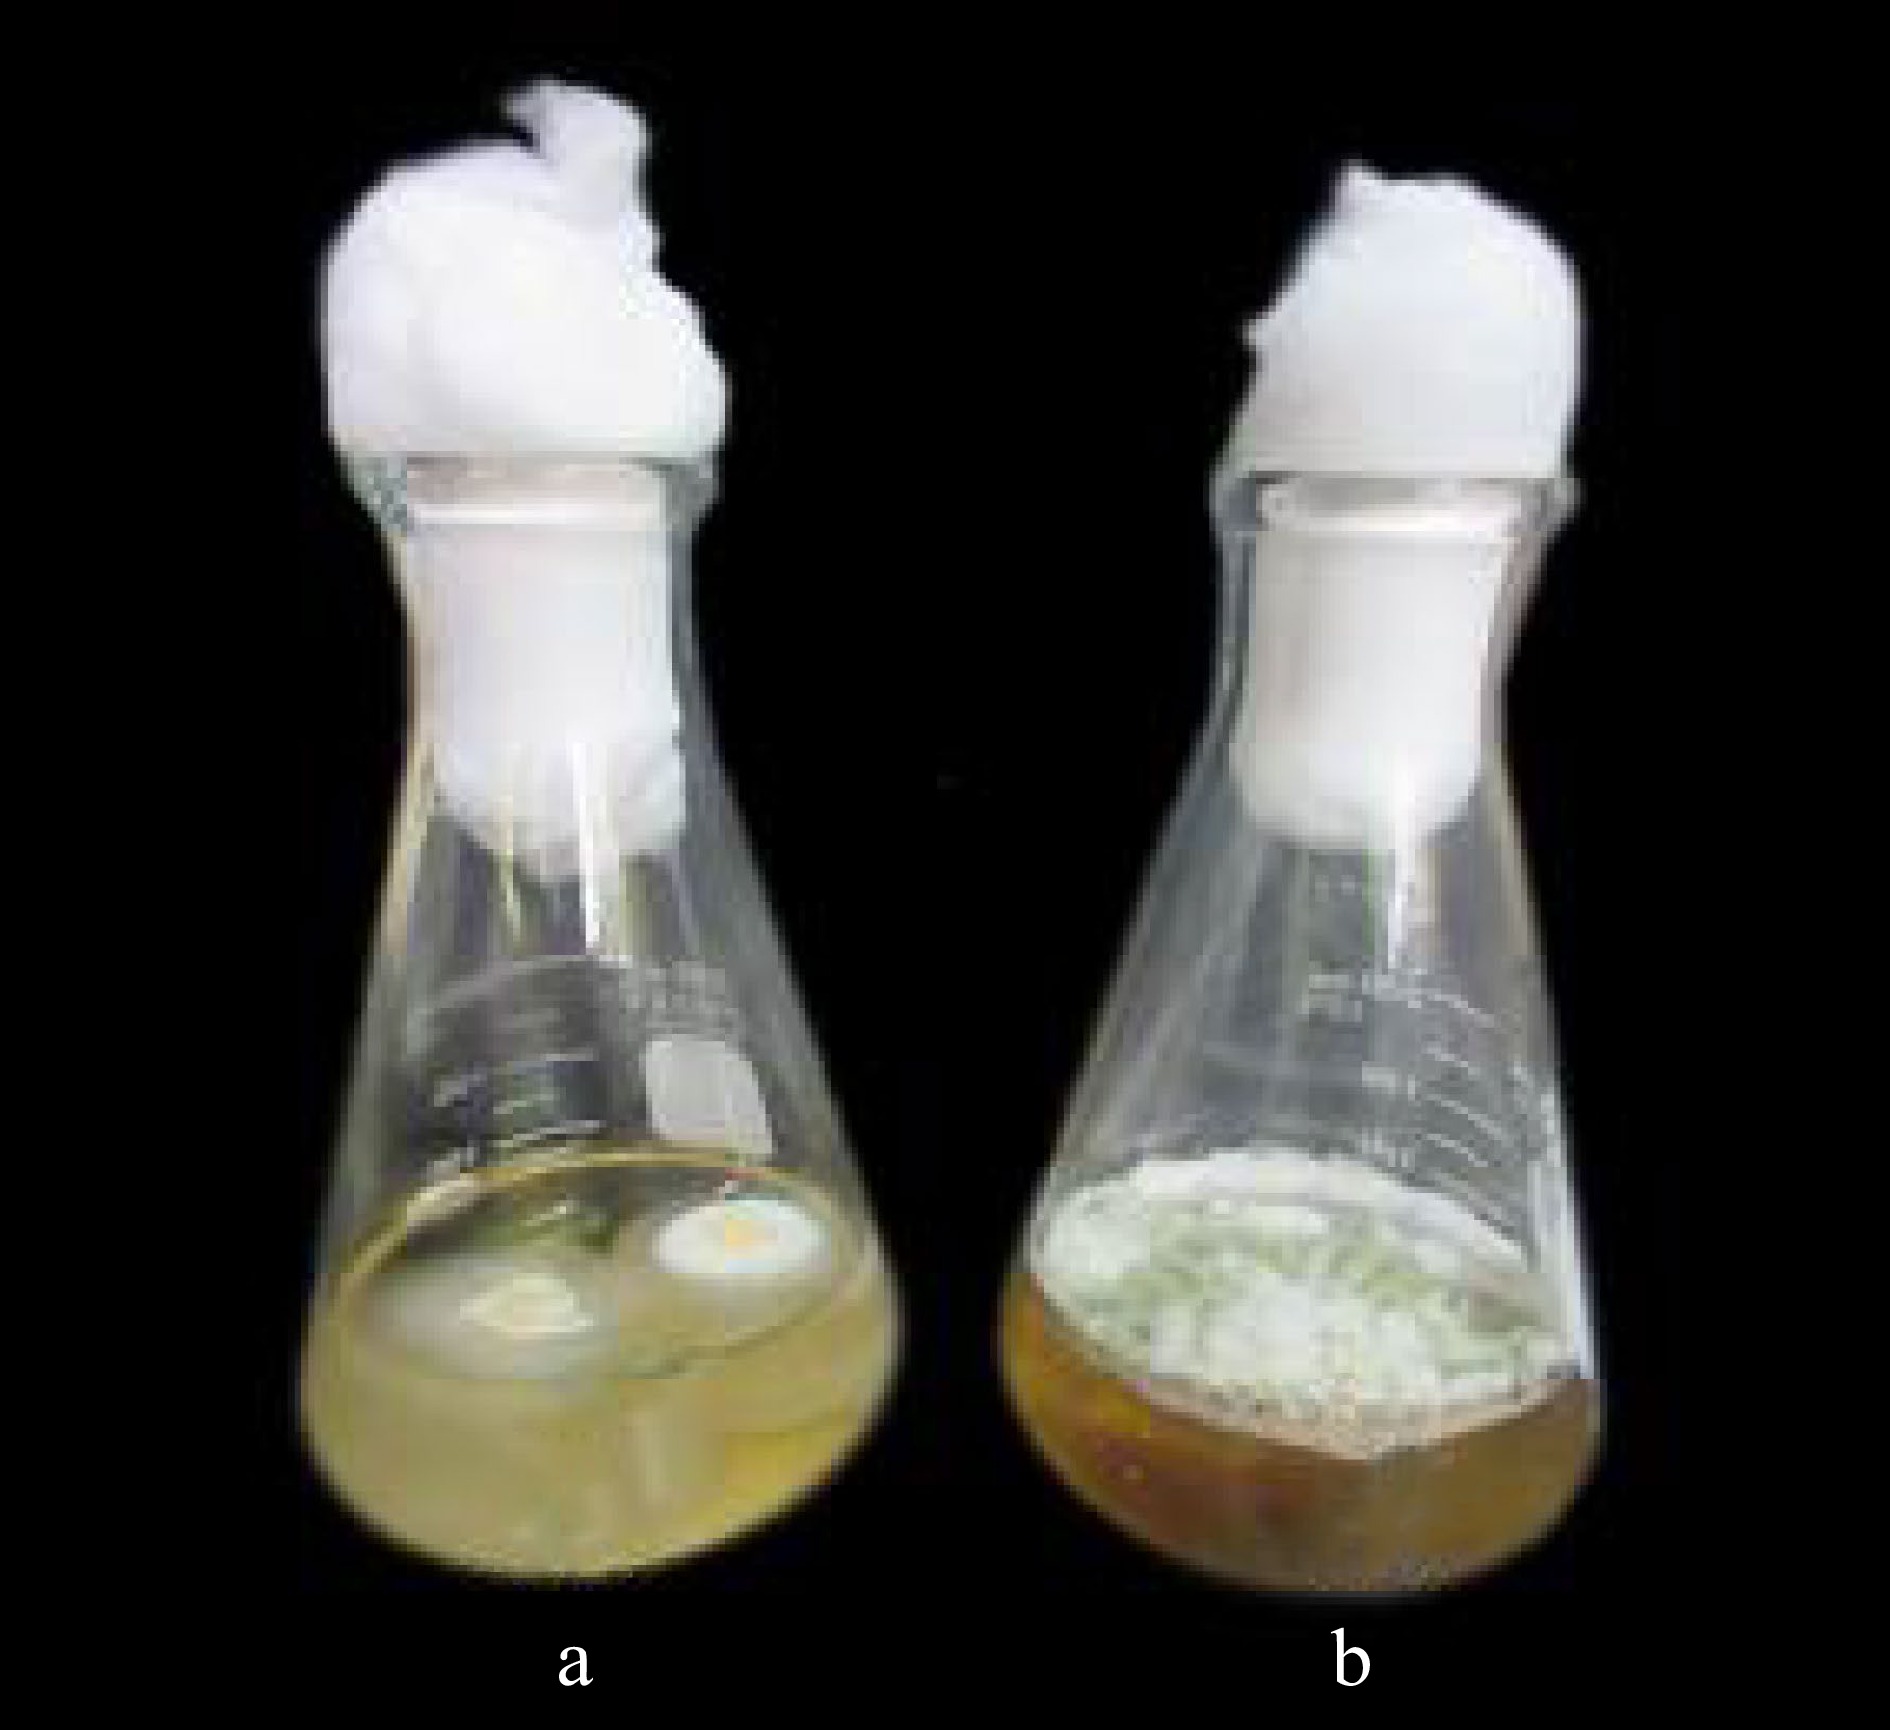
Figure 4.
Mycelial biomass of X. papulis Lloyd produced after 10 d from shaking condition at (a) 70 rpm and (b) static condition.
-
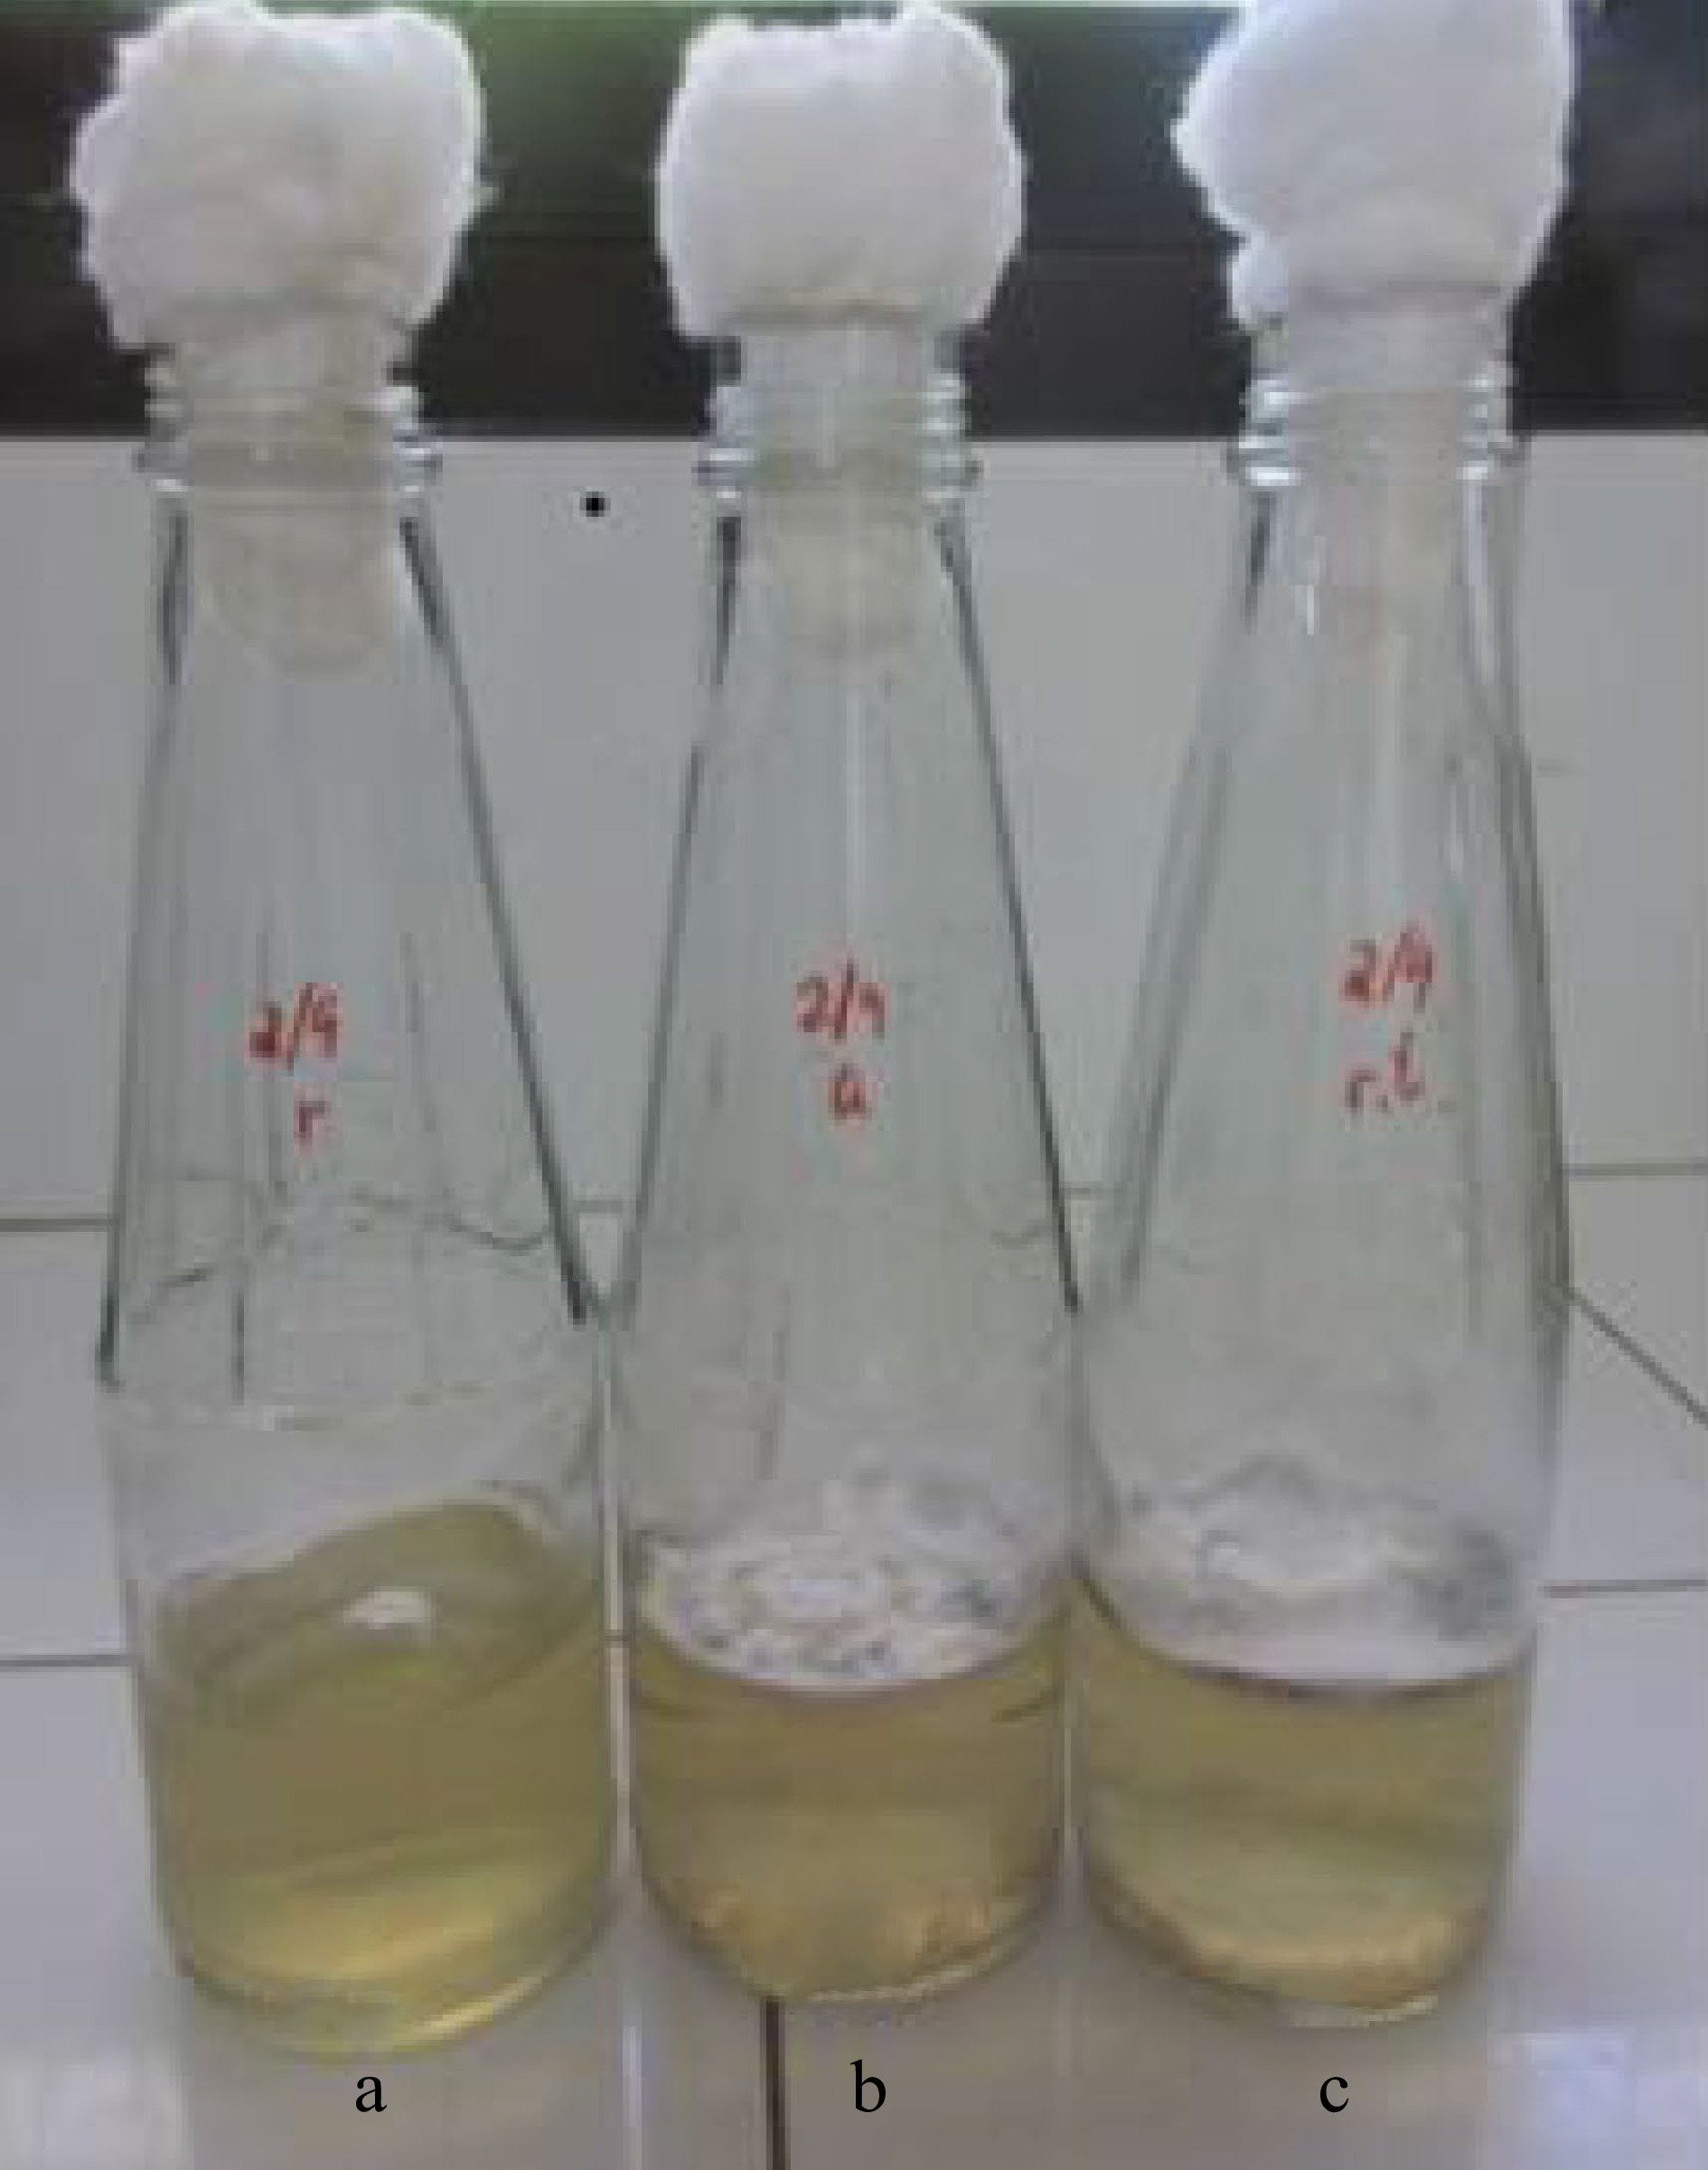
Figure 5.
Mycelia of X. papulis Lloyd produced after 10 d of incubation at different temperature conditions such as (a) refrigerated at 10 °C, (b) airconditioned at 23 °C, and (c) room temperature at 28 °C.
-
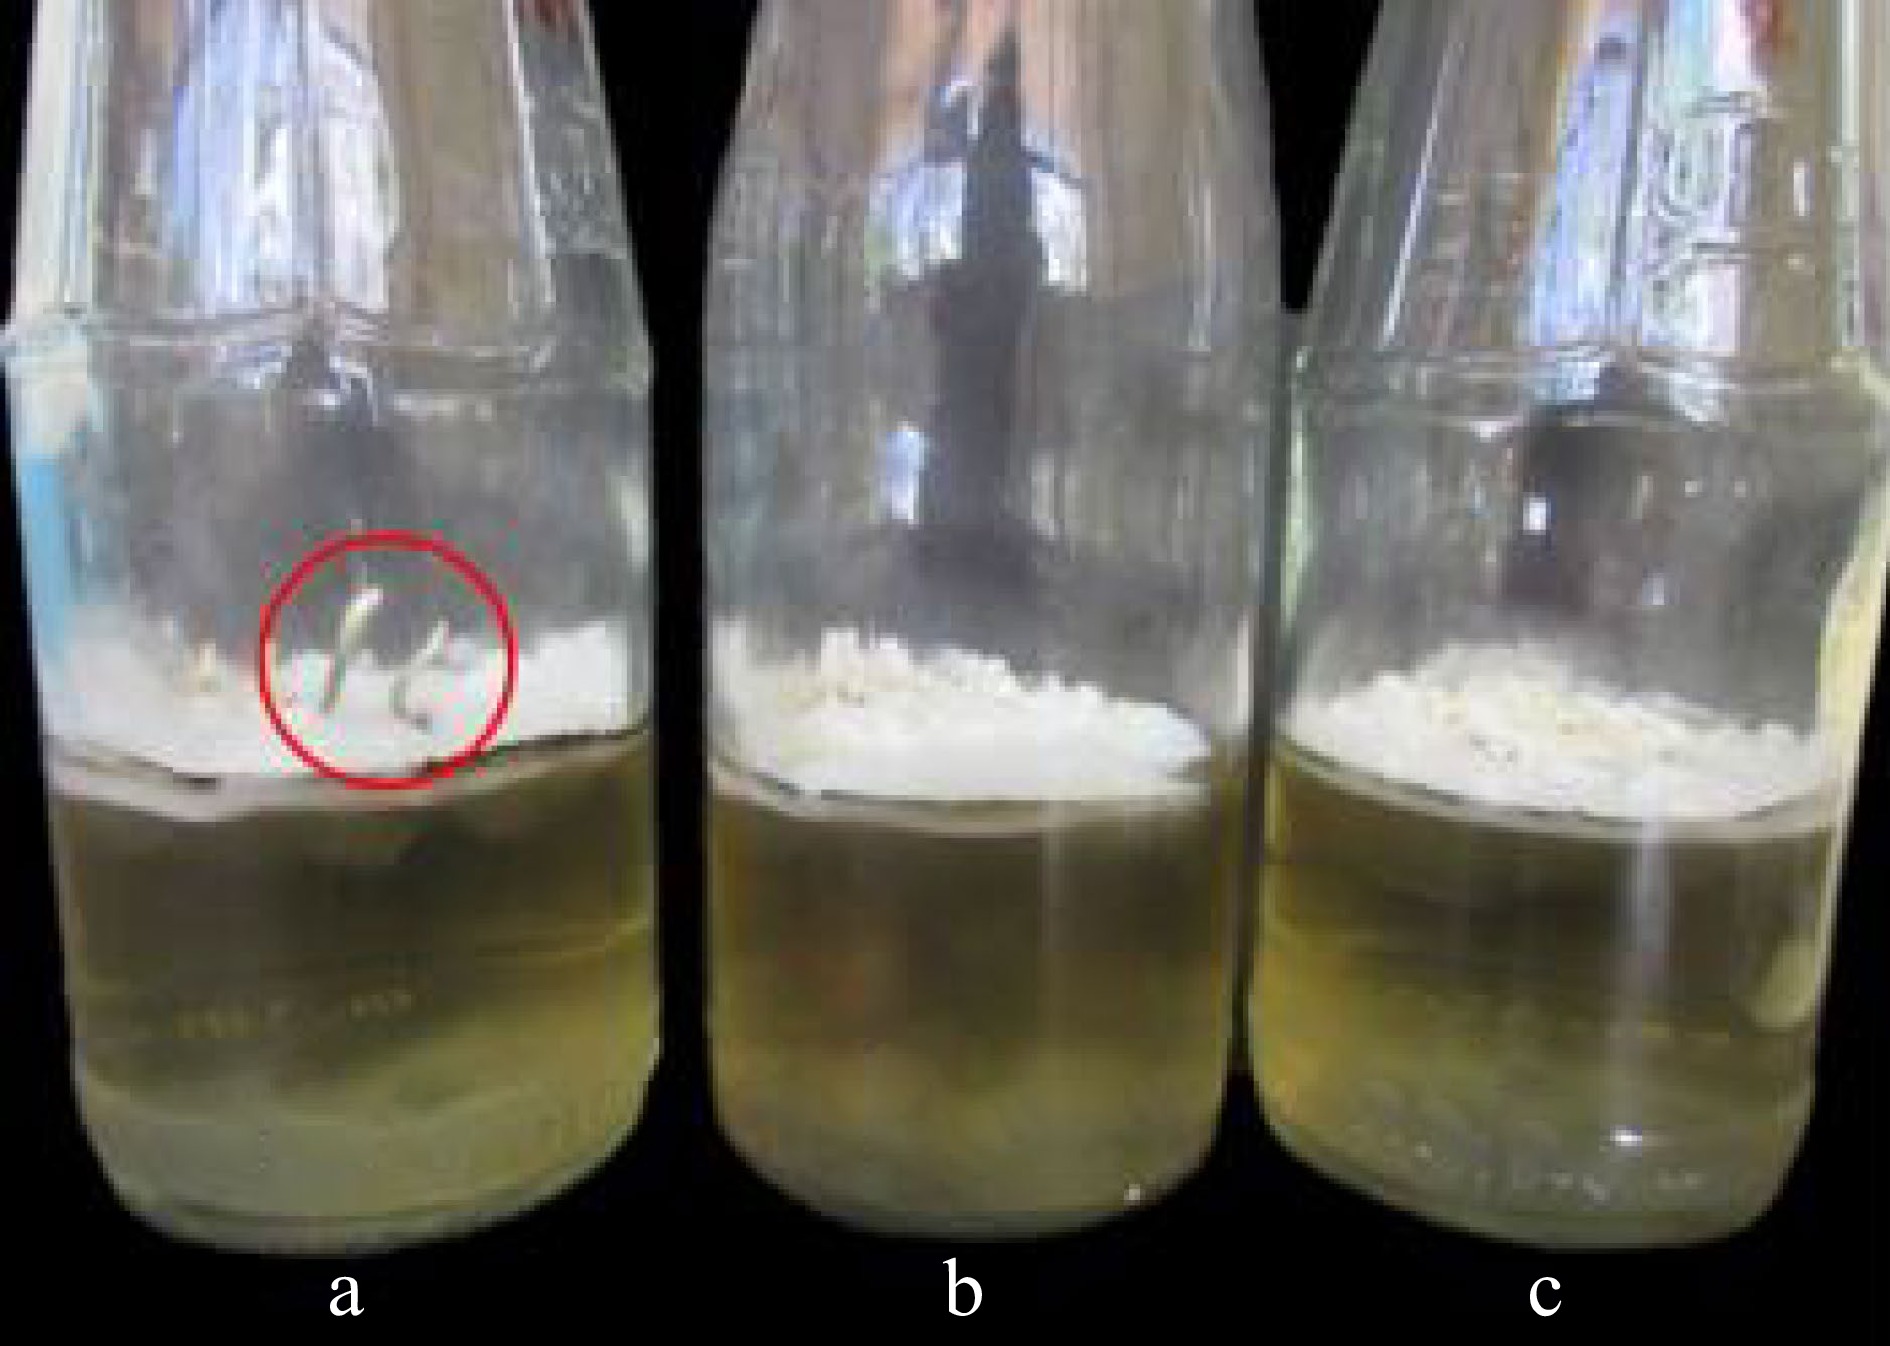
Figure 6.
Mycelia of X. papulis Lloyd produced after incubation at different illumination conditions such as (a) continued lighting, (b) alternating light and dark, and (c) totally dark for 10 d. Encircled in red are fruiting bodies observed in continued lighting condition.
-
Culture media Mycelial thickness*
(mm)Dry mycelial weight*
(mg)Coconut Water (CW) 1.02 ± 0.40c 315.00 ± 22.60b Corn Grit Broth (CGB) 1.42 ± 0.12bc 88.00 ± 55.40c Rice Bran Broth (RBB) 1.70 ± 0.51ab 345.10 ± 24.70b Potato Sucrose Broth (PSB) 2.31 ± 0.22a 814.80 ± 57.60a * Values are mean ± SD. Means in a column that do not share a letter are significantly different at a 5% level of significance using Tukey's Comparison of Means. Table 1.
Mycelial growth performance of X. papulis Lloyd after 10 d of incubation in different indigenous liquid culture media.
-
pH level (PSB) Mycelial thickness* (mm) Dry mycelial eeight* (mg) 5.0 1.51 ± 0.38bc 431.20 ± 26.50c 5.5 1.68 ± 0.43b 584.00 ± 57.30ab 6.0 2.53 ± 0.44a 651.10 ± 26.40a 6.5 1.96 ± 0.63ab 676.10 ± 39.10a 7.0 1.79 ± 0.67b 506.00 ± 76.00bc 7.5 1.78 ± 0.50b 458.00 ± 10.77c 8.0 1.57 ± 0.43bc 414.30 ± 21.30c 8.5 1.07 ± 0.52c 242.52 ± 62.40d * Values are mean ± SD. Means in a column that do not share a letter are significantly different at a 5% level of significance using Tukey's Comparison of Means. Table 2.
Mycelial growth performance of X. papulis Lloyd in optimum liquid medium (PSB) at different pH levels.
-
Agitation condition Mycelial thickness* (mm) Dry mycelial weight* (mg) Shaking (70 rpm) 0.93 ± 0.45b 233.90 ± 53.4b Static 1.94 ± 0.72a 381.50 ± 65.0a * Values are mean ± SD. Means in a column that do not share a letter are significantly different at 5% level of significance using t-test. Table 3.
Mycelial growth performance of X. papulis Lloyd on different agitation conditions after 10 d of incubation.
-
Temperature condition Mycelial thickness* (mm) Dry mycelial weight* (mg) Refrigerated (10 °C) 0.00 ± 0.00b 0.00 ± 0.00b Airconditioned (23 °C) 1.80 ± 0.54a 318.00 ± 47.60a Room temperature (28 °C) 1.99 ± 0.79a 320.00 ± 36.70a * Values are mean ± SD. Means in a column that do not share a letter are significantly different at 5% level of significance using Tukey's Comparison of Means. Table 4.
Mycelial growth performance of X. papulis Lloyd in different temperature conditions after 10 d of incubation.
-
Illumination condition Mycelial thickness* (mm) Dry mycelial weight* (mg) Lit 1.99 ± 0.41a 405.20 ± 57.30a Alternate light and dark (every 12 h) 1.25 ± 0.50b 380.80 ± 20.80a Dark 1.17 ± 0.48b 403.70 ± 13.70a *Values are mean ± SD. Means in a column that do not share a letter are significantly different at 5% level of significance using Tukey's Comparison of Means. Table 5.
Mycelial growth performance of X. papulis Lloyd in different illumination conditions after 10 d of incubation.
Figures
(6)
Tables
(5)