-
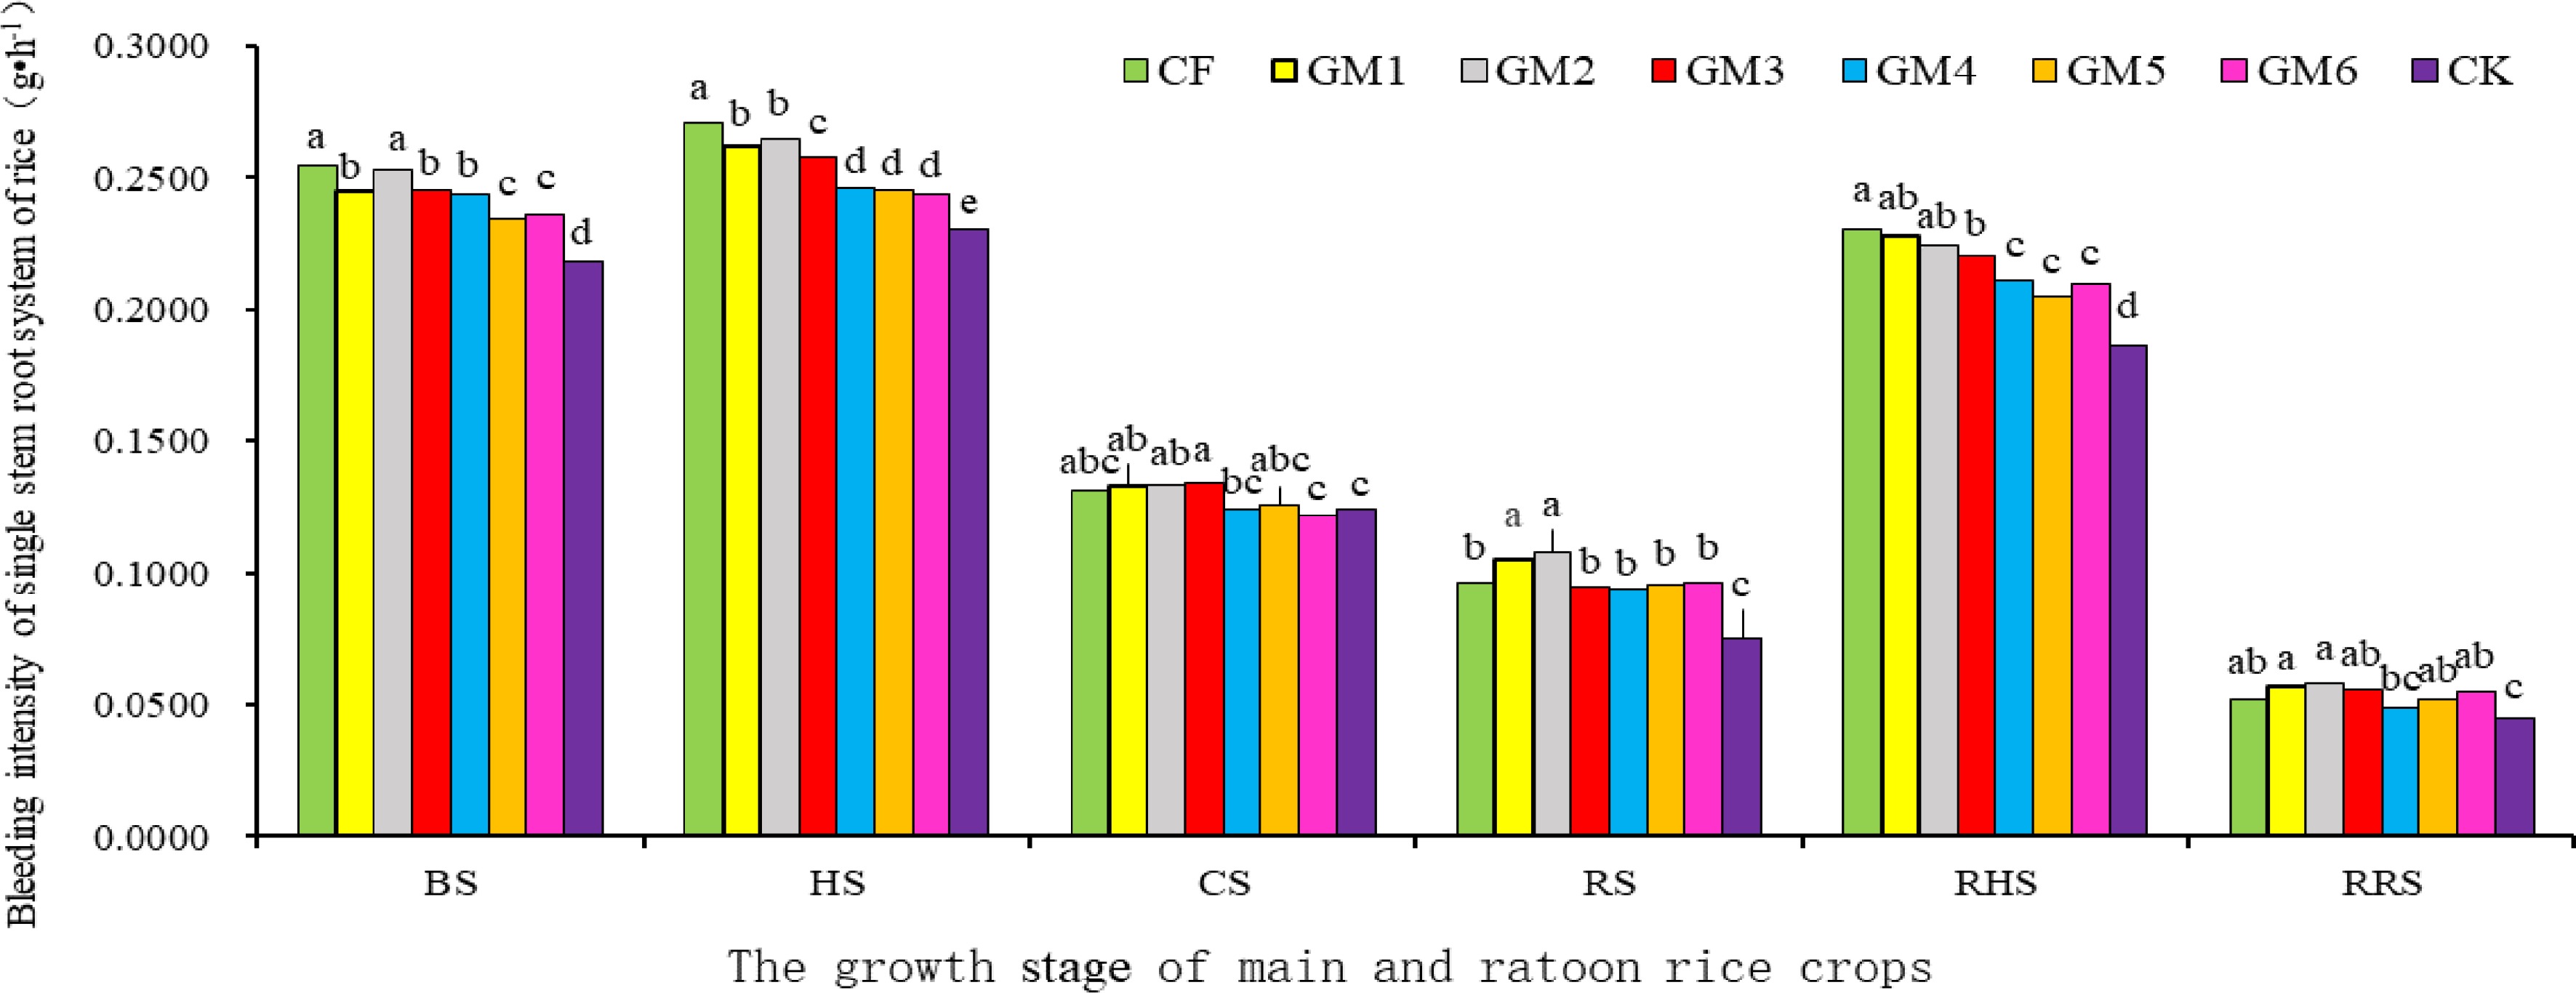
Figure 1.
Effects of treatment with different ratios of organic and inorganic fertilizers on the root sap intensity of main and ratoon rice crop plants in single stem level. Note: Different lower case letters indicate significant differences in p < 0.05 level between different treatments in the same part and the same period. BS: booting; HS: fully heading stage, CS: the day close to the stage fertilizing for root-vigor preserving and bud promoting, RS: ripening stages of the main season crop, RHS: fully heading of ratooning season rice, RRS: ripening stages of ratooning season rice.
-
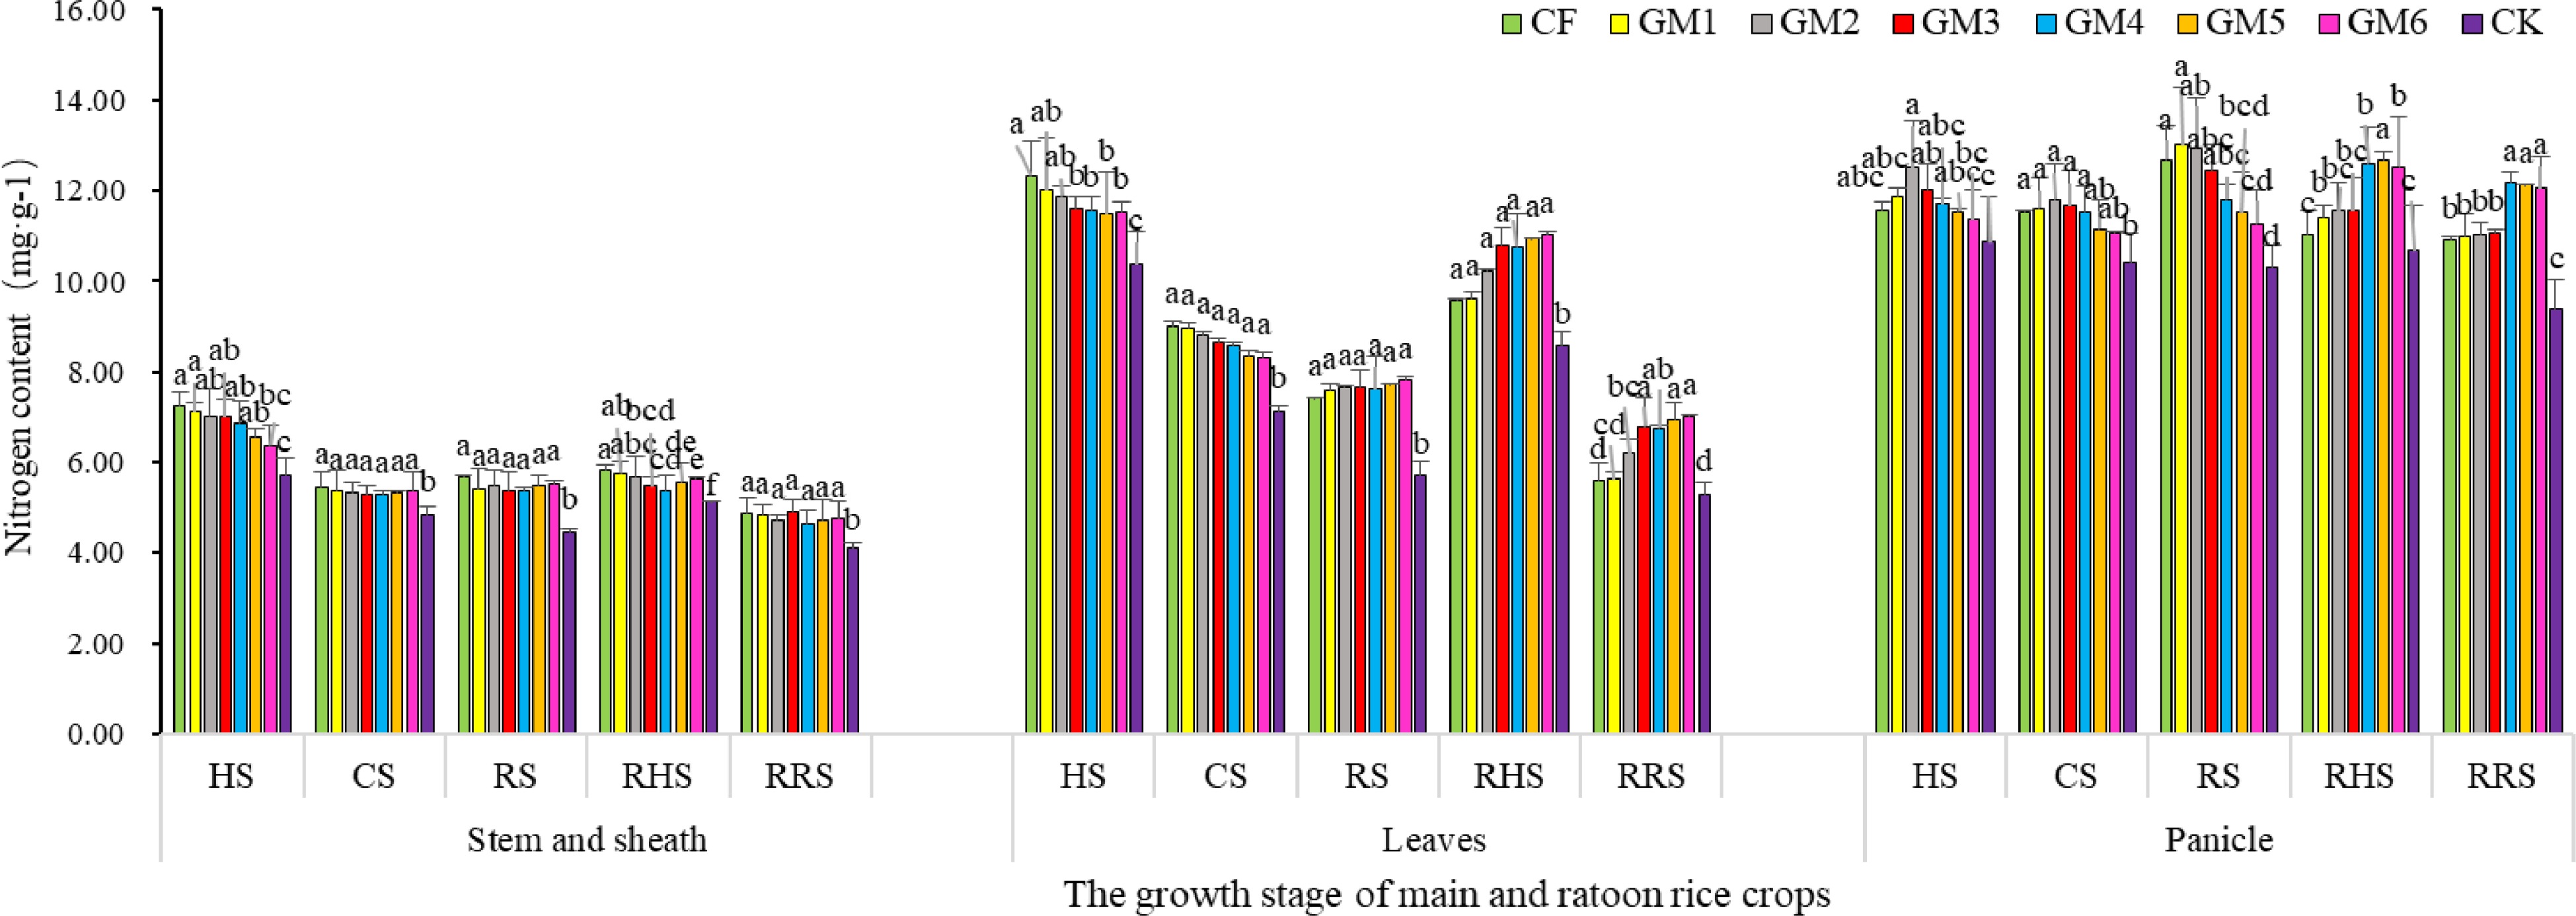
Figure 2.
Effect of treatment with different ratios of organic and inorganic fertilizers on nitrogen content in various parts in different periods of main and ratoon rice crops at various phases of grain-filling. Note: Different lower case letters indicate significant differences in p < 0.05 level between different treatments in the same part and the same period. HS: fully heading stage, CS: the day close to the stage fertilizing for root-vigor preserving and bud promoting, RS: ripening stages of the main season crop, RHS: fully heading of ratooning season rice, RRS: ripening stages of ratooning season rice.
-
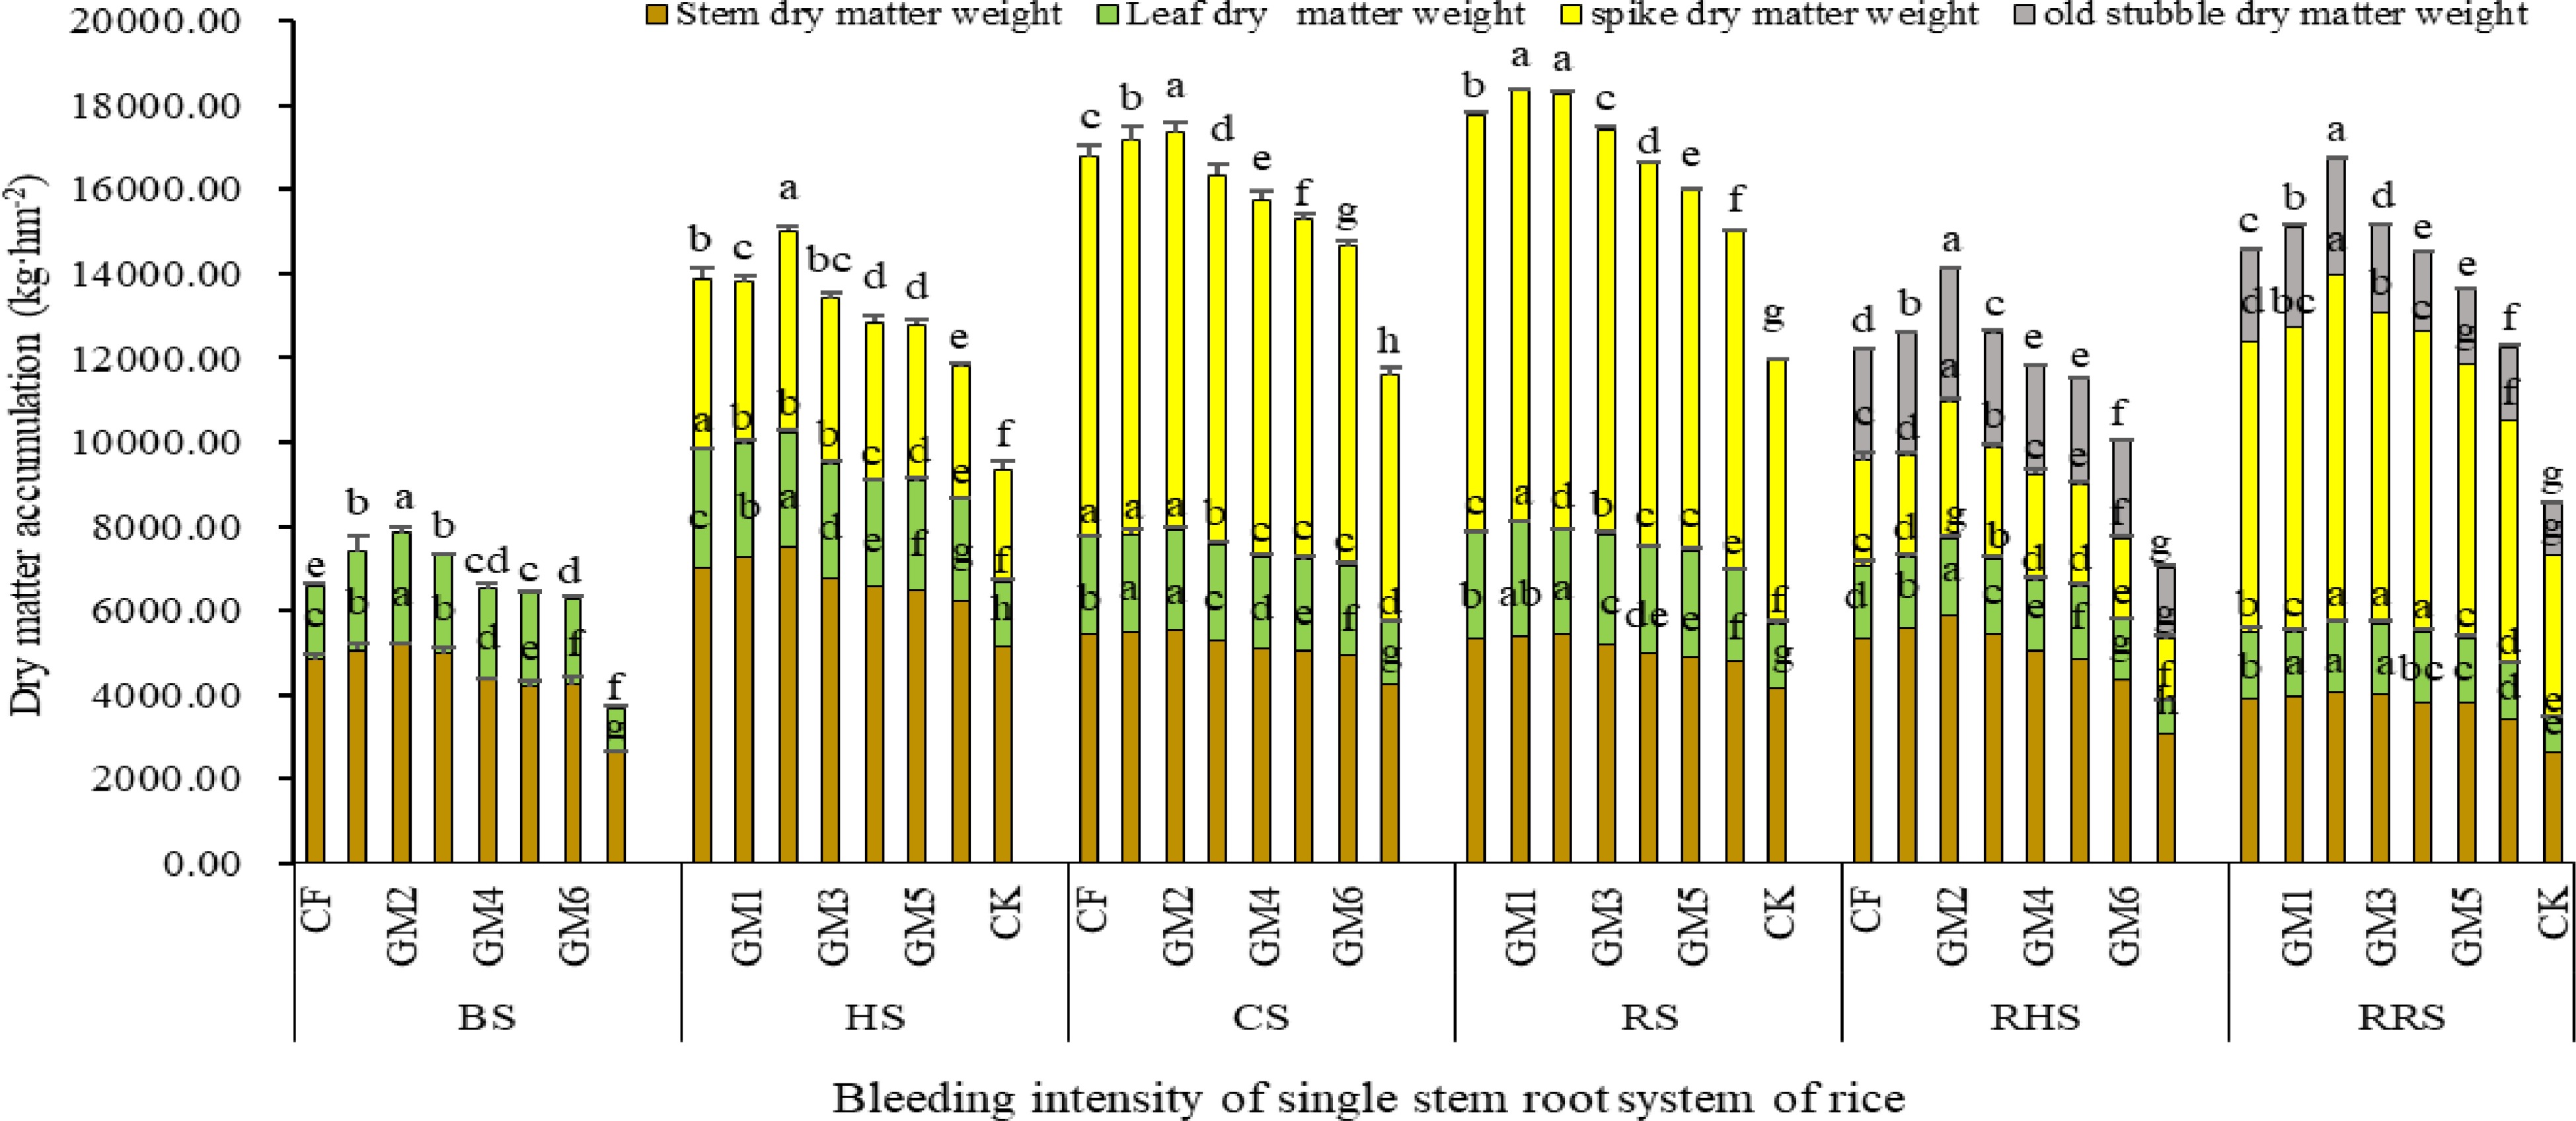
Figure 3.
Effect of combined application treatment with different ratios of organic and inorganic fertilizers on dry matter accumulation of ground rice plants. Note: Different lower case letters indicate significant differences in p < 0.05 level between different treatments in the same part and the same period. BS: booting, HS: fully heading stage, CS: the day close to the stage fertilizing for root-vigor preserving and bud promoting, RS: ripening stages of the main season crop, RHS: fully heading of ratooning season rice, RRS: ripening stages of ratooning season rice.
-
Stage Treatment SSWF (kg·hm−2) SSWM (kg·hm−2) PWM (kg·hm−2) DMAF (kg·hm−2) EPMSS (%) TPMSS (%) Maincrop CF 7025.43c 5342.27b 9903.15b 4026.62b 23.96c 16.99d GM1 7258.68b 5397.21ab 10250.41ab 3844.83c 25.64b 18.16b GM2 7518.68a 5436.57a 10380.56a 4778.16a 27.69a 20.05a GM3 6791.52d 5190.93c 9634.42c 3945.44b 23.57d 16.61d GM4 6575.77e 4997.32d 9108.53d 3772.75d 24.00c 17.33cd GM5 6471.57e 4915.14d 8583.96e 3740.11d 24.05c 18.13b GM6 6244.54f 4821.60e 8059.98f 3137.99e 22.78e 17.65c CK 5137.59g 4144.89f 6261.79g 2660.41f 19.32f 15.85e Ratoonrice CF 5340.86cd 3890.75c 6149.61d 2483.25cd 27.15bc 23.58b GM1 5567.44b 3971.67b 6544.57bc 2408.53e 28.66b 24.38ab GM2 5889.77a 4051.99a 7348.64a 3219.63a 31.20a 25.01a GM3 5440.62c 4009.24ab 6604.73b 2626.66b 26.3cd 21.67c GM4 5022.85d 3827.70d 6293.14c 2539.09c 23.79d 18.99d GM5 4861.61e 3789.66d 5783.45e 2435.55de 22.05e 18.53d GM6 4329.81f 3417.23e 5169.39f 1916.51f 21.07f 17.65de CK 3047.31g 2649.84f 3539.34g 1441.24g 13.04g 11.23f SSWH: Stem-sheath dry matter weight in full-heading stage; SSWM: Stem-sheath dry matter weight in mature stage; PWM: Panicle dry matter weight in mature stage; DMAH: Dry-matter accumulation after full-heading stage; DMAH: Dry-matter accumulation after full-heading stage; EPMSS: exportation rate of stem-sheath dry matter; TPMSS: Translocation rate of stem-sheath dry matter. Table 1.
Effects of different ratios of organic fertilizers and chemical fertilizers on dry matter accumulation and transport during filling stage.
-
Treatments The main crop The ratooning rice MTY
(kg·hm−2)RTY
(kg·hm−2)TTY
(kg·hm−2)MPH
(cm)RPH
(cm)MHI RHI MGD
(days)RGD
(days)NFPP (kg/kg) NAUE
(%)PENU
(kg/kg)NAUE
(kg/kg)NCRF
(%)EP
(104·hm−2)GN TGW
(g)SSP
(%)EP
(104·hm−2)GN TGW
(g)SSP
(%)CF 264.16b 205.24a 22.63a 87.57b 330.60bc 108.55c 21.61a 89.18ab 10750.68bc 6901.61cd 17528.21bc 135a 85a 0.46a 0.51a 142.00 70.00 43.22c 33.71d 41.94c 18.07c 41.80c GM1 267.49b 203.49ab 22.71ab 88.23ab 338.70bc 110.50b 21.65a 90.06ab 10914.32b 7287.35bc 18118.53b 135a 95b 0.49b 0.55b 142.00 72.00 44.82b 41.83b 44.00b 19.67b 43.89b GM2 282.64a 201.69bc 22.69ab 89.52a 356.10a 115.08a 21.47ab 90.66a 11600.46a 7970.31a 19342.97a 140b 95b 0.55c 0.61c 142.00 75.00 48.97a 44.37a 48.79a 23.82a 48.64a GM4 258.34c 194.59d 22.55ab 89.82a 328.66c 110.71b 21.66a 90.32ab 10145.36d 7103.01bc 17243.15c 135a 90c 0.43c 0.50a 148.00 78.00 42.57d 37.22c 40.44d 17.42d 40.92d GM5 247.61d 195.43d 22.63ab 89.56a 308.70d 111.71b 21.45a 90.64ab 9797.27e 6681.84d 16507.49d 135a 85a 0.41c 0.48d 150.00 78.00 40.64e 34.83d 35.98e 15.94e 38.12e GM6 240.58d 194.89cd 22.56ab 90.04a 295.53e 107.62c 21.51ab 90.93a 9486.38e 6234.12e 15722.10e 135a 85a 0.41c 0.45d 150.00 78.00 38.37f 32.17e 30.29f 13.22f 24.46f CK 186.48e 182.83e 22.38b 86.83ab 215.02f 99.52d 21.03b 88.12b 6688.71f 3751.59f 10715.73f − − − − − − − − − − − Year(A) NS NS NS NS NS NS NS NS NS NS NS − − − − − − − − − − − Fertilization
(B)32.43** 12.25** NS 2.34* 33.25** 11.51** NS NS 19.98** 76.13** 99.30** − − − − − − − − − − − A×B NS NS NS NS NS NS NS NS NS NS 163.80** − − − − − − − − − − − The comparison of differences is conducted to the average value of single factor effect and the interaction of double factor in the same column in the average of two year since no difference was found in two year results. The same letter after each data means that the difference is not significant, otherwise the difference is significant. Lower case letters represent significant level at < 5% and upper case letters represent significant level at < 1% , EP: effective panicles; GN: grain number per panicle; TGW: 1000-grain weight; SSP: seed setting percentage; MTY: theoretical yields of the main crop; RTY: theoretical yields of the ratoon rice; TTY: total theoretical yield; MPH: Plant height of the main crop; RPH: Plant height of ratooning rice; MHI: Harvest index of the main crop; RHI: Harvest index of ratooning rice; MGD: growth duration of the main crop; RGD: growth duration of ratooning rice; NFPP: Nitrogen fertilizer partial productivity; NAUE: nitrogen absorption and utilization efficiency; PENU: Physiological efficiency of nitrogen use; NAUE: Nitrogen agronomic use efficiency; NCRF: Nitrogen contribution rate of fertilizer. Table 2.
Comparison on the grain yield components and related physiological traits of the main and ratoon rice crops under combined application treatments with different proportions of organic and inorganic fertilizers.
Figures
(3)
Tables
(2)