-
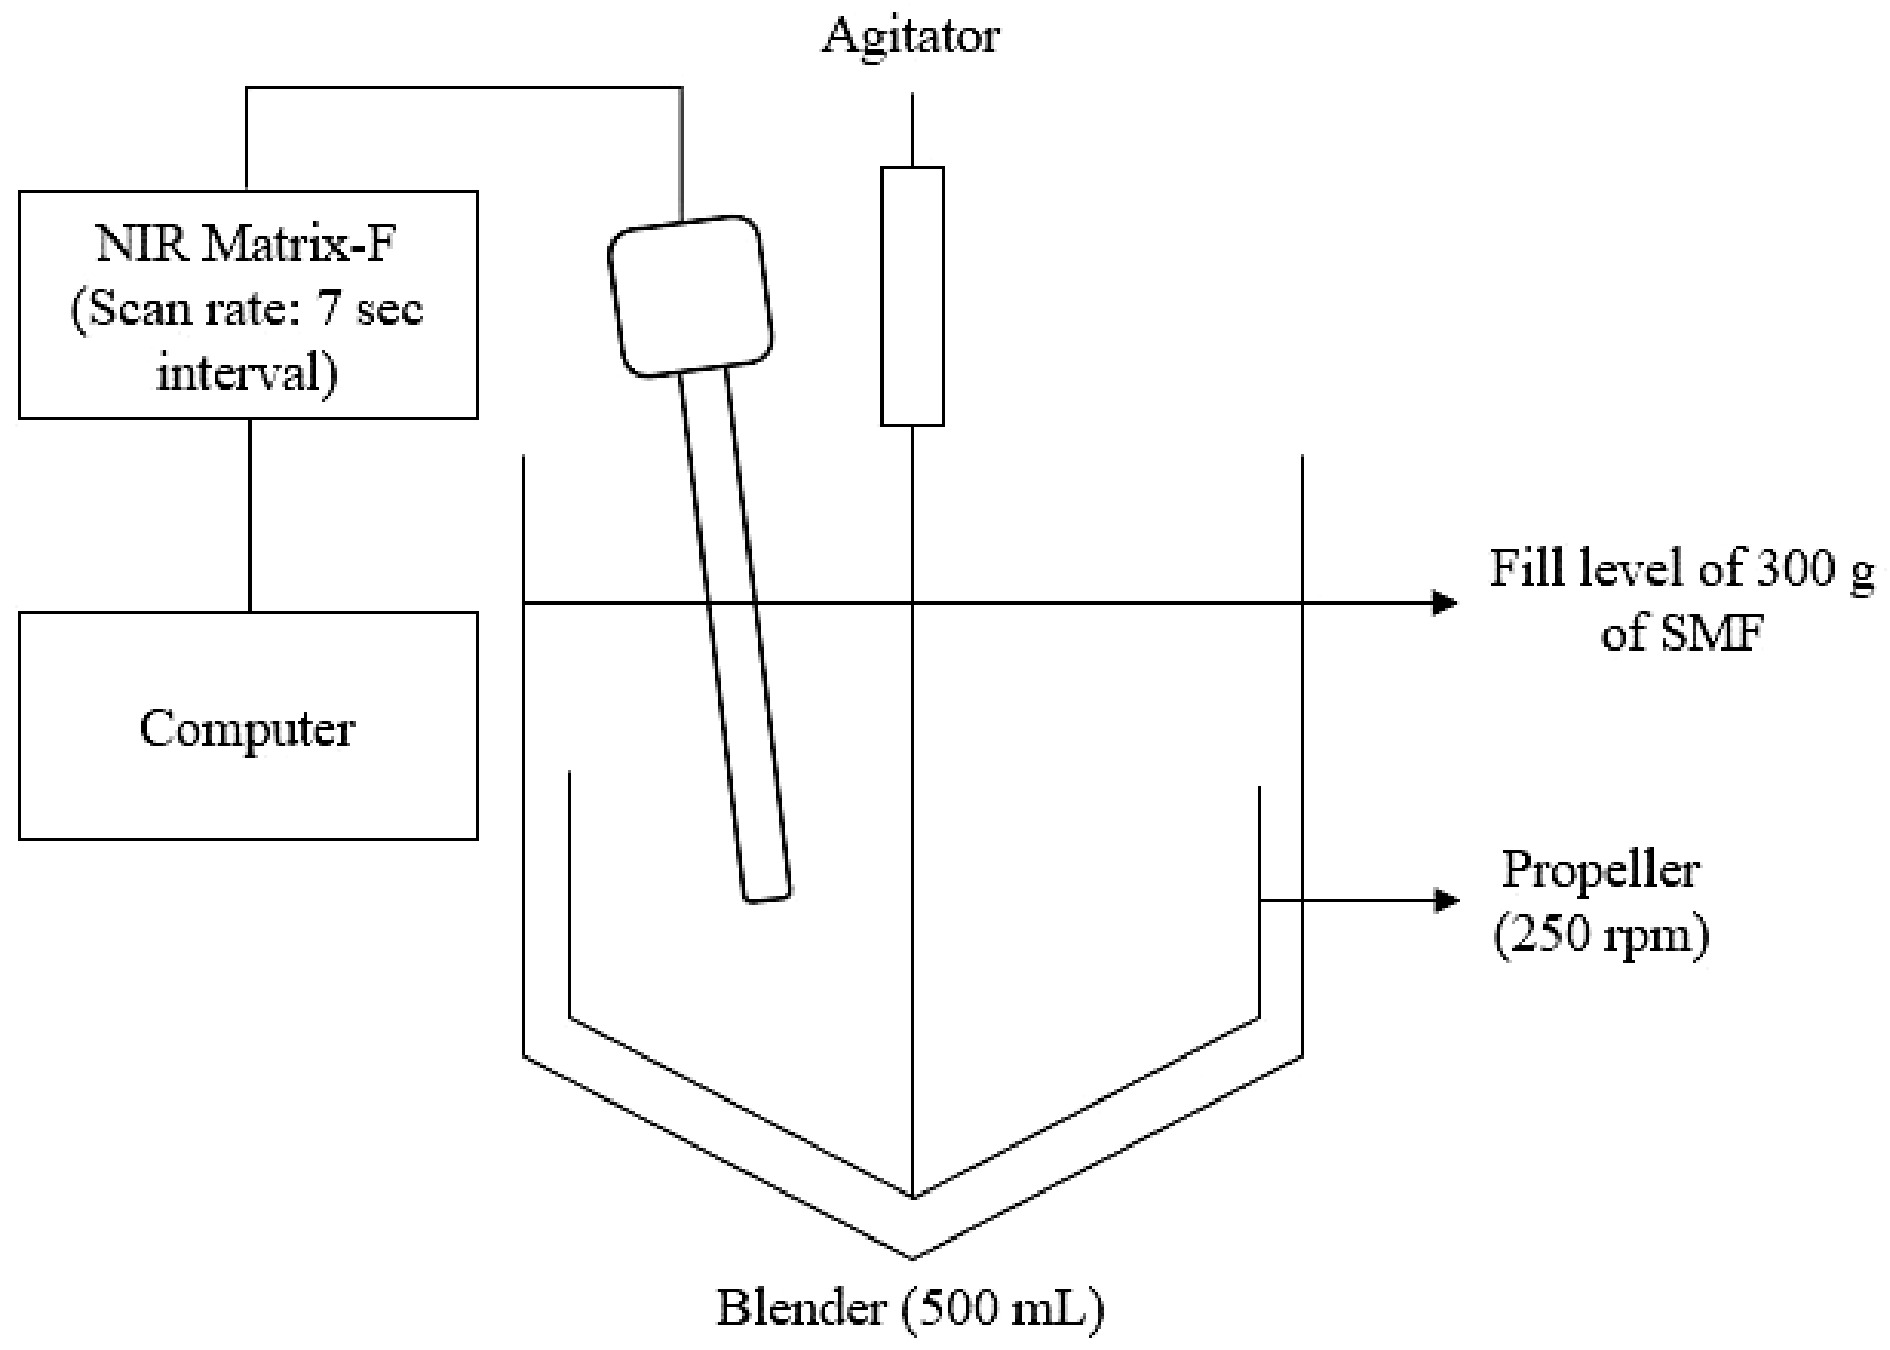
Figure 1.
The experimental set-up to monitor the SMF during the blending process.
-
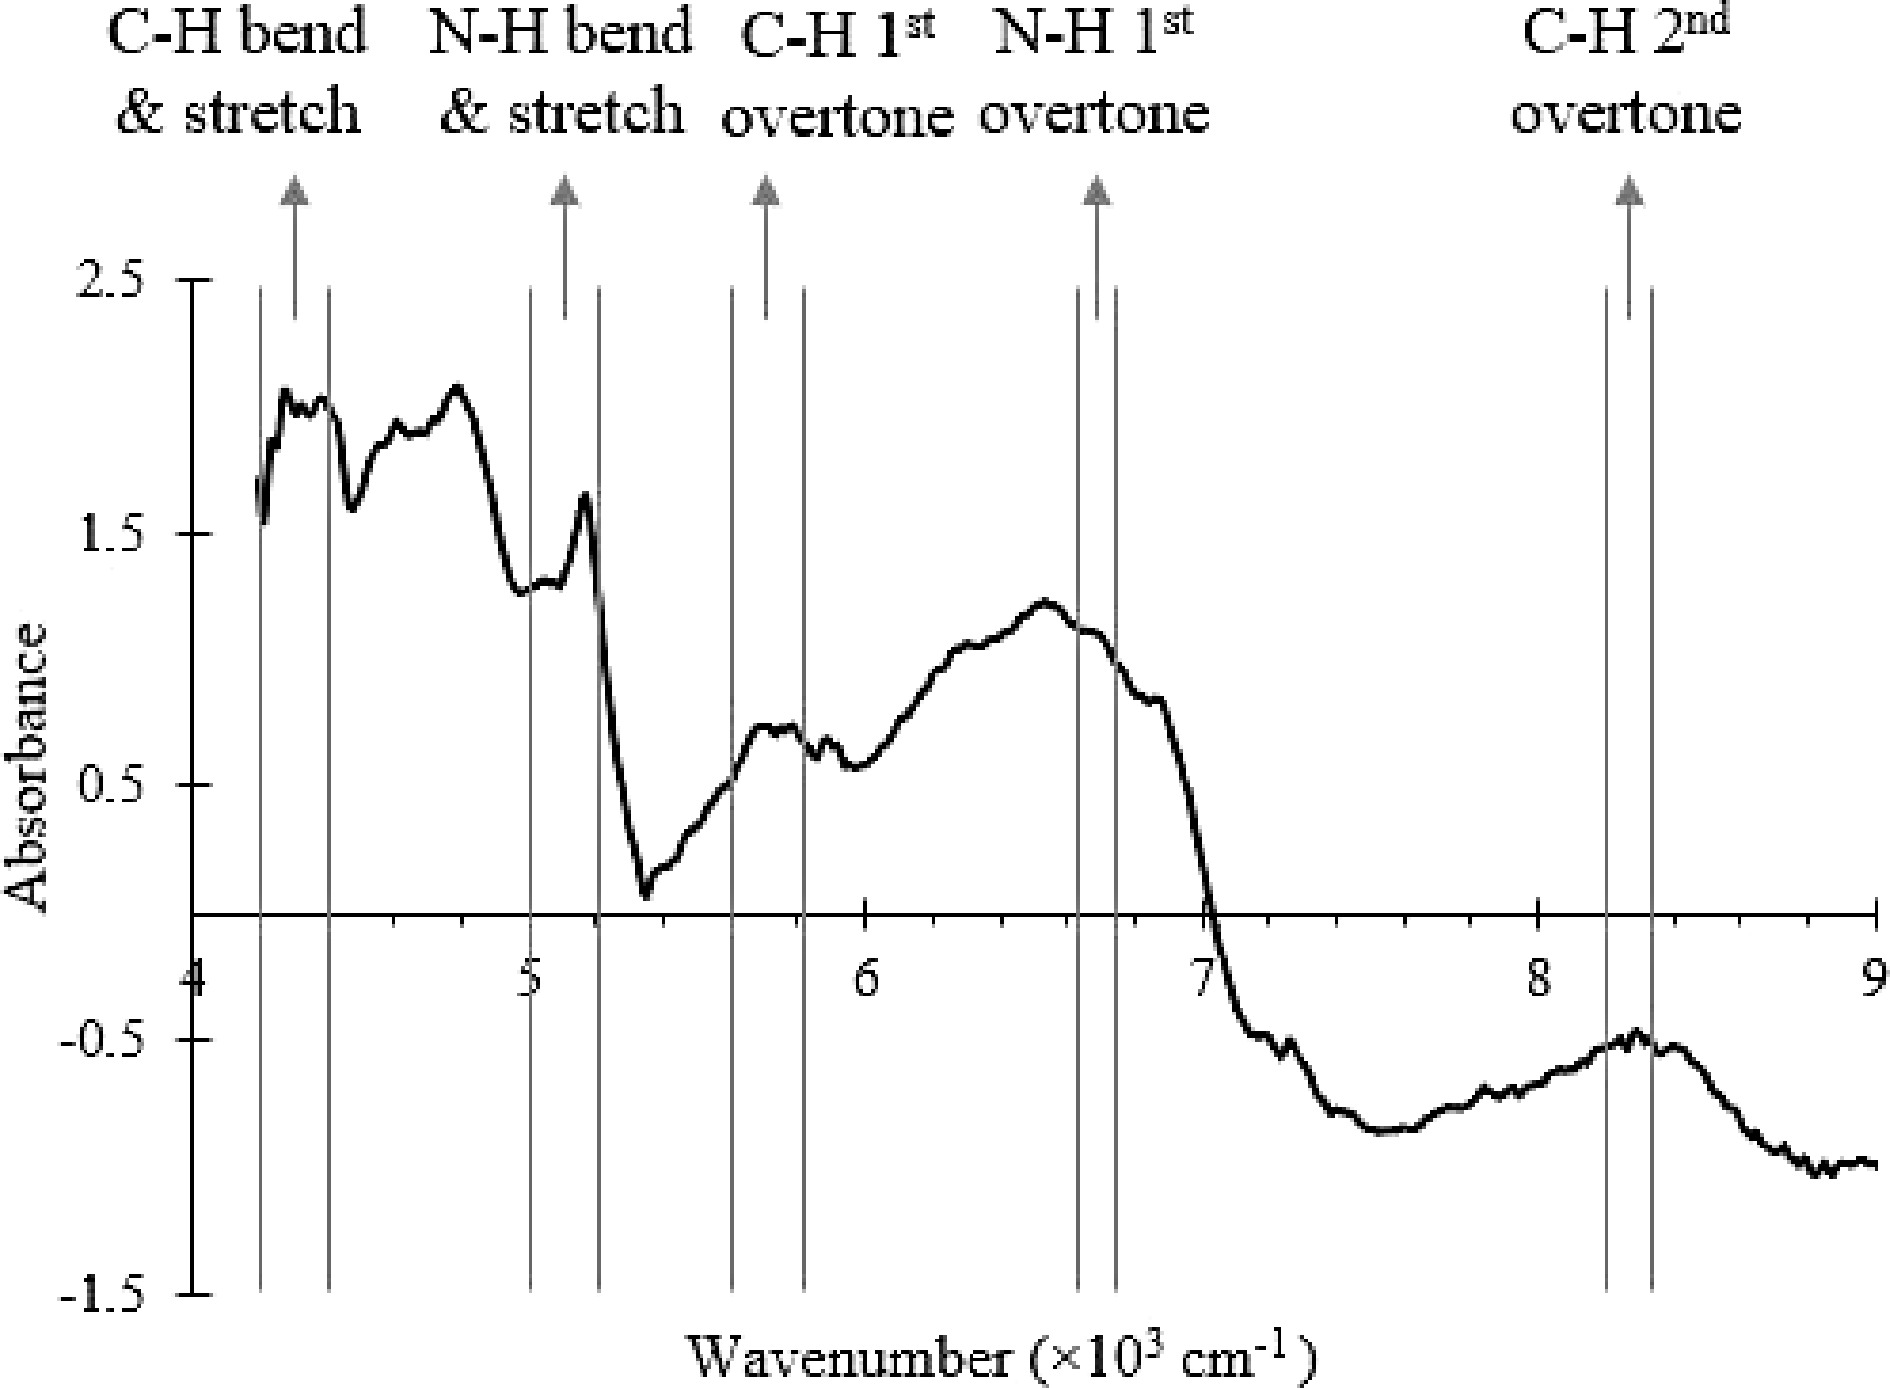
Figure 2.
NIR spectrum of the SMF with the wavenumber ranges that correspond to C-H, O-H and N-H bonds vibrational modes labelled.
-
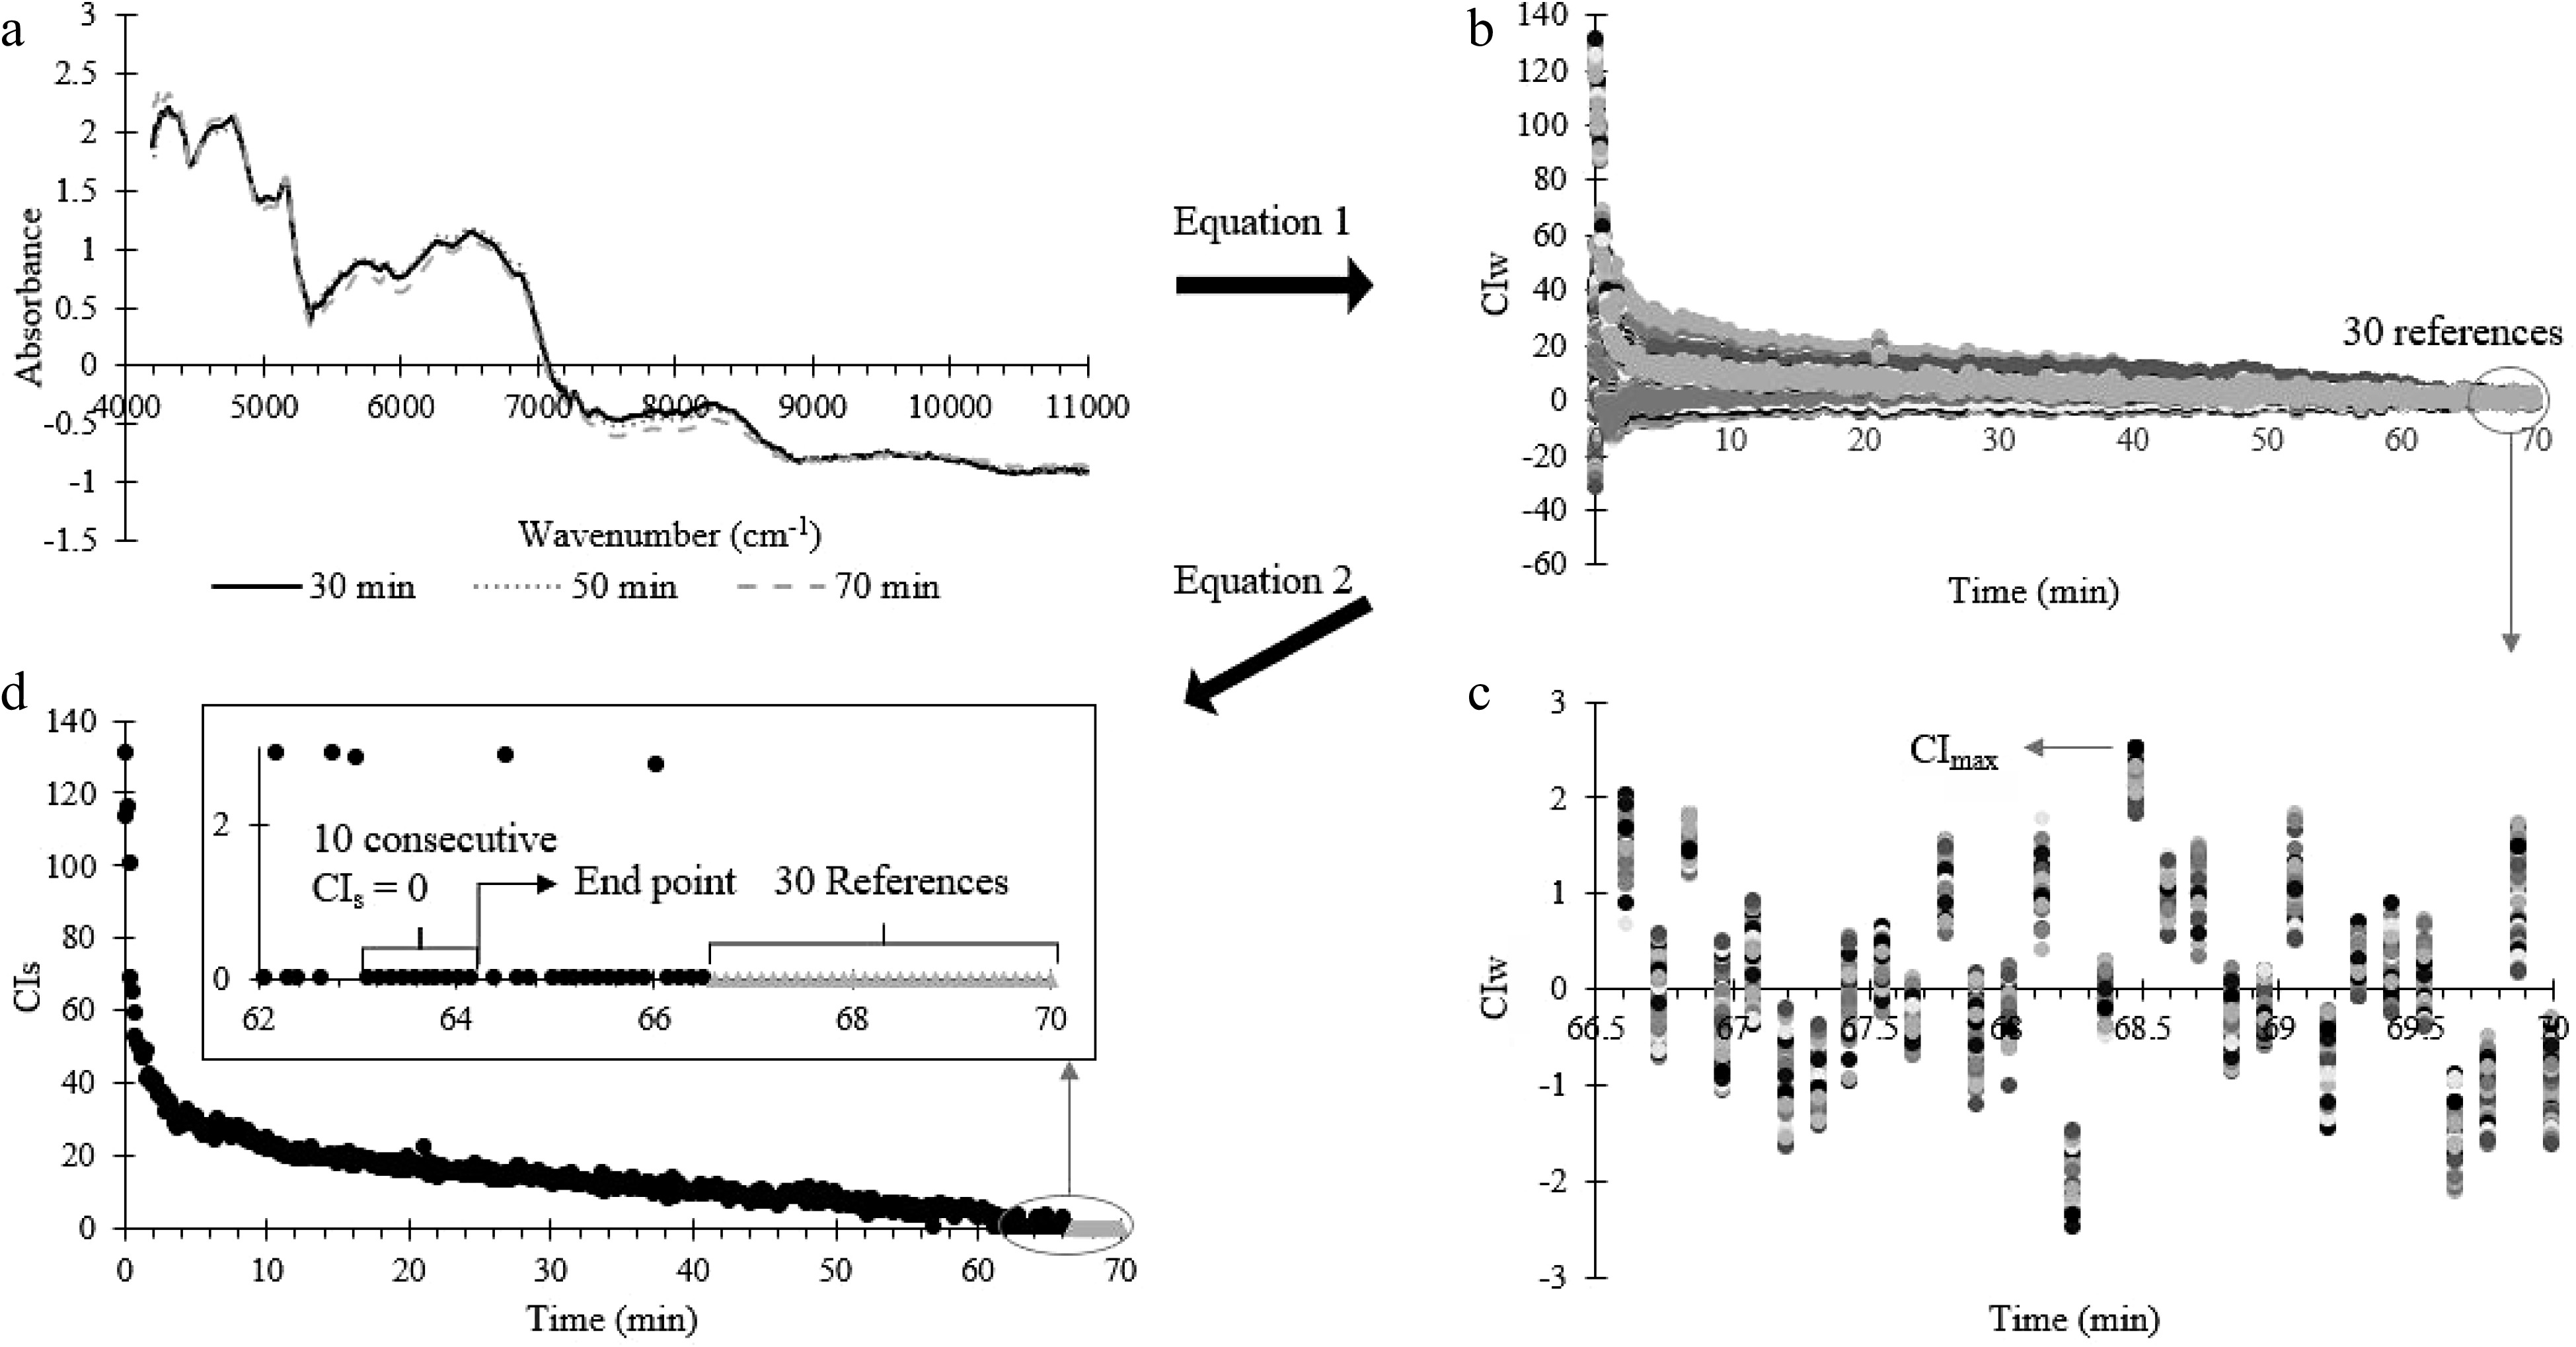
Figure 3.
Summary of the conformity index analysis process. (a) NIR spectrum (at 30, 50 and 70 min) processed by SNV. (b) CIw calculated from (a) at each blending time using Eqn 1. (c) The last 30 CIw for the last 30 reference spectrum (for uniformed powder). (d) Uniformity end point occurs when 10 consecutive CIs points are zero, where CIs were calculated using Eq. 2.
-
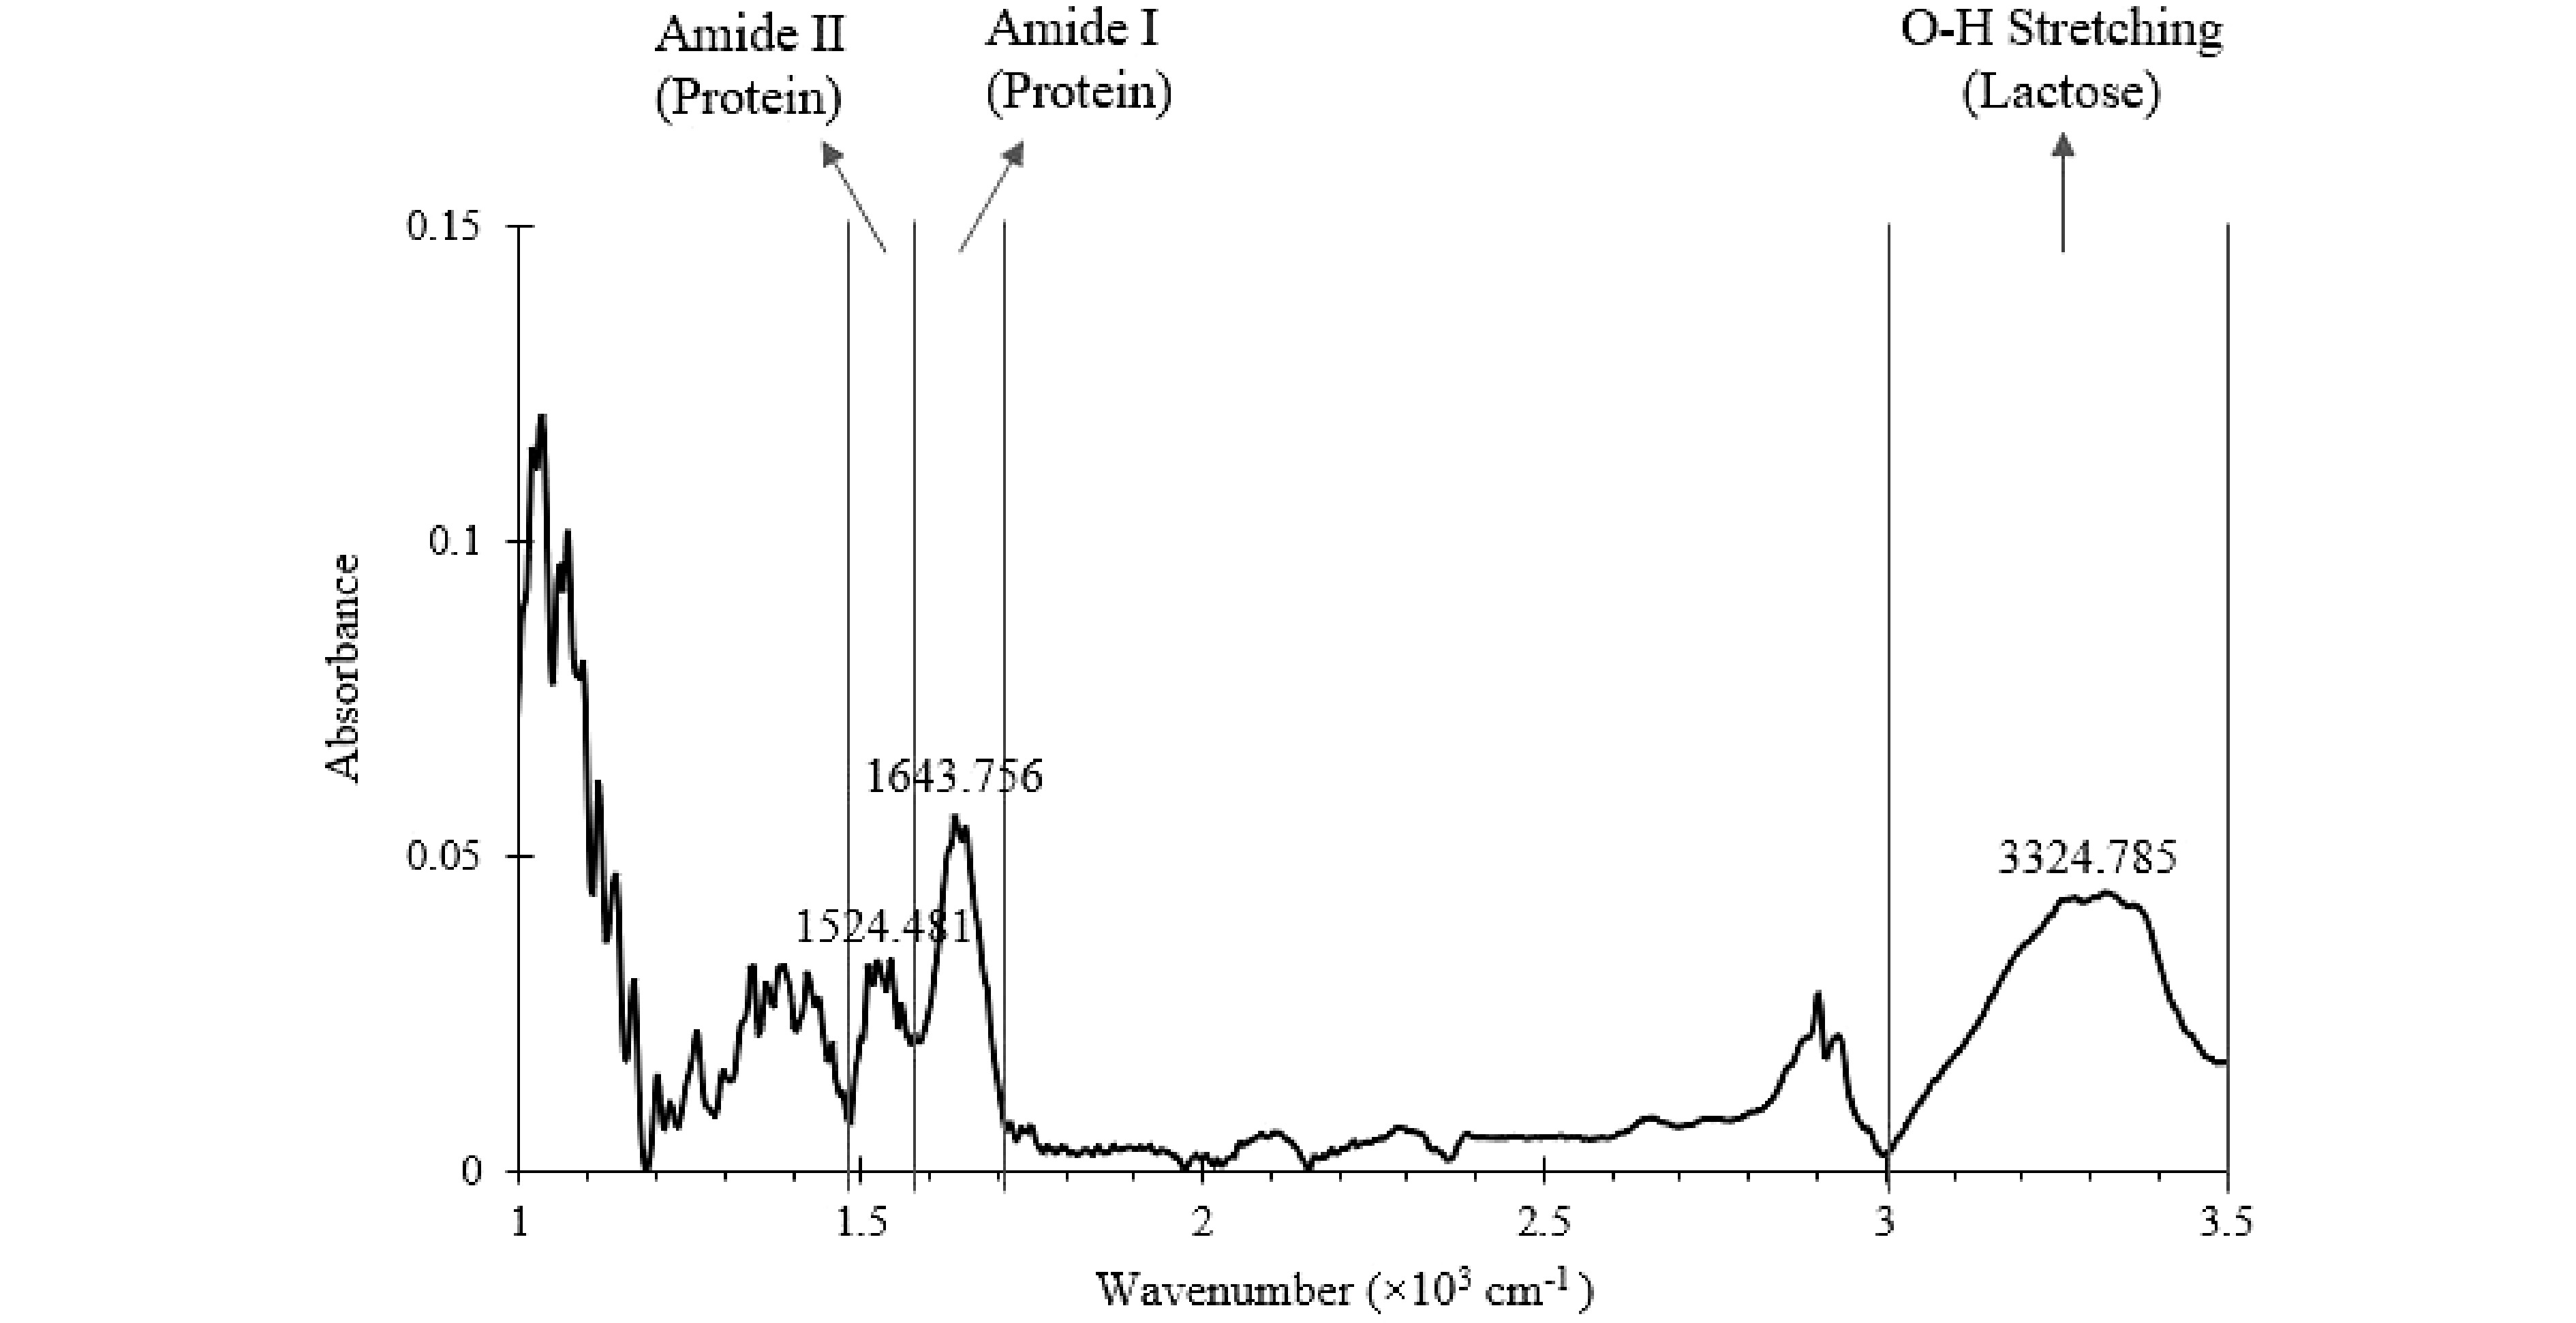
Figure 4.
Mid-Infrared spectrum of a well-mixed SMF (baseline corrected) generated from offline FTIR. The wavenumber ranges of key characteristic peaks are marked.
-
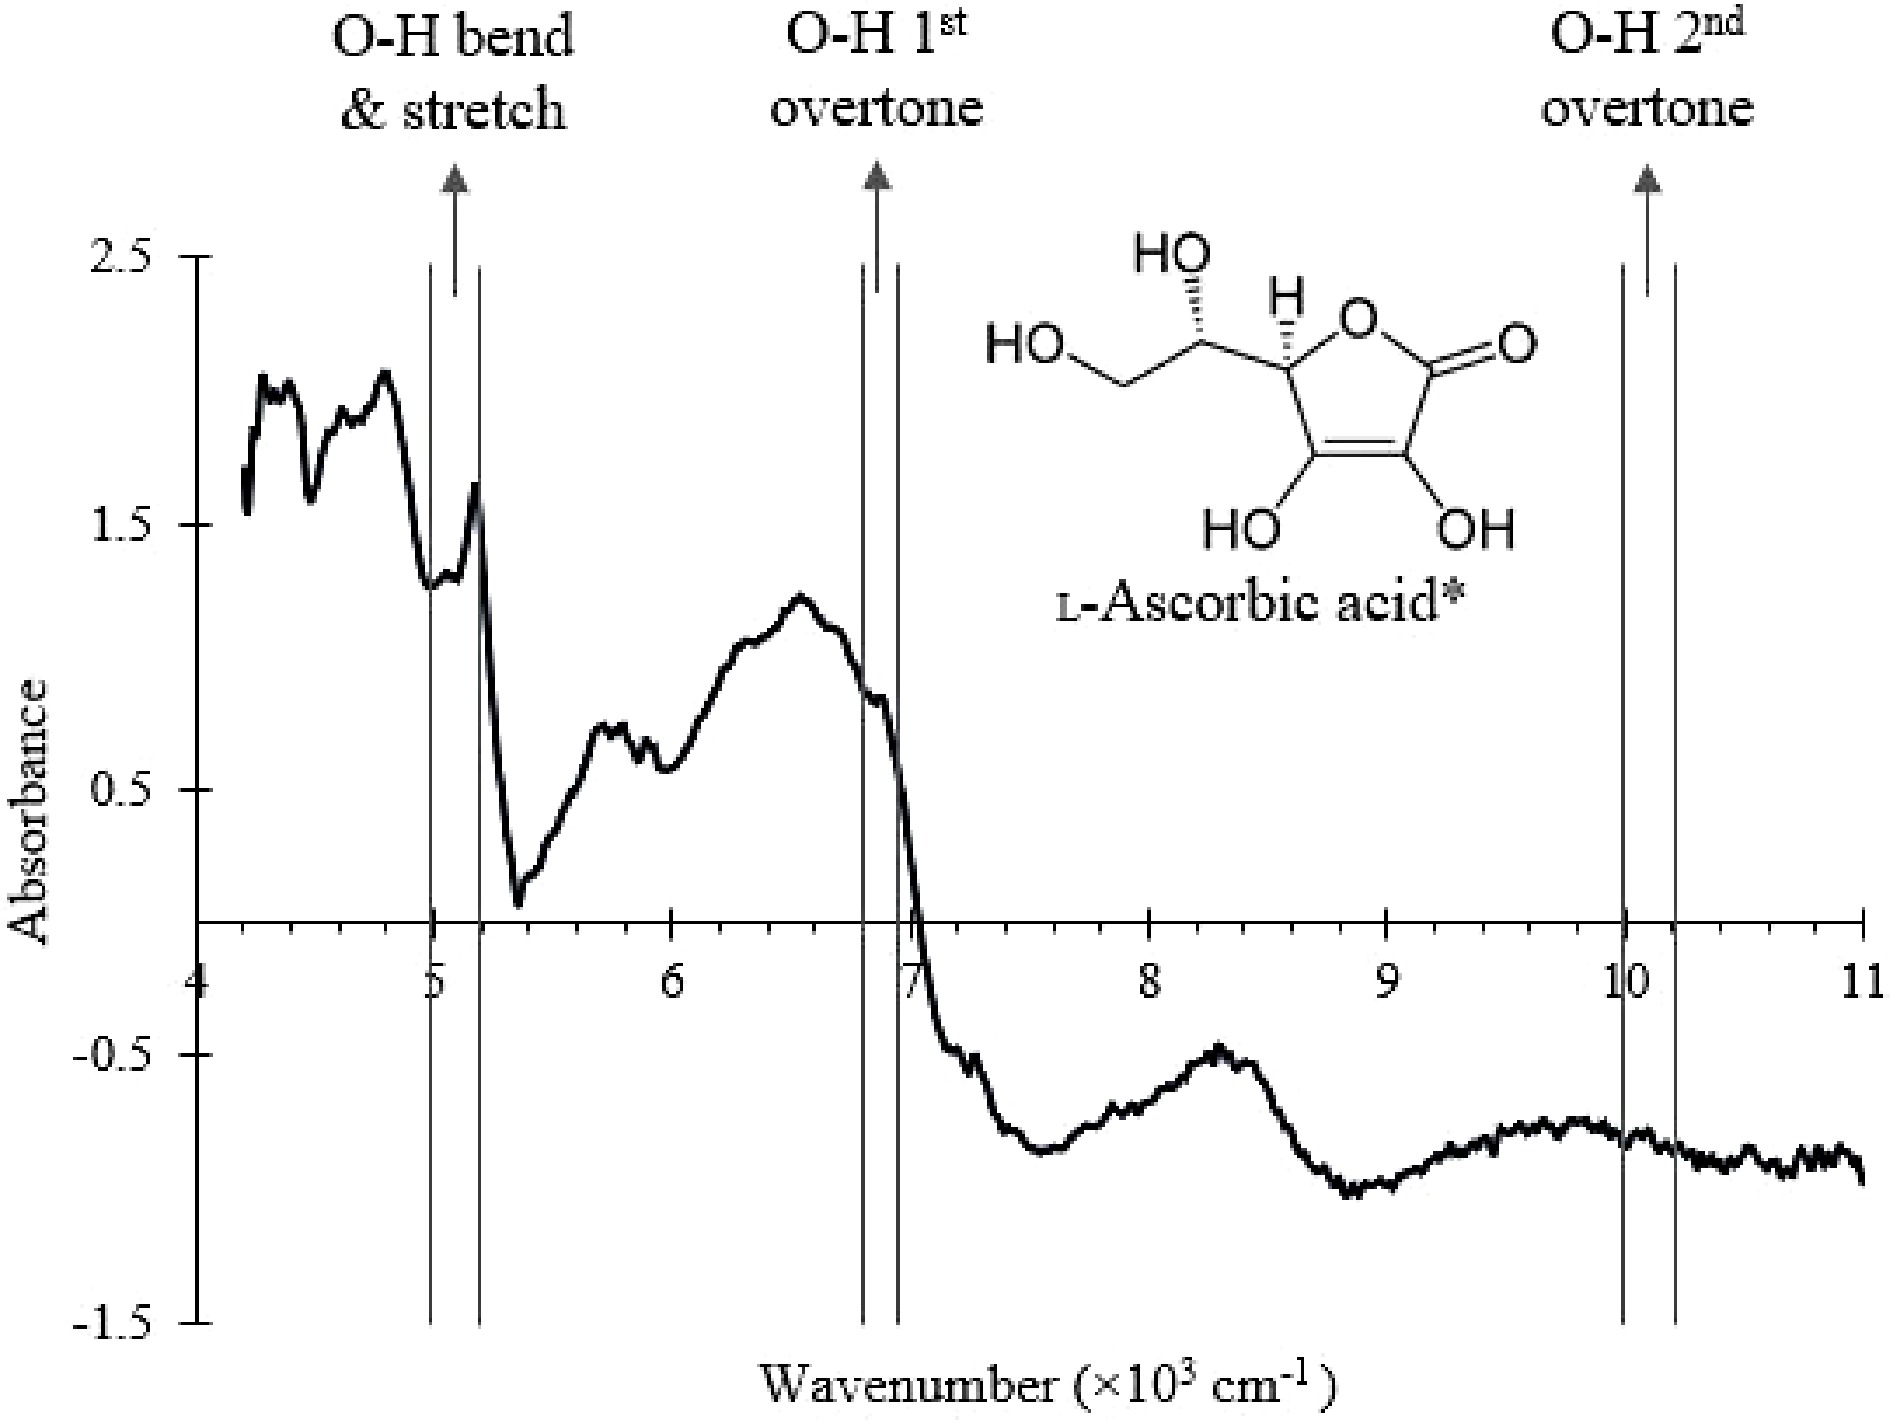
Figure 5.
NIR spectrum of the SMF with the wavenumber ranges that correspond to O-H bonds vibrational modes in ascorbic acid labelled.
-
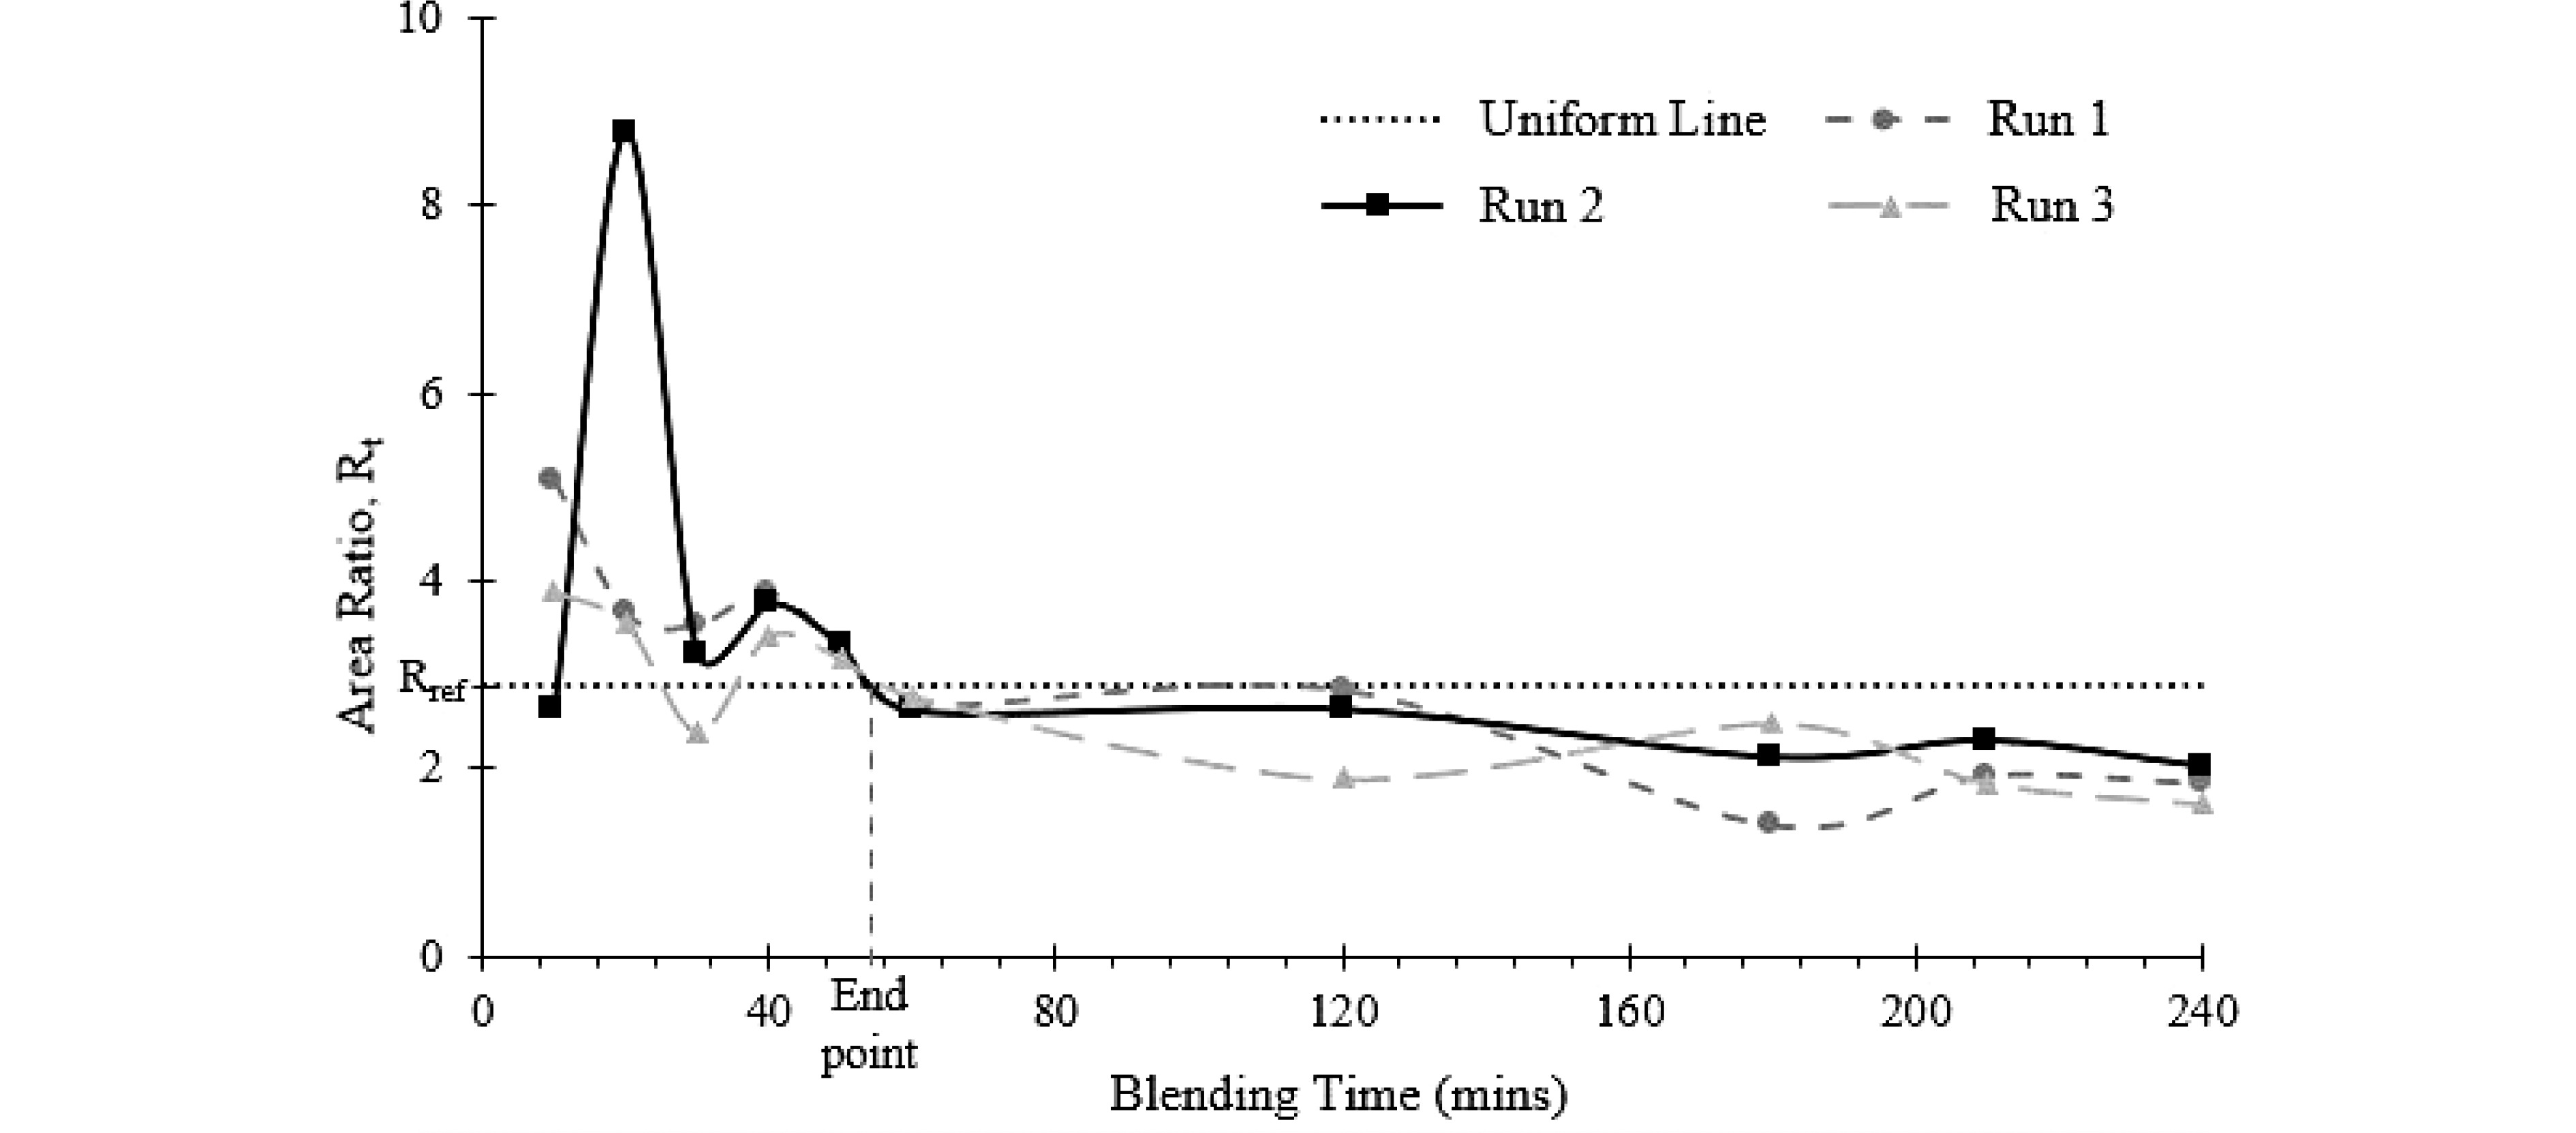
Figure 6.
Uniformity end point of the blending process determined from offline FTIR measurement. The uniformity end point is the time when Rt = Rref.
-
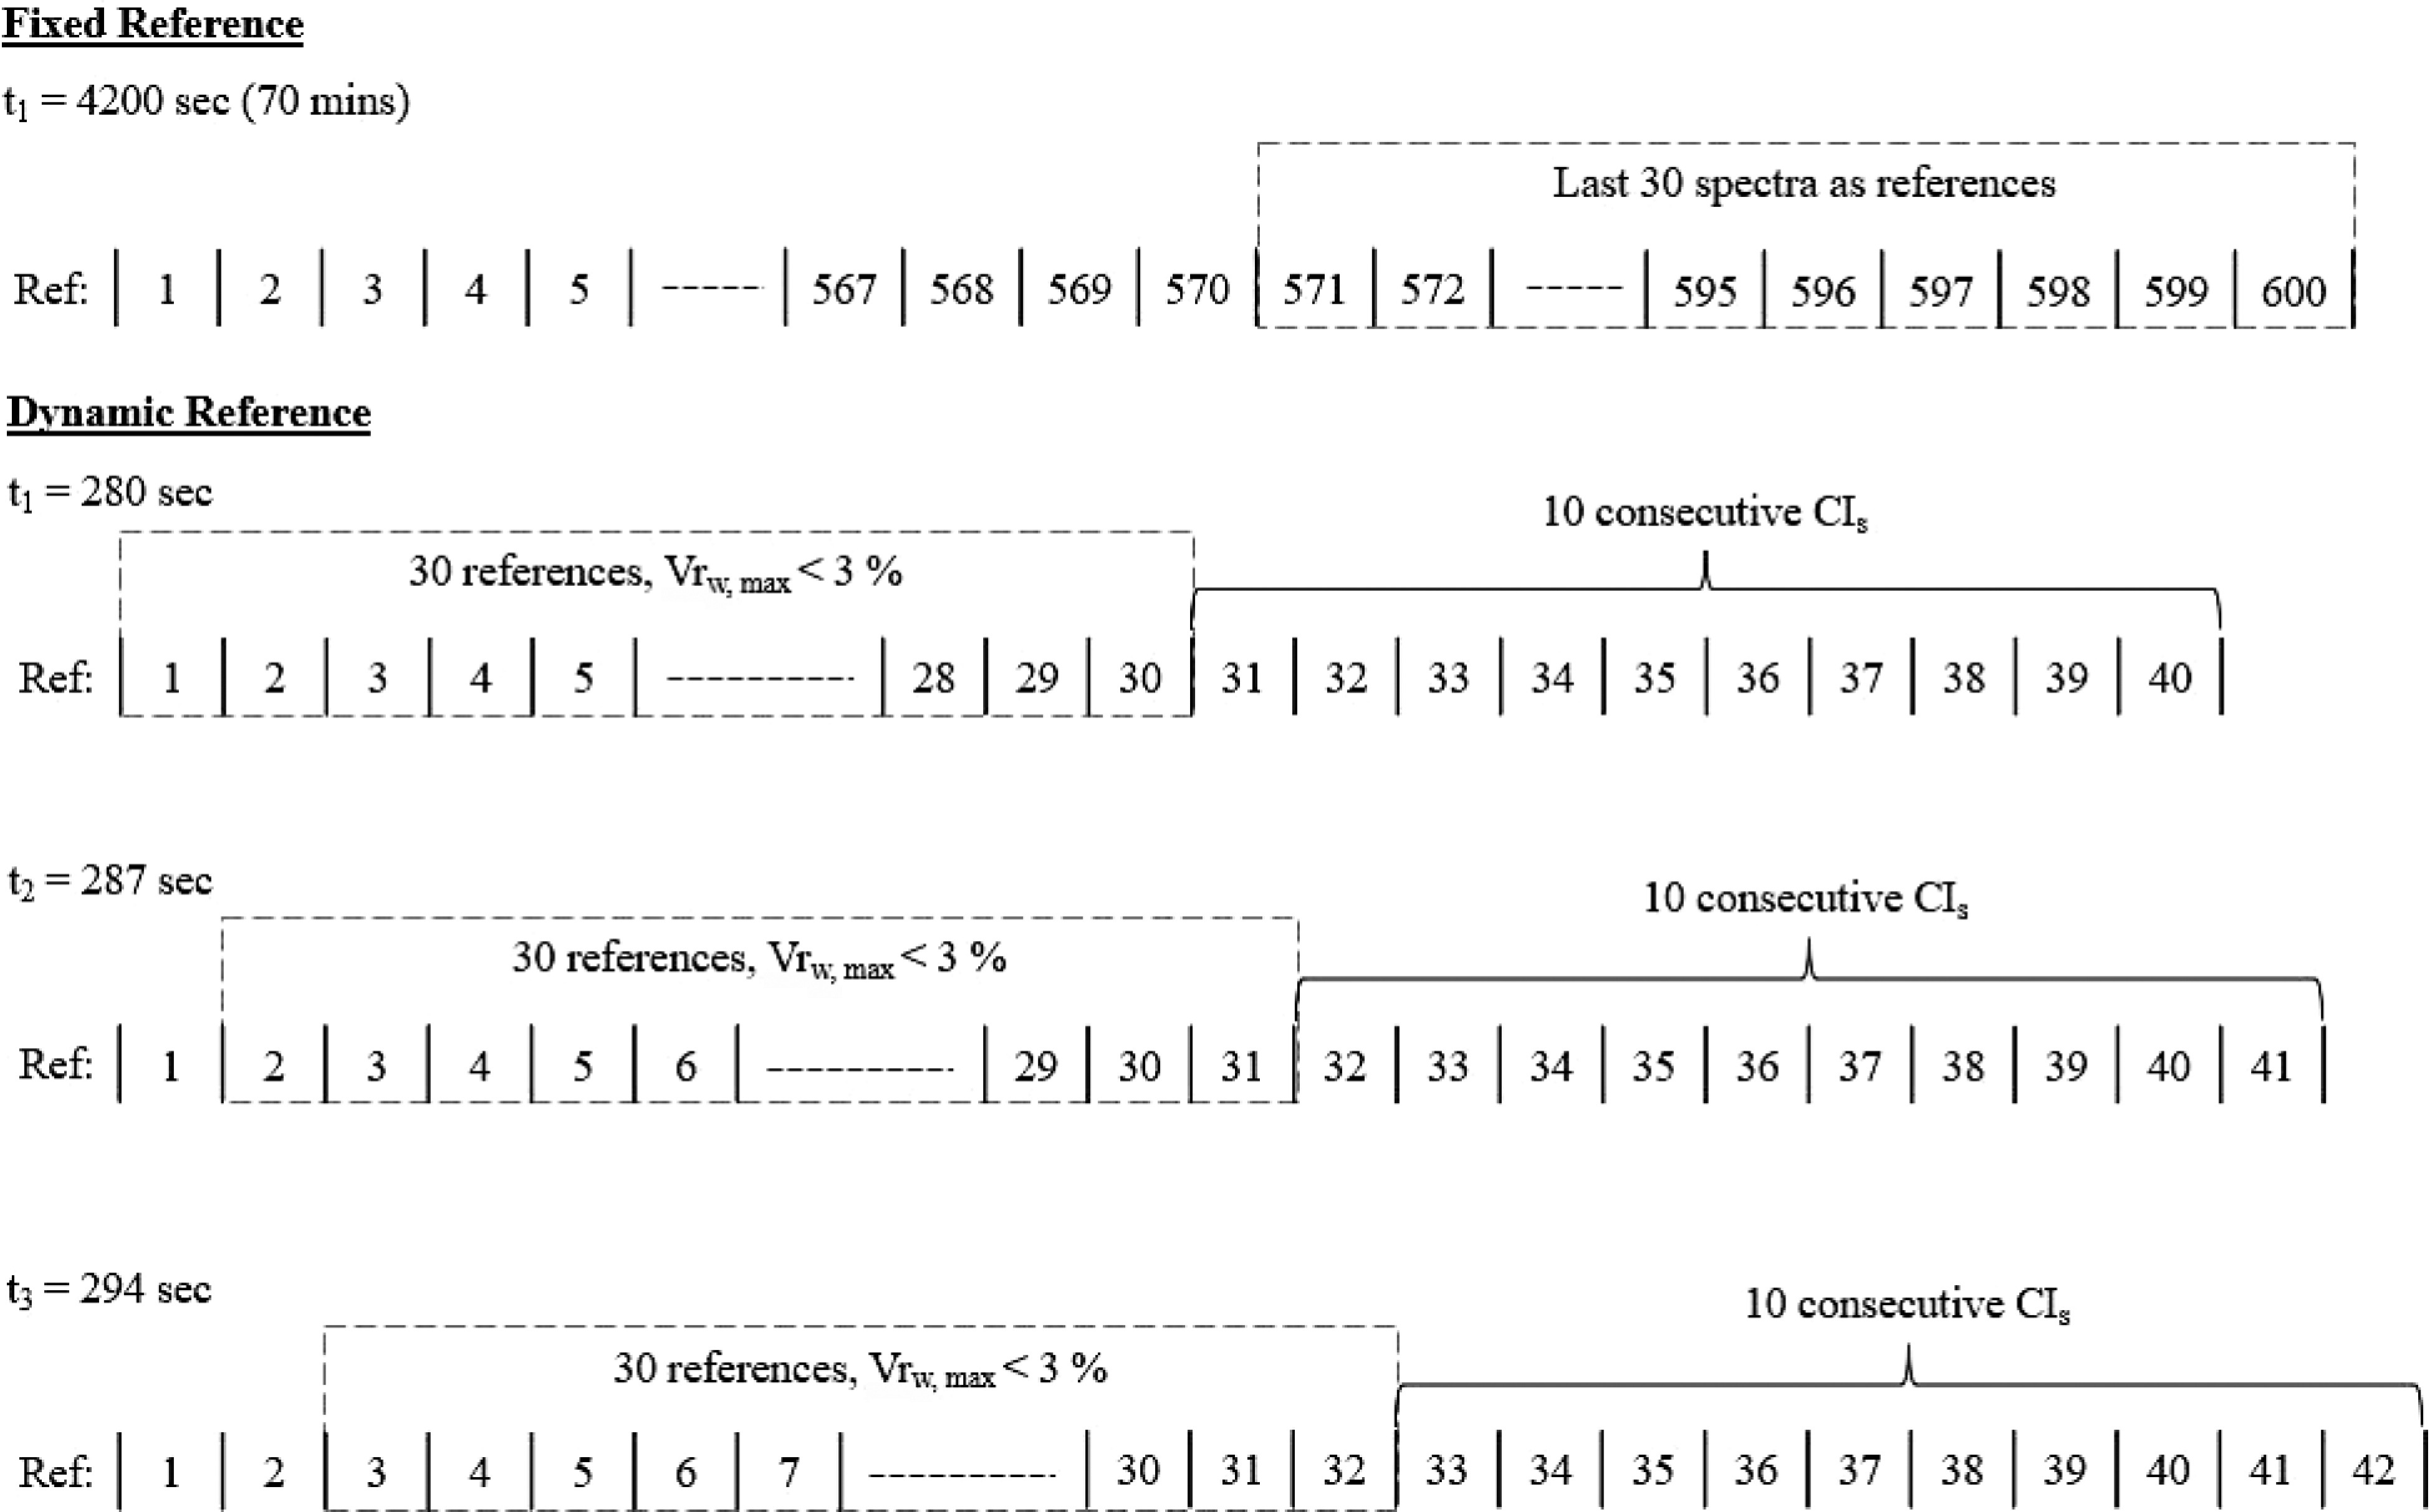
Figure 7.
Offline, fixed reference method vs. inline, dynamic reference method to determine uniformity end point.
-
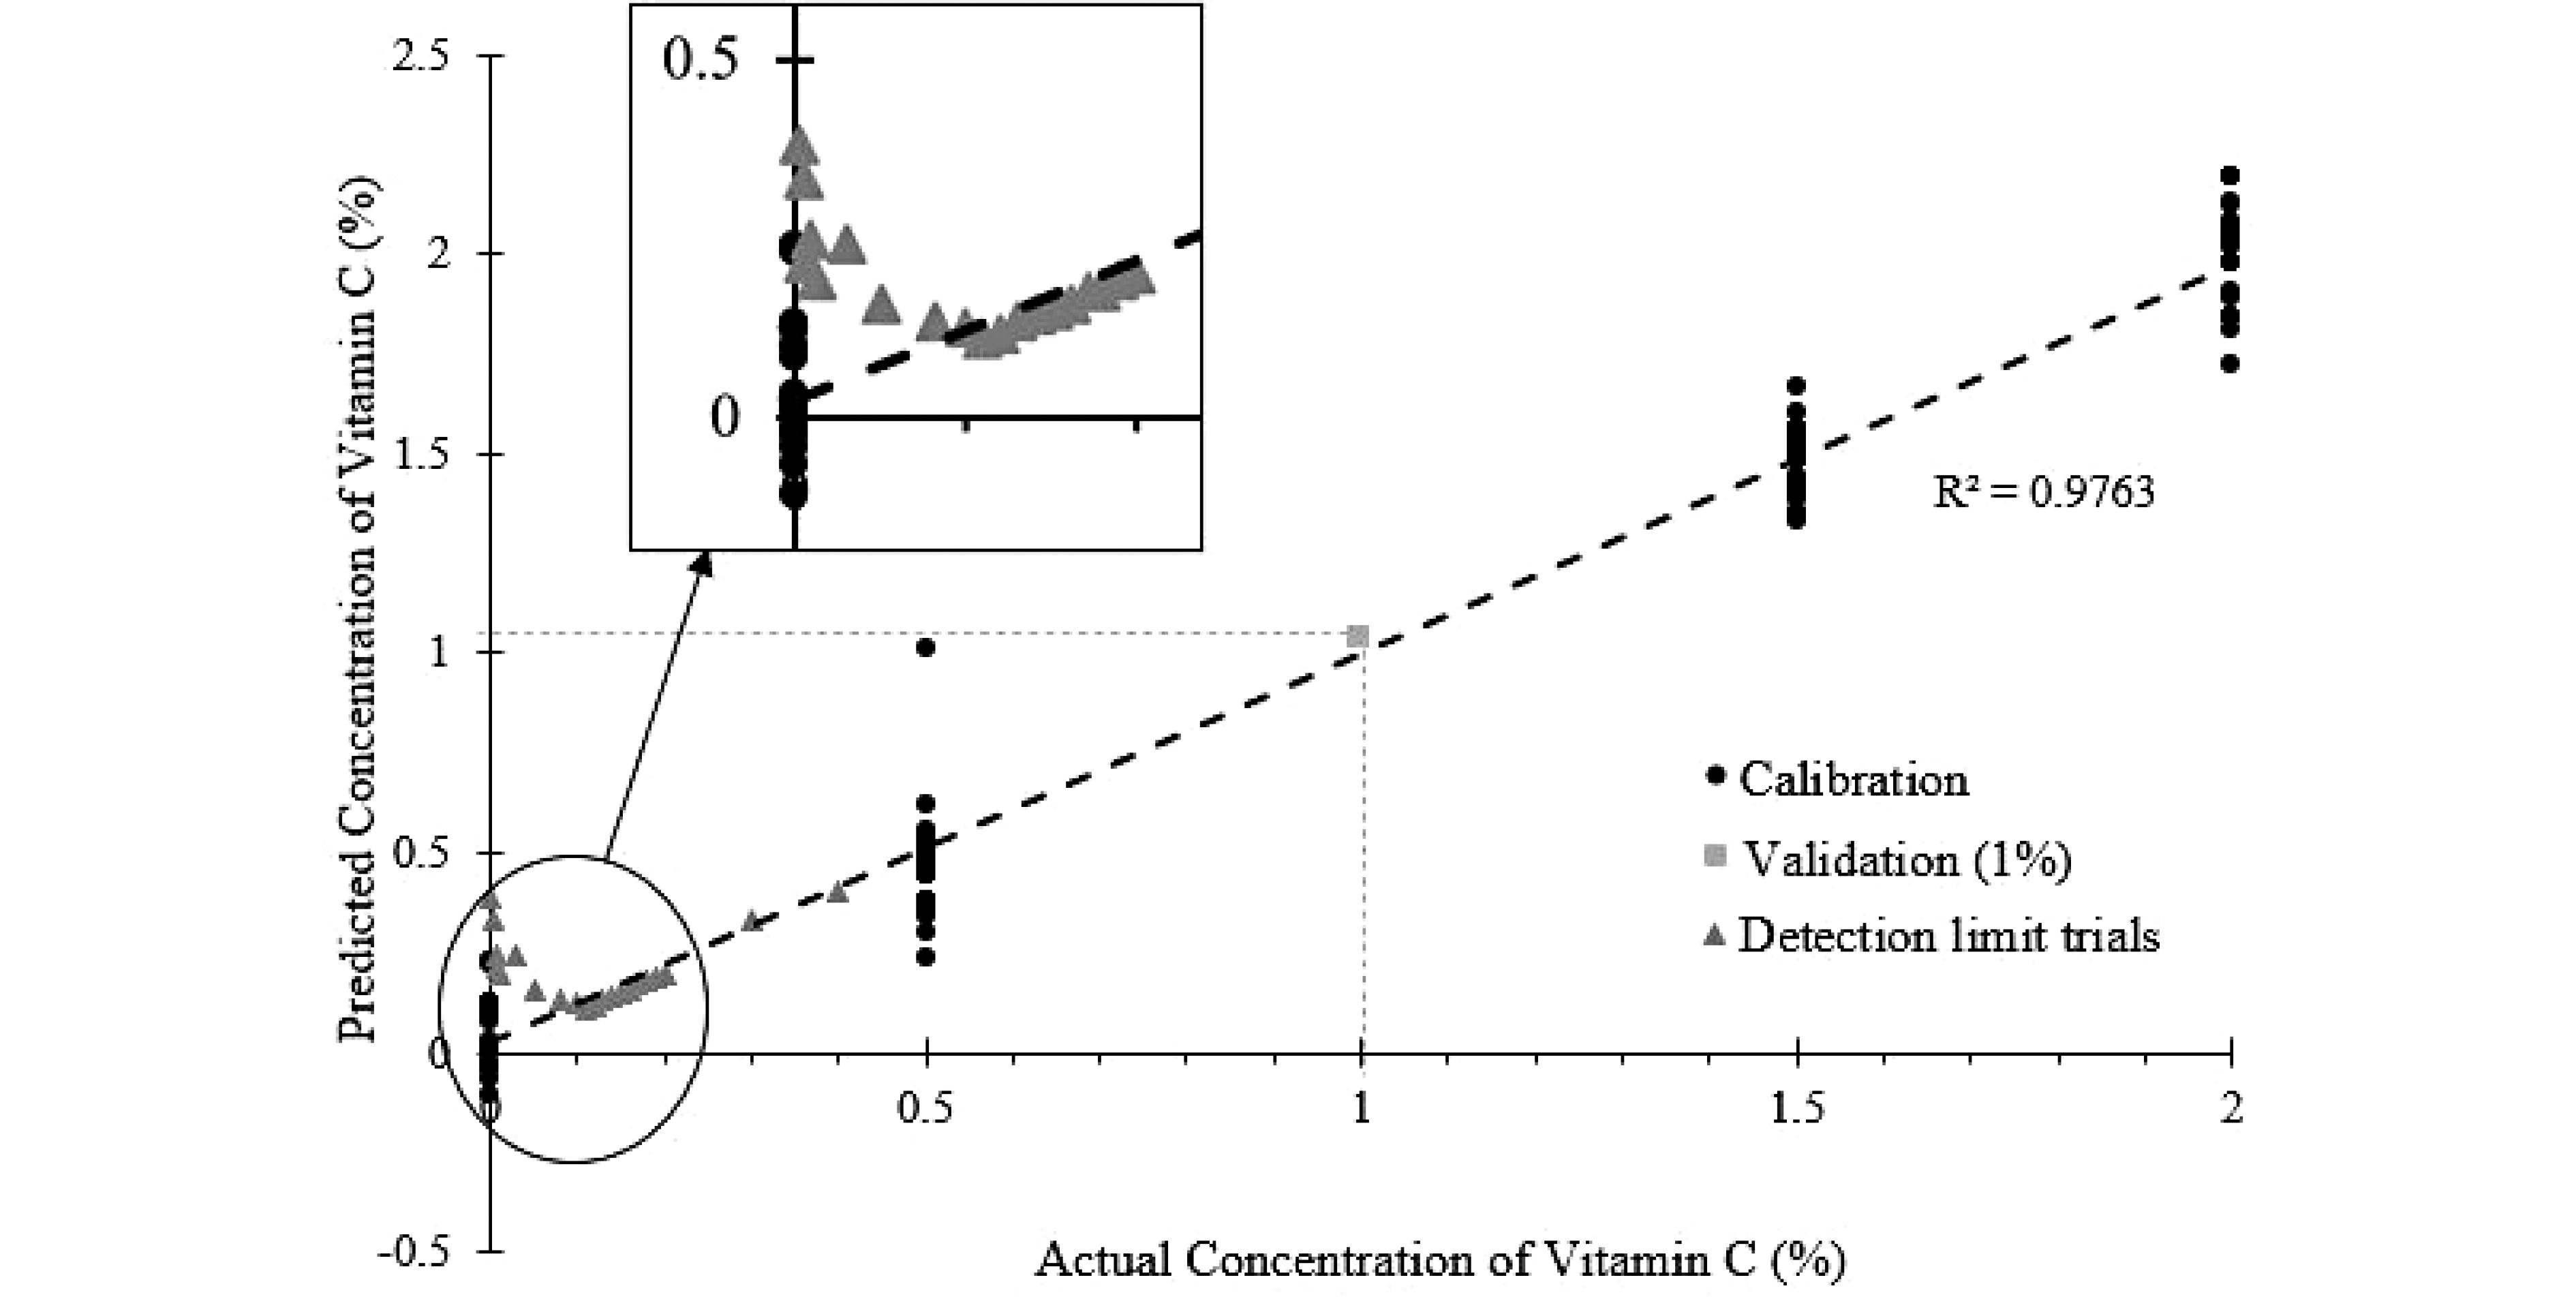
Figure 8.
PLSR model of predicted vitamin C concentration against the actual vitamin C concentration, with measurements at lower-level concentrations of vitamin C shown.
-
Test methods Uniformity end point (min) Run 1 Run 2 Run 3 Average ± SD Fixed reference 61.72 65.80 64.17 63.89 ± 2.06 FTIR area ratio (interpolated) 56.3 56.1 57.4 56.6 ± 0.71 Dynamic reference 56.93 66.03 66.03 63.00 ± 5. 25 Table 1.
The uniformity end point predicted from fixed/dynamic reference conformity test and FTIR area ratio for three experimental runs using SMF.
Figures
(8)
Tables
(1)