-
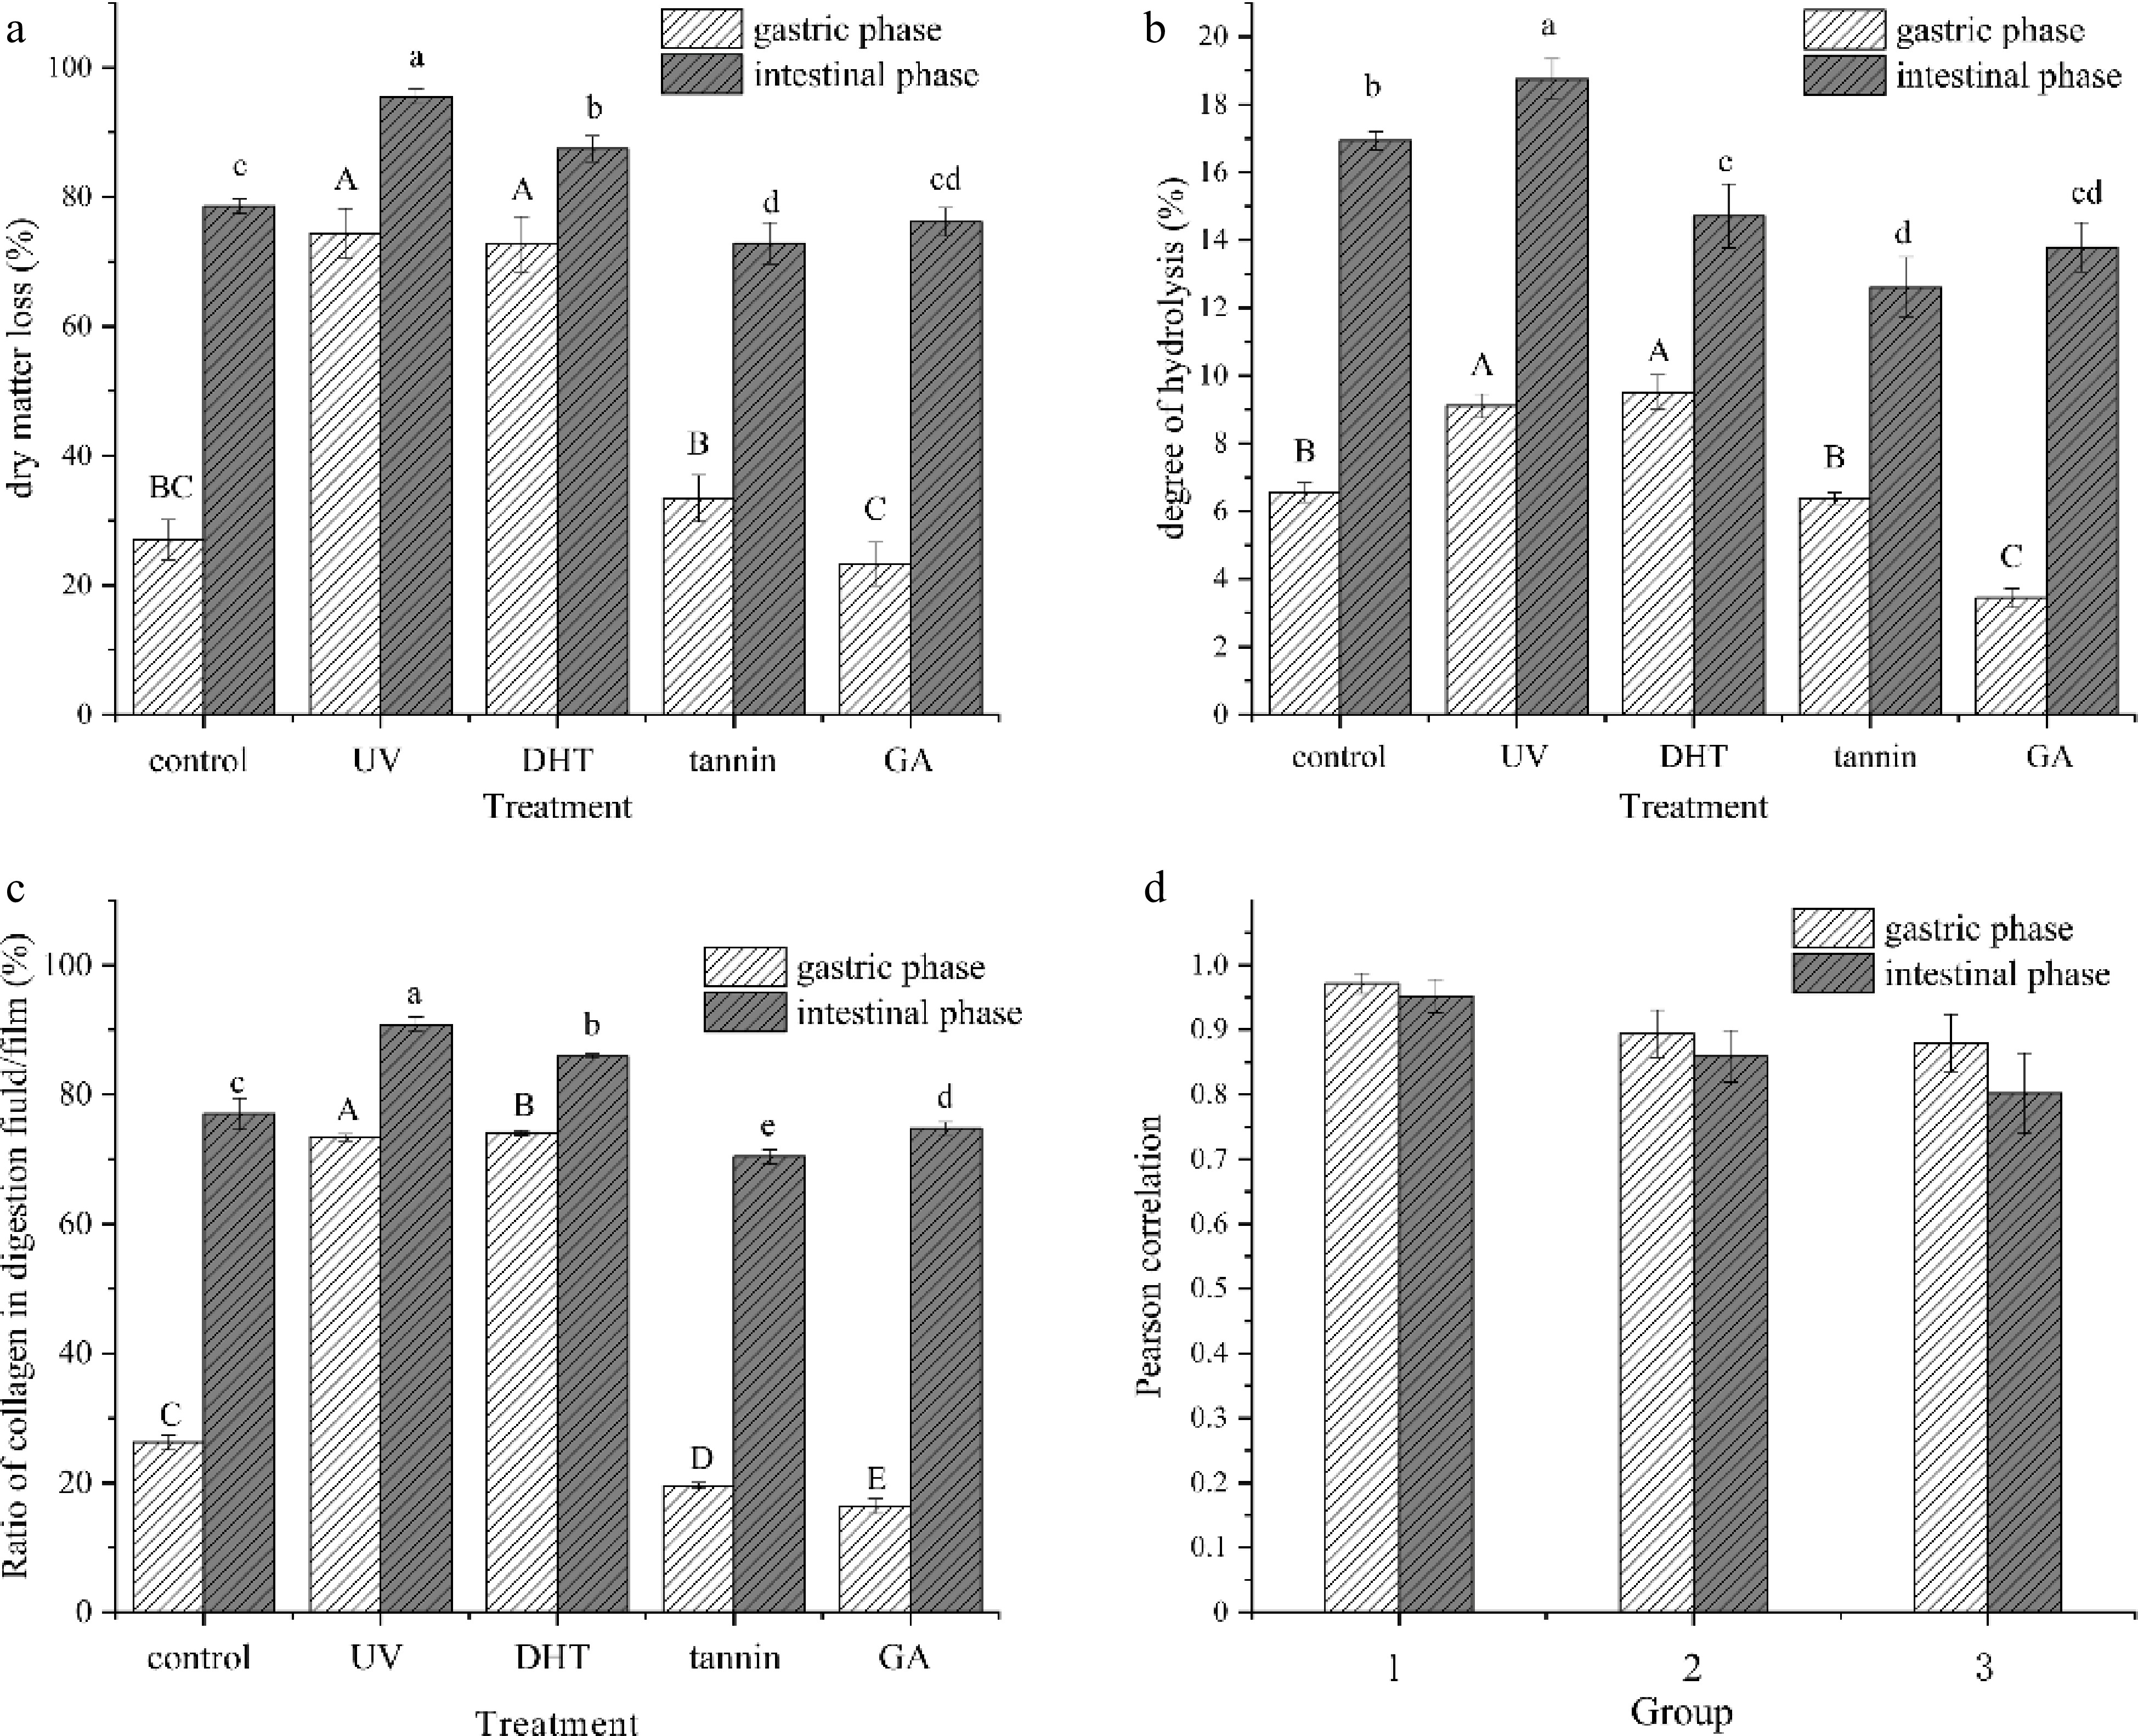
Figure 1.
(a) Dry matter loss, (b) degree of hydrolysis and (c) ratio of collagen in digestion fluid/film of samples in gastric and intestinal. The relations between (a), (b) and (c) were determined by (d) Pearson's correlation coefficient. Control: untreated collagen film; UV: UV-treated film; DHT: film treated with dehydration; Tannin: tannin-treated film; GA: glutaraldehyde-treated film.
-
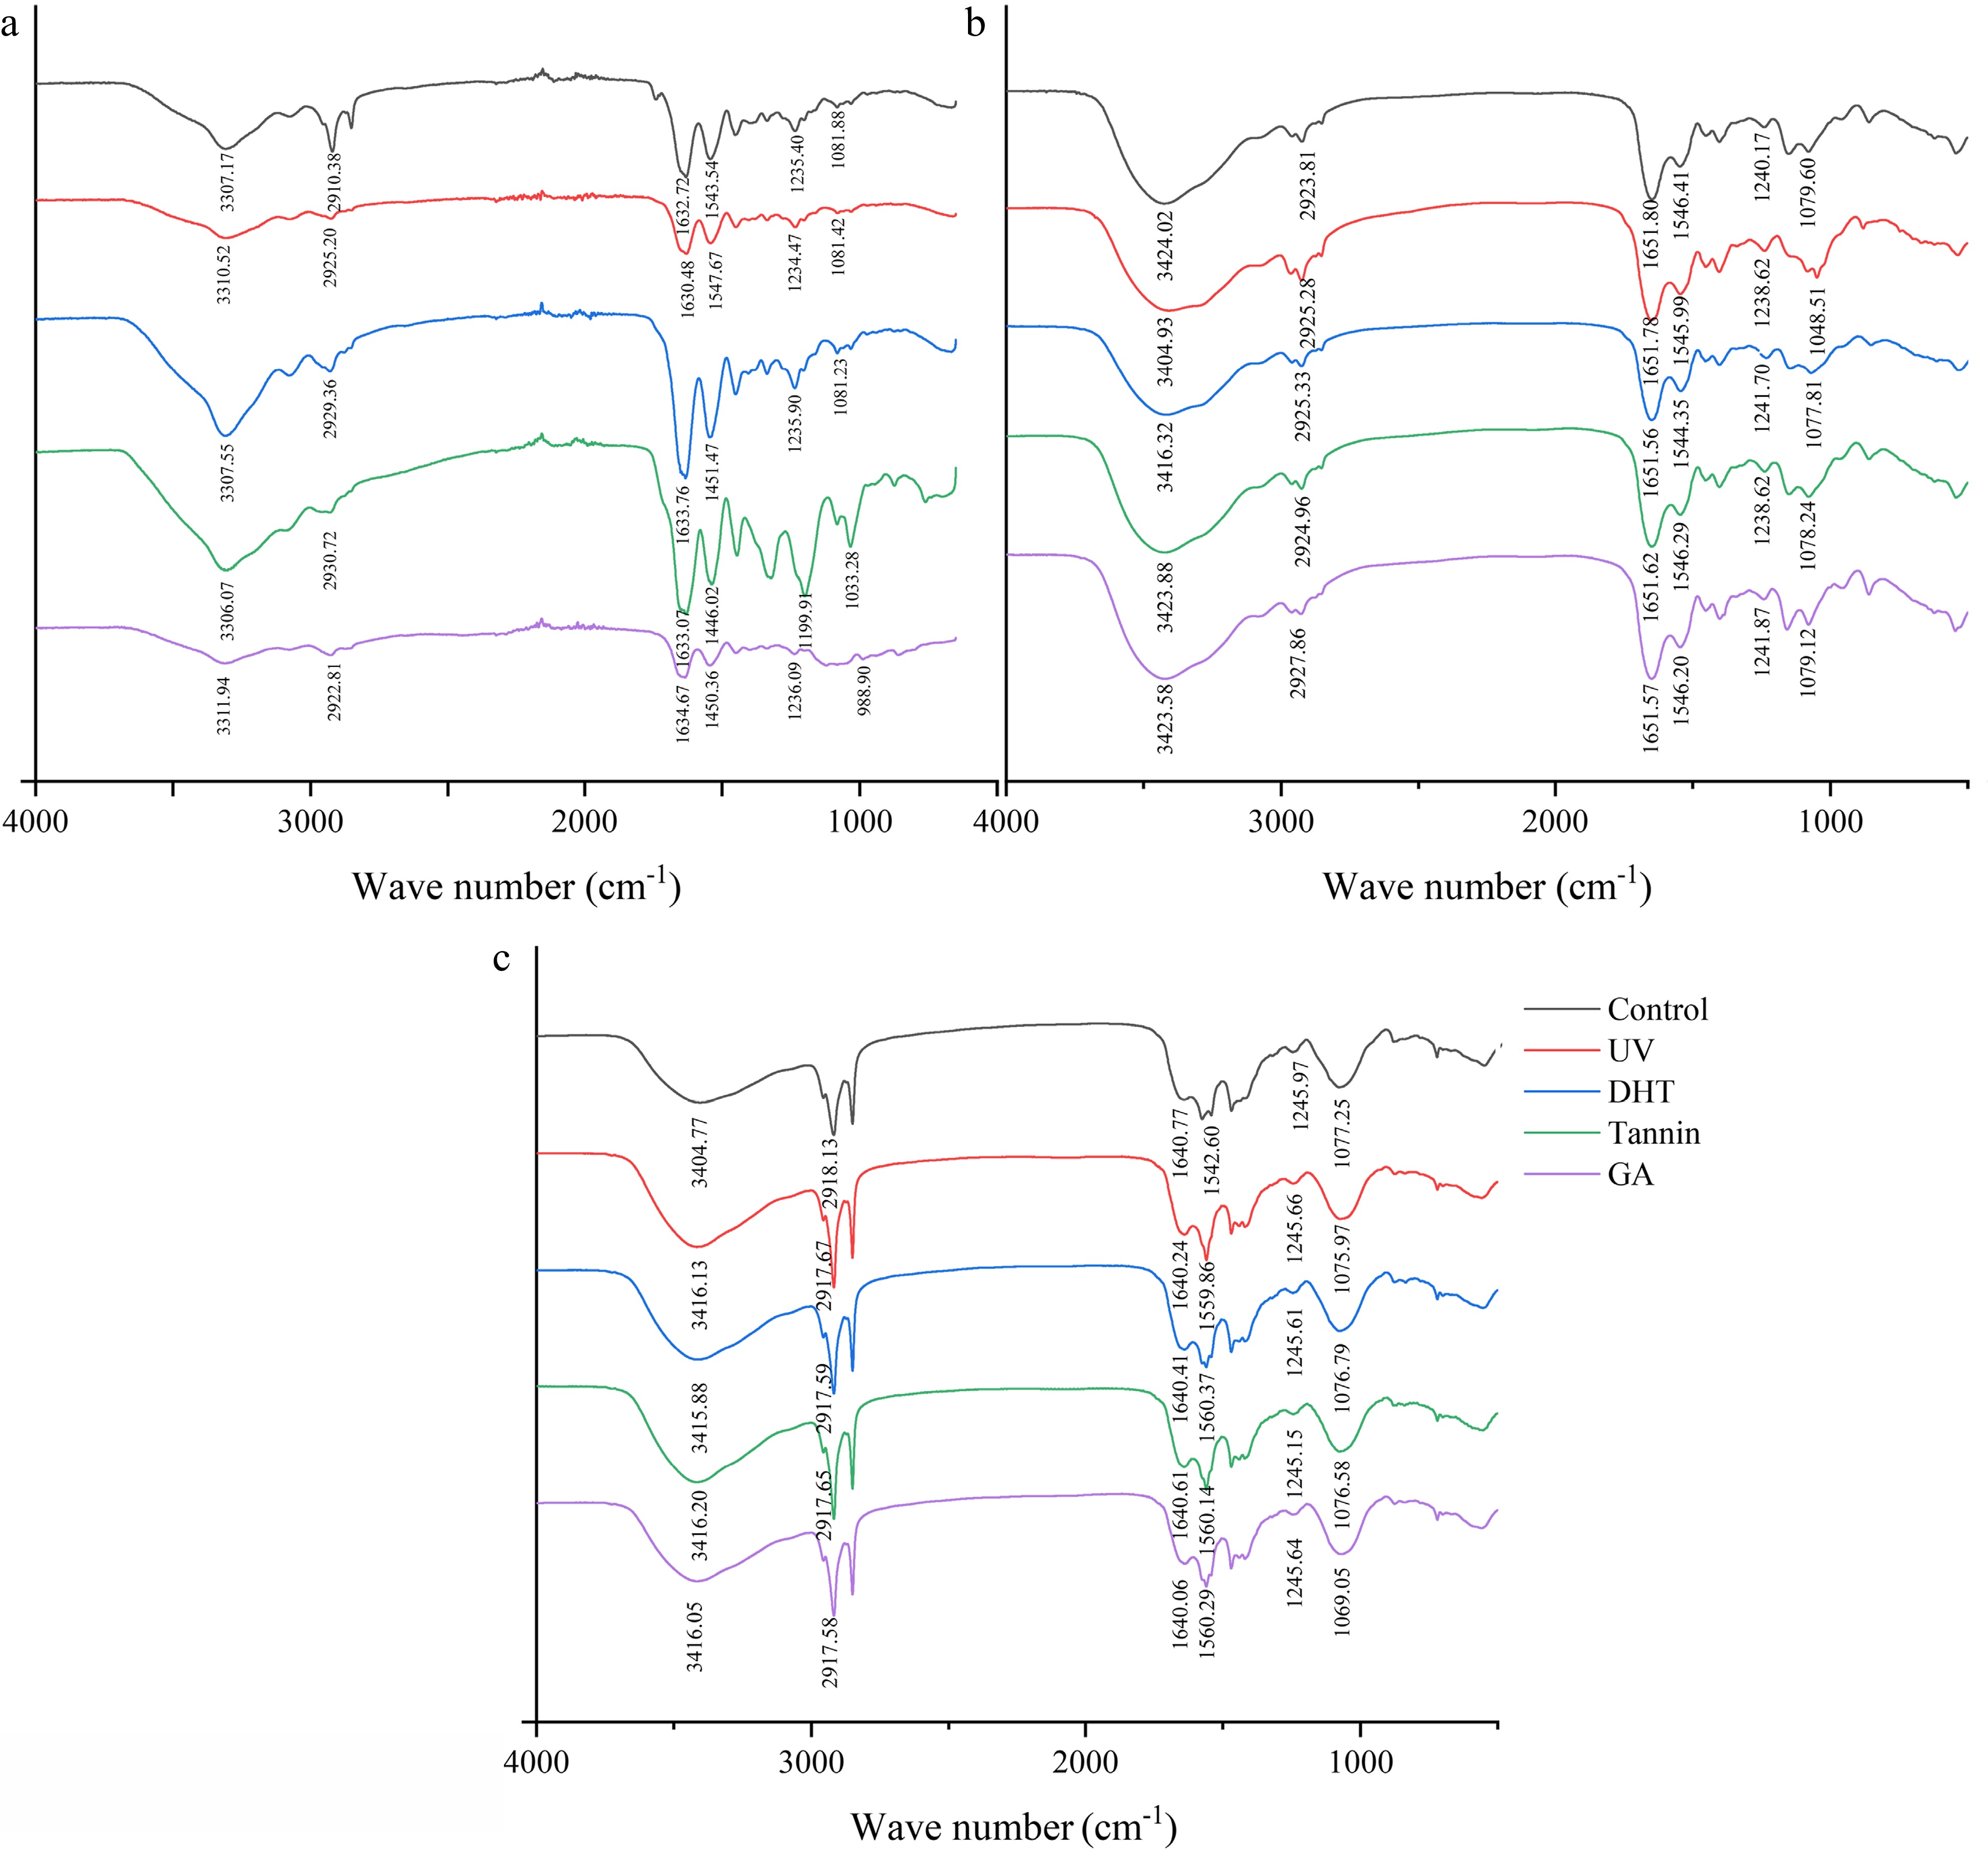
Figure 2.
The FTIR spectra of (a) collagen films, (b) freeze-dried powder after gastric digestion and (c) freeze-dried powder after intestinal digestion.
-
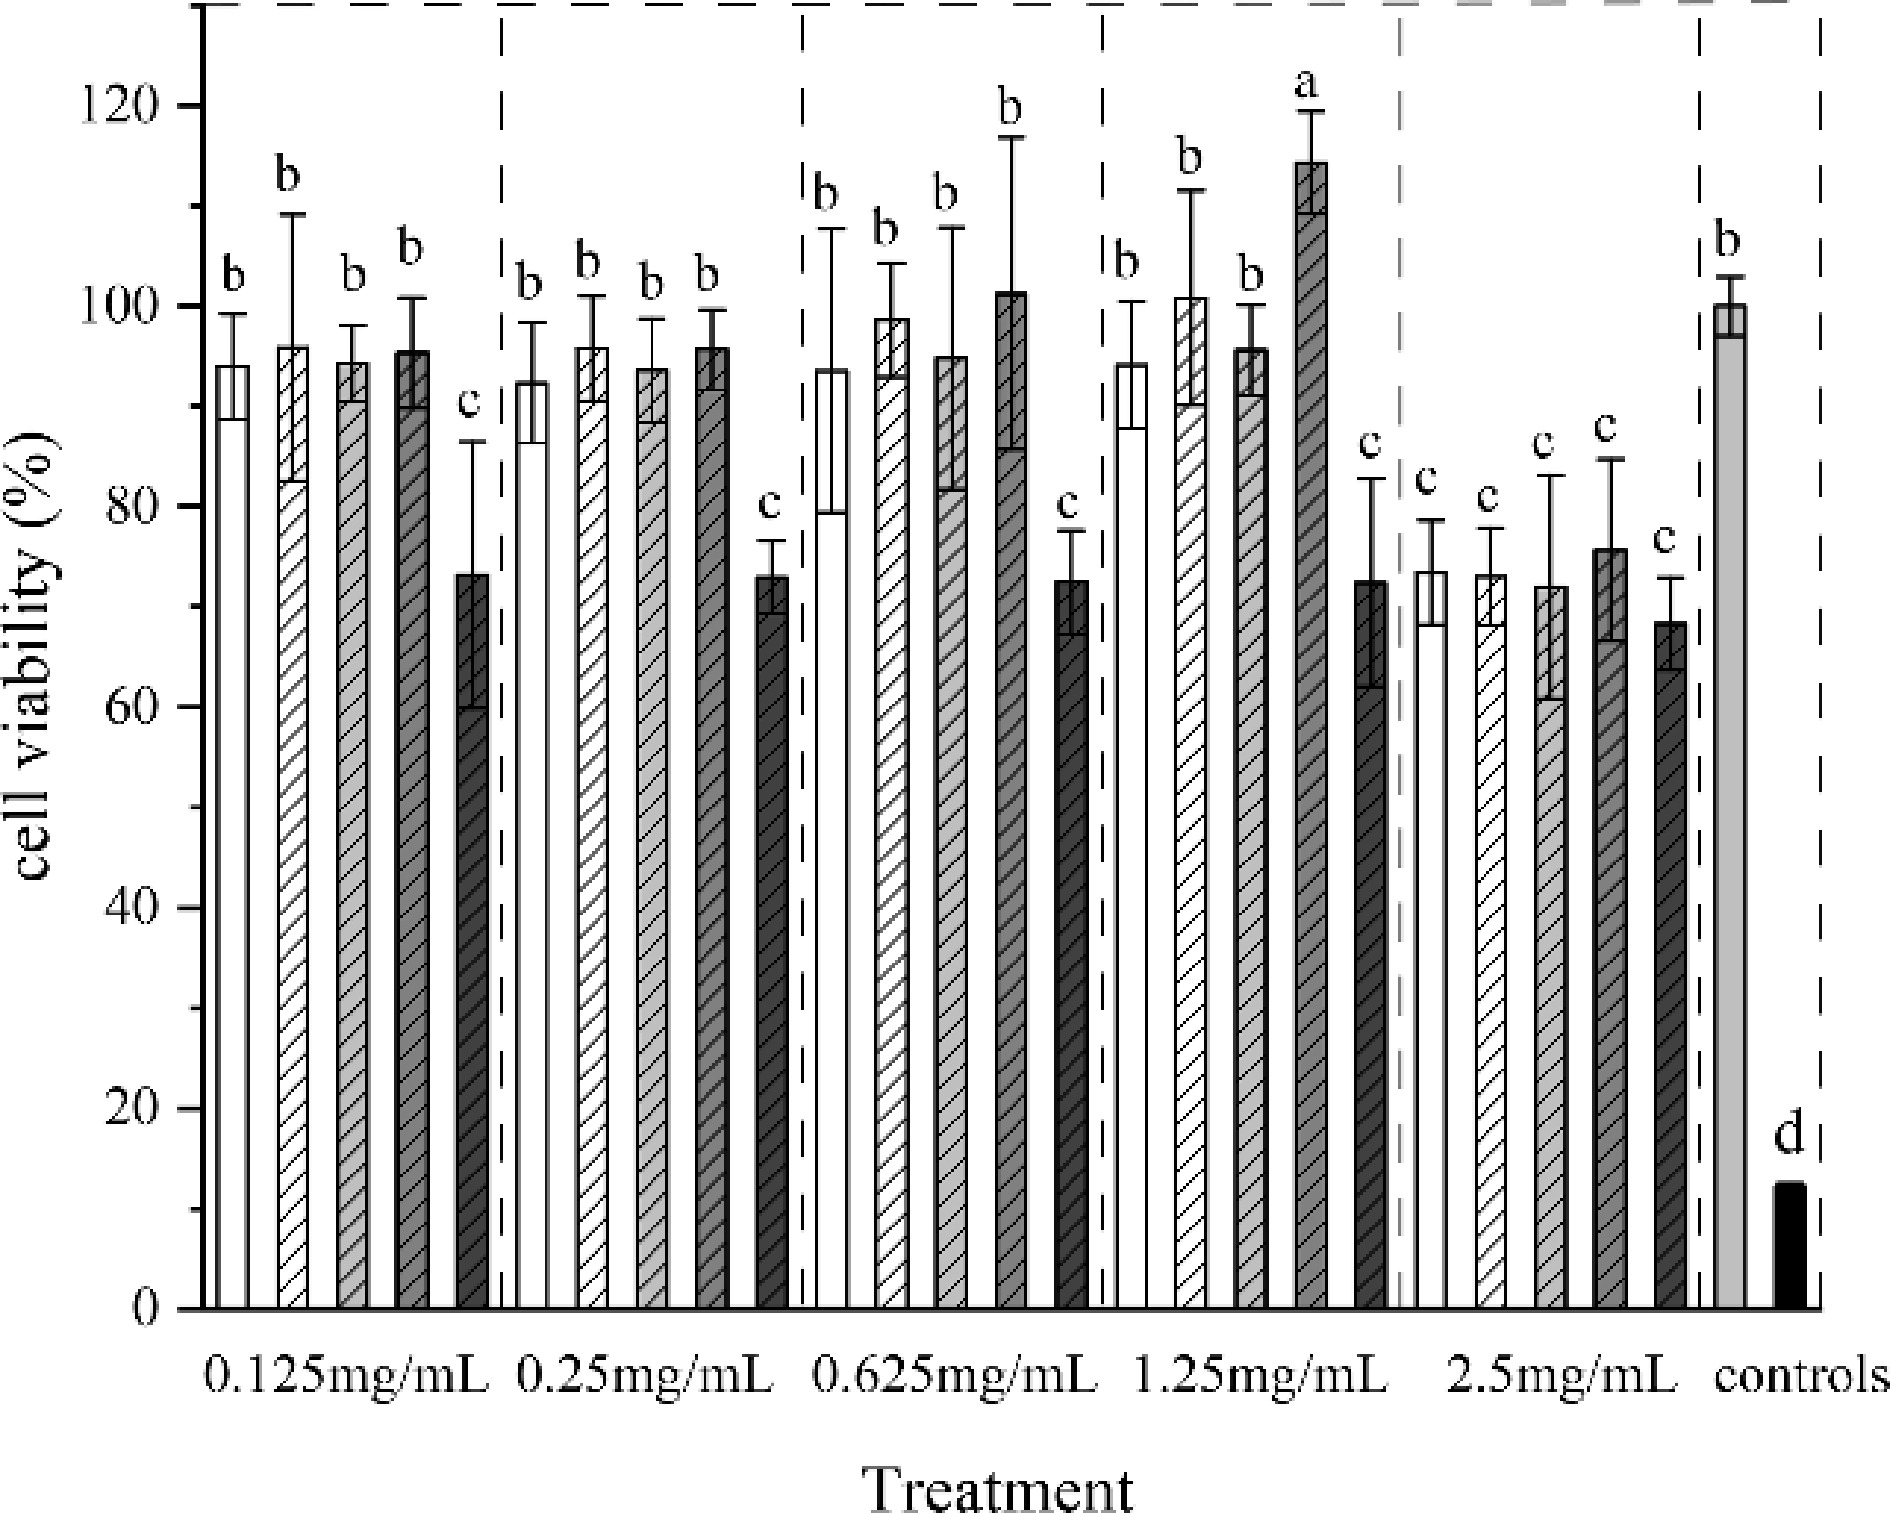
Figure 3.
Cell viability of digested juices of collagen film treated with different crosslinking methods.
-
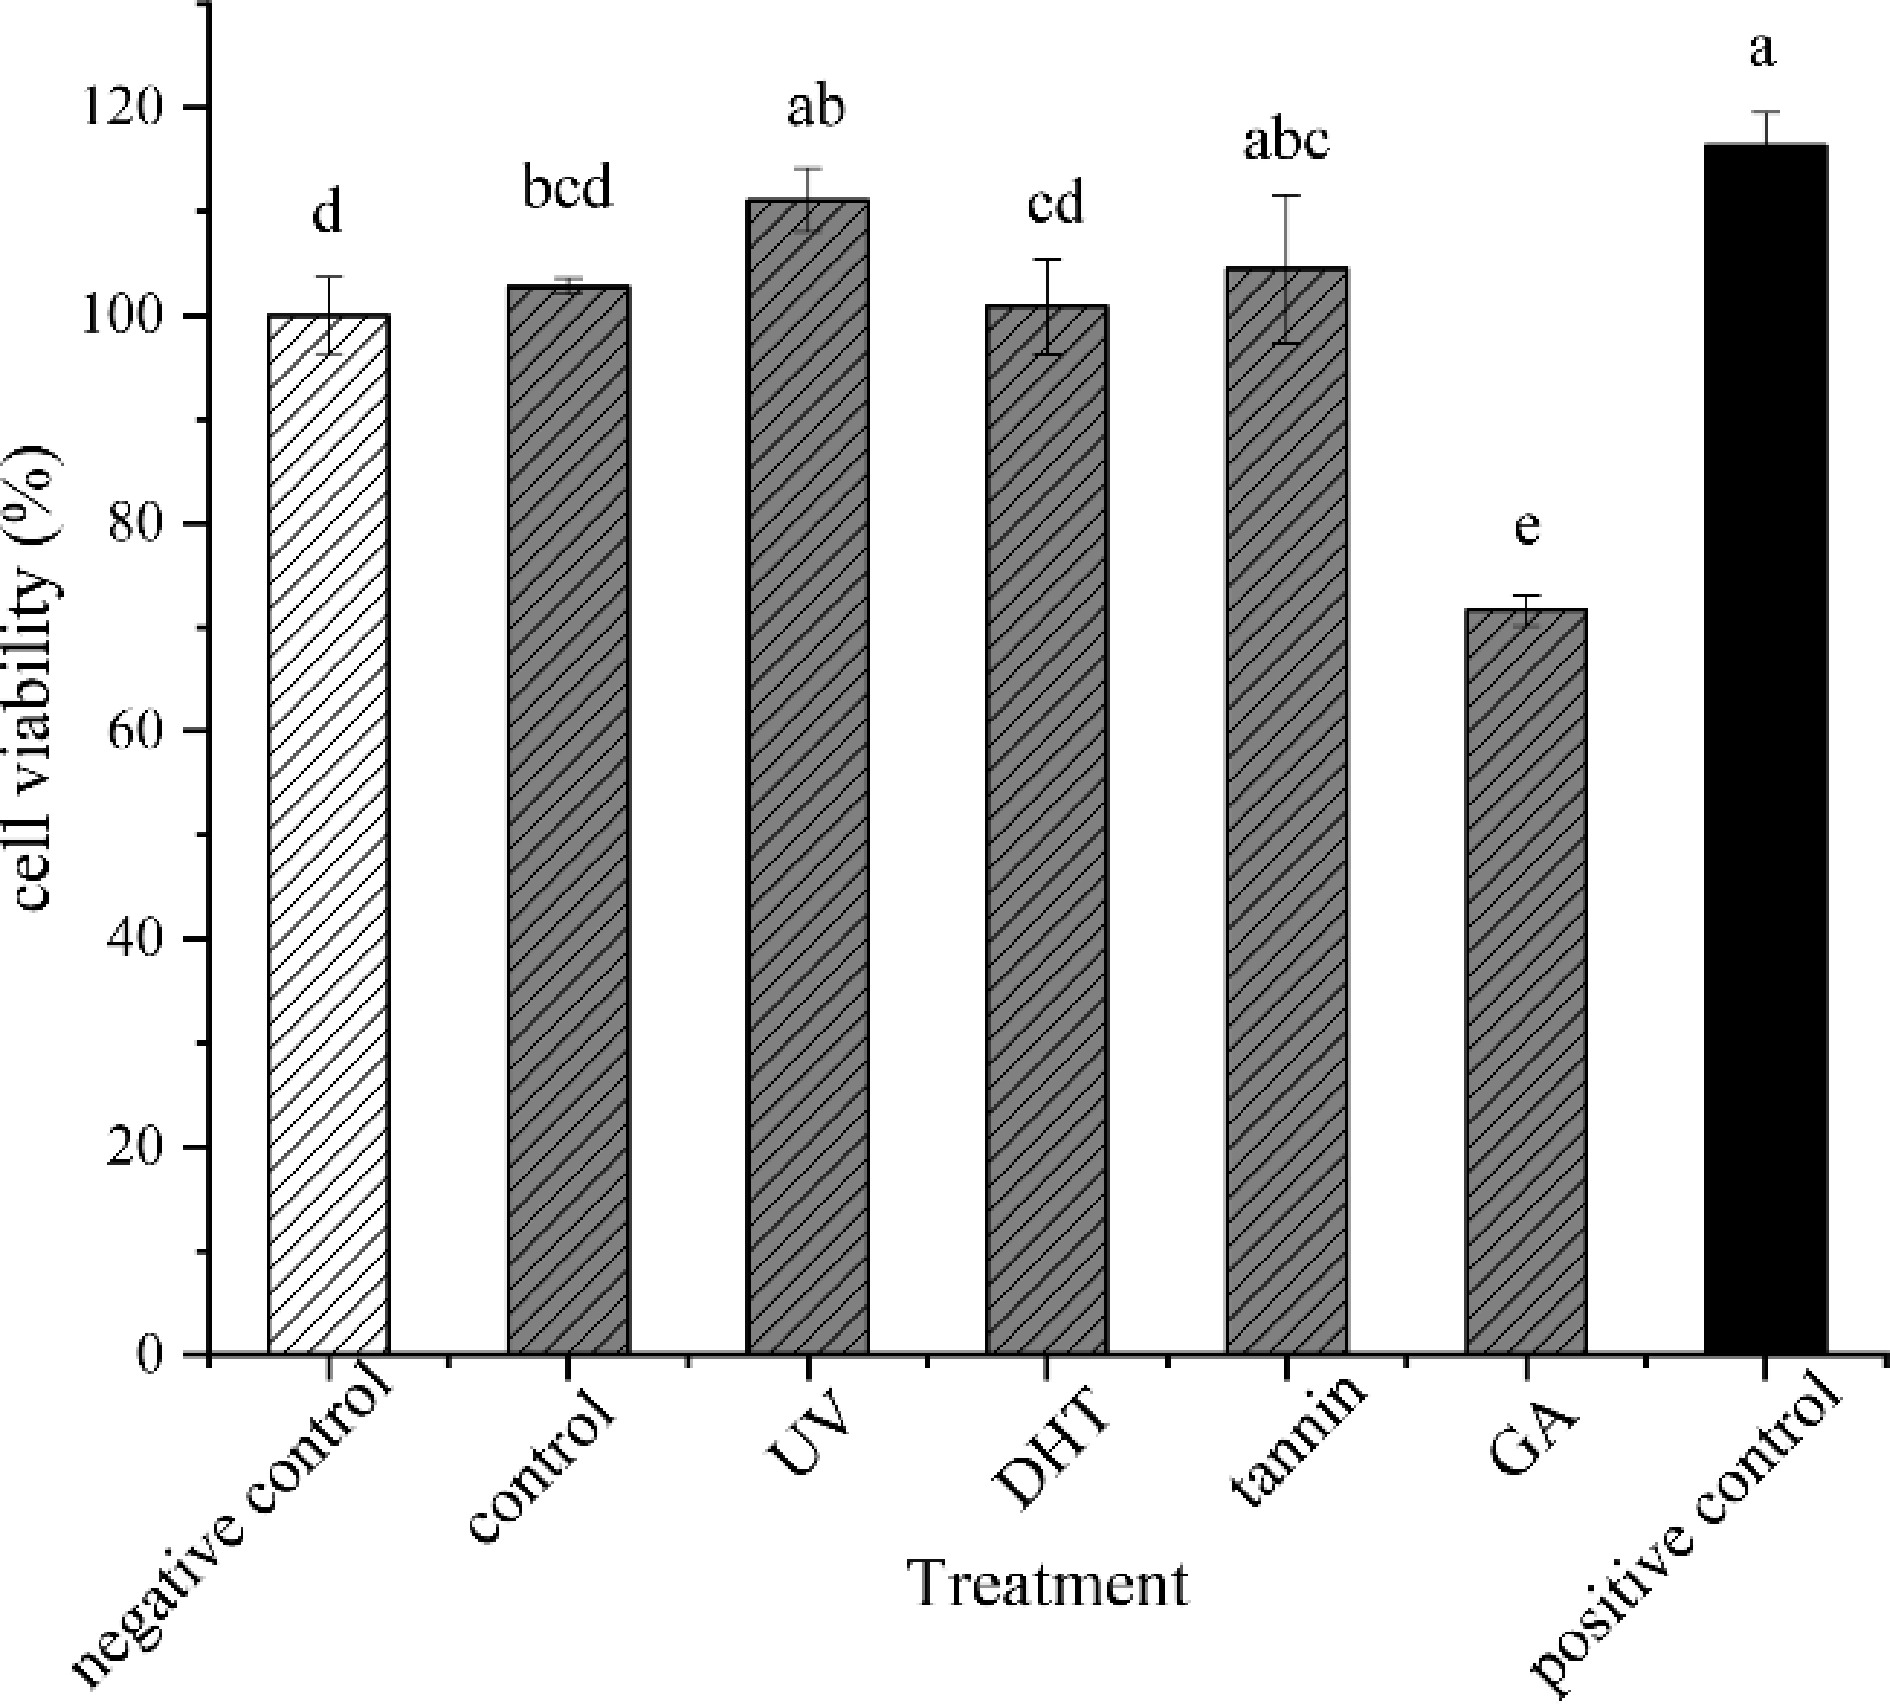
Figure 4.
Cell viability of collagen films and films treated with UV, DHT, tannin and GA.
-
Treatment α-helix β-sheets β-turn Random coil Film Control 23.92% 11.5% 9.32% 12.01% UV 22.82% 19.01% 7.75% 23.37% DHT 12.85% 16.85% 8.10% 22.79% Tannin 11.75% 23.76% 6.75% 23.22% GA 11.53% 20.66% 7.99% 22.56% Gastric Control 18.27% 30.70% 12.24% 6.02% UV 24.75% 32.96% 6.51% — DHT 21.97% 33.69% 7.97% — Tannin 24.32% 32.98% 5.64% — GA 10.43% 30.09% 6.54% 17.98% Intestinal Control 19.49% 43.21% 2.99% 11.26% UV 17.52% 40.39% 5.33% 9.05% DHT 19.32% 41.13% 5.57% 10.24% Tannin 18.56% 46.91% 1.74% 9.57% GA 10.39% 38.44% 7.84% 13.11% Table 1.
The secondary structure analysis of amides I region obtained by deconvolution.
Figures
(4)
Tables
(1)