-
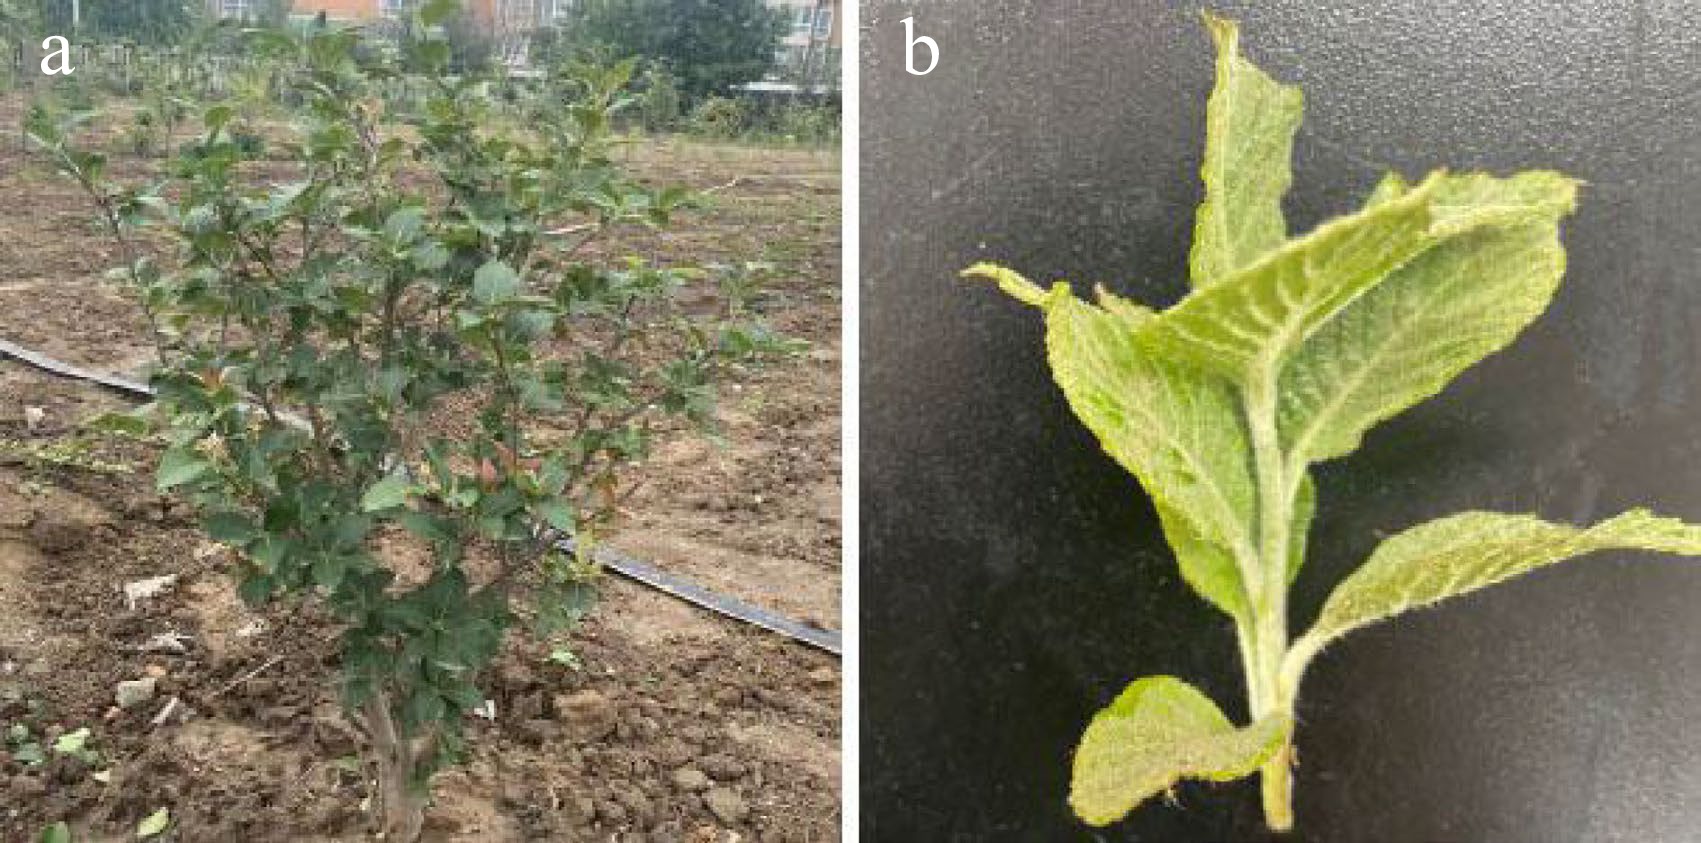
Figure 1.
Morphology of young stems and leaves of Sorbus caloneura. (a) Four-year-old S. caloneura plant. (b) Young stems and leaves.
-
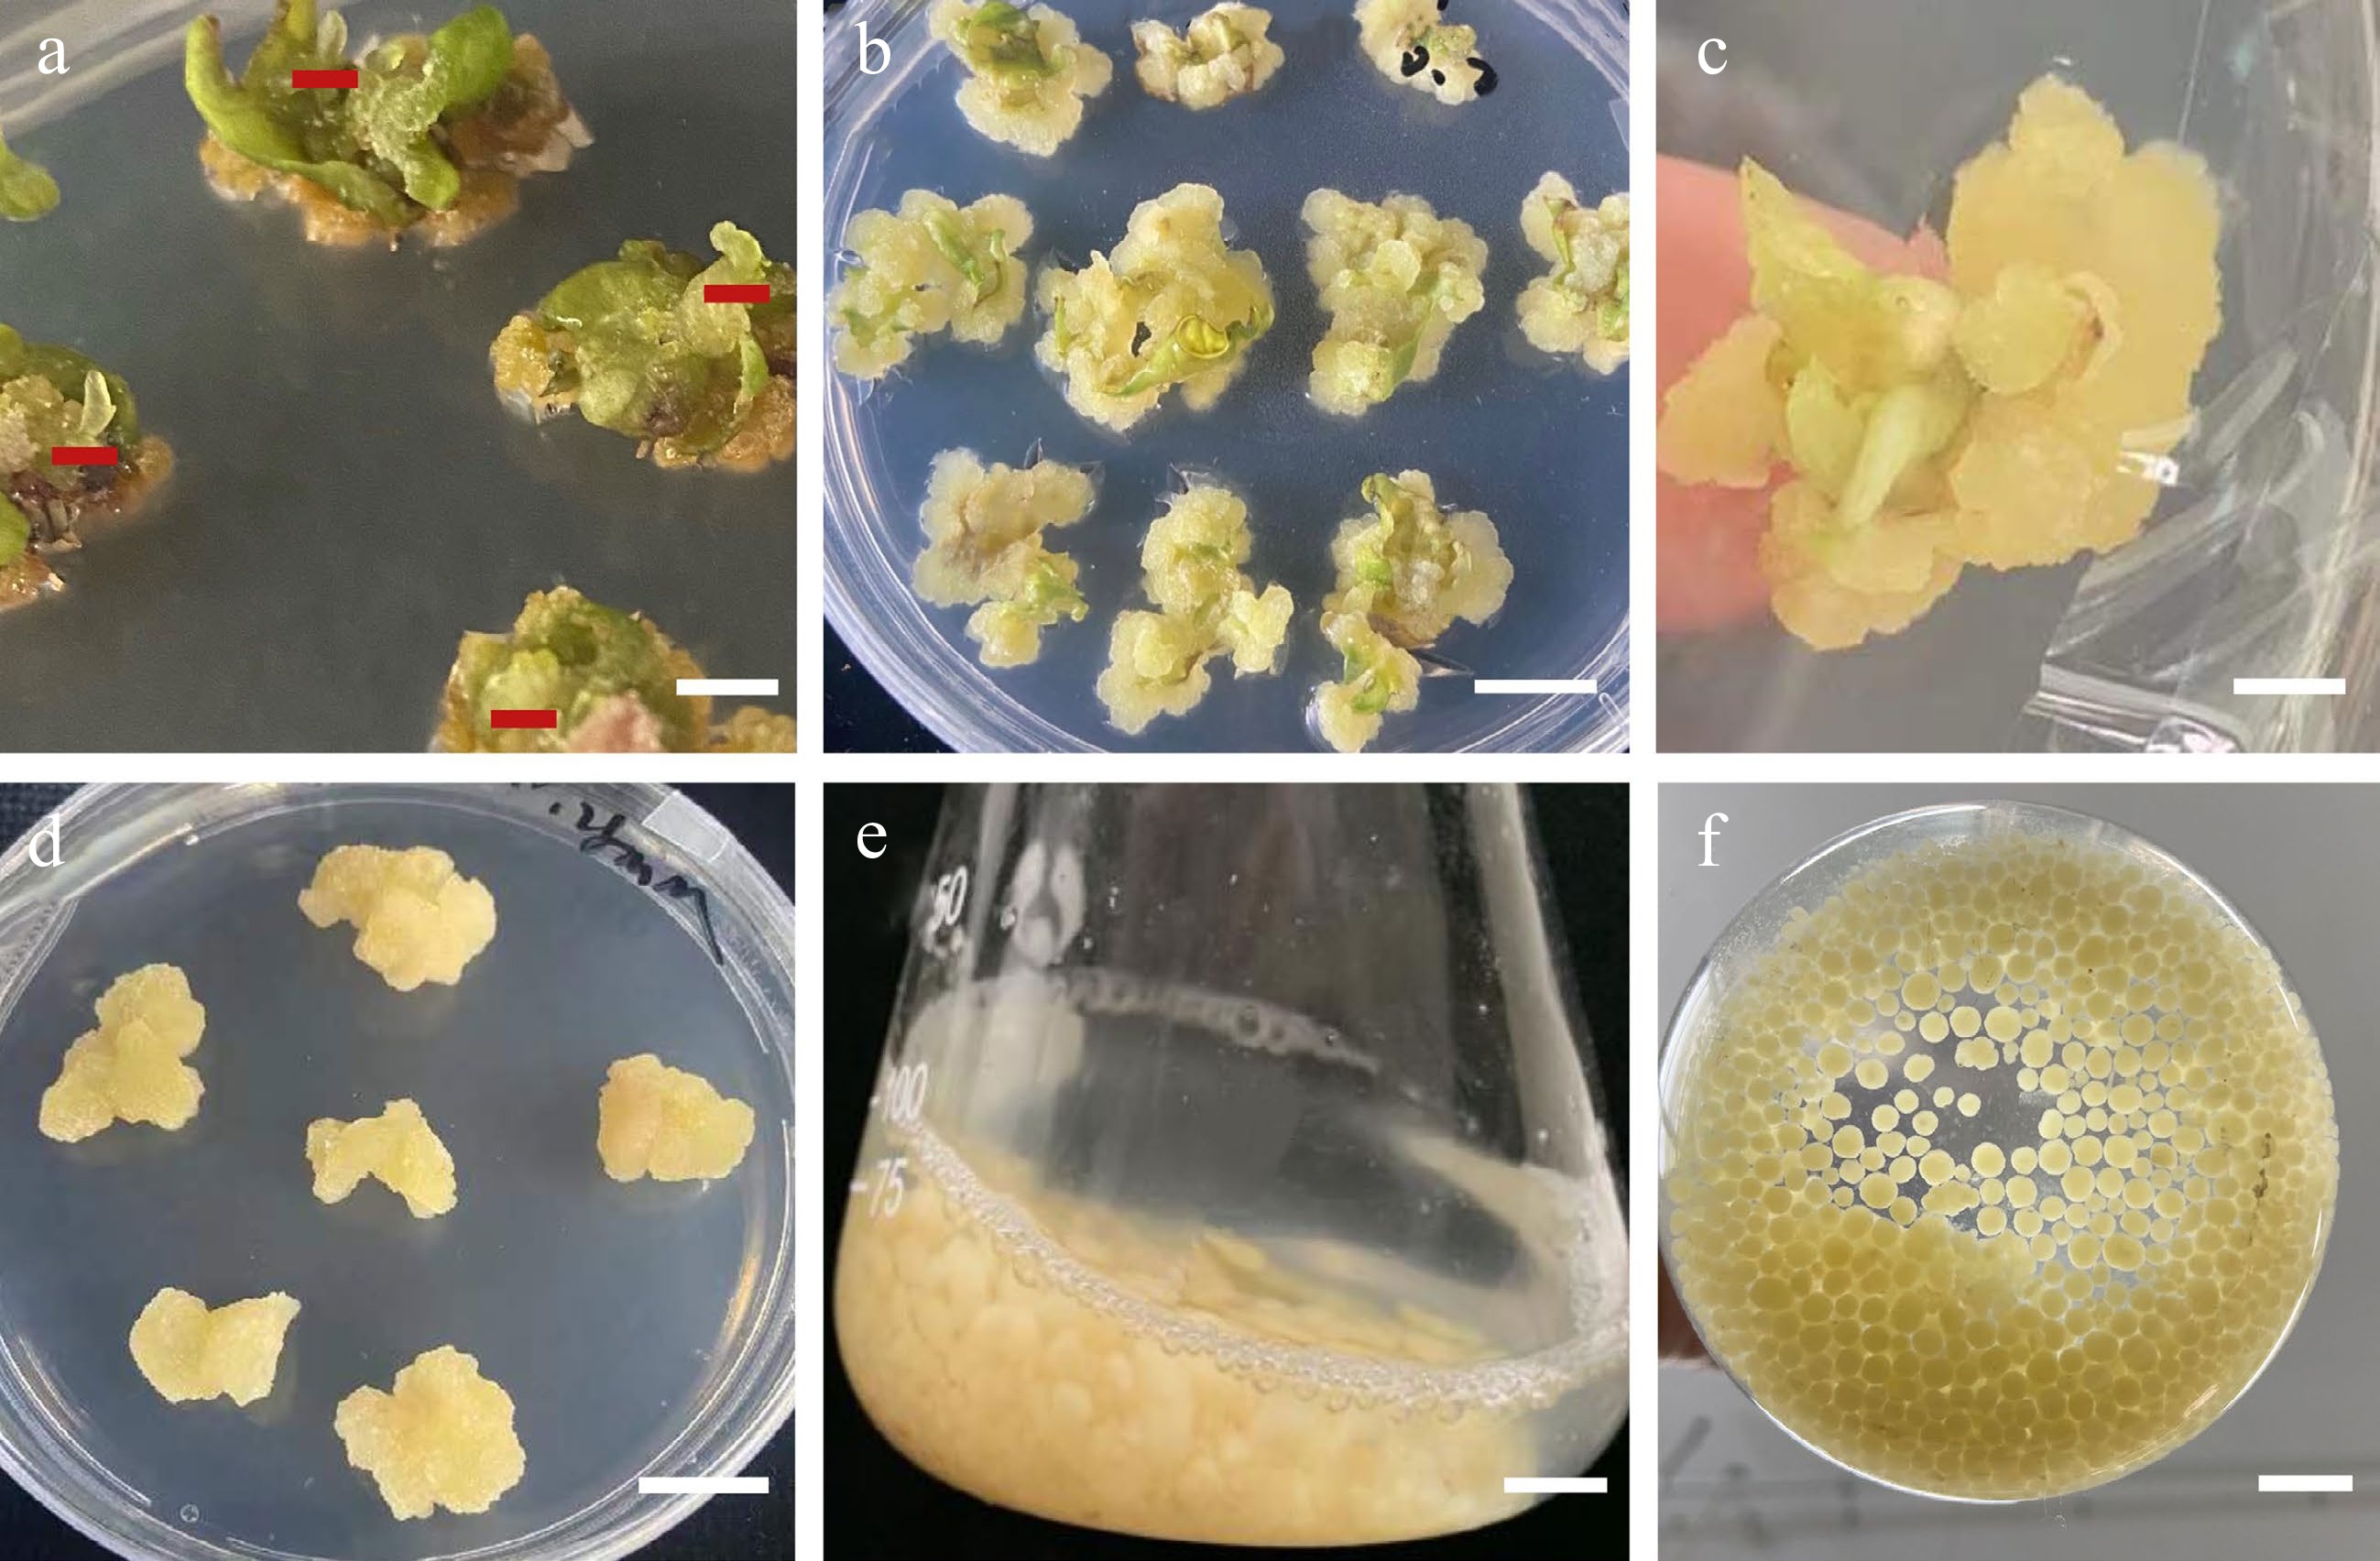
Figure 2.
Morphology of callus induction, shoot regeneration, and callus suspension. (a) Morphology of the leaf samples that were proximal halves cut twice vertically through the main vein. (b) Direct adventitious shoot regeneration (red mark). (c) Calli induced from leaves. (d) Callus adventitious shoot regeneration from callus. (e) Calli proliferation in suspension culture. (f) Suspension subculture. Scale bars (a), (b), (d) = 0.5 cm, (c), (e), (f) = 1 cm.
-
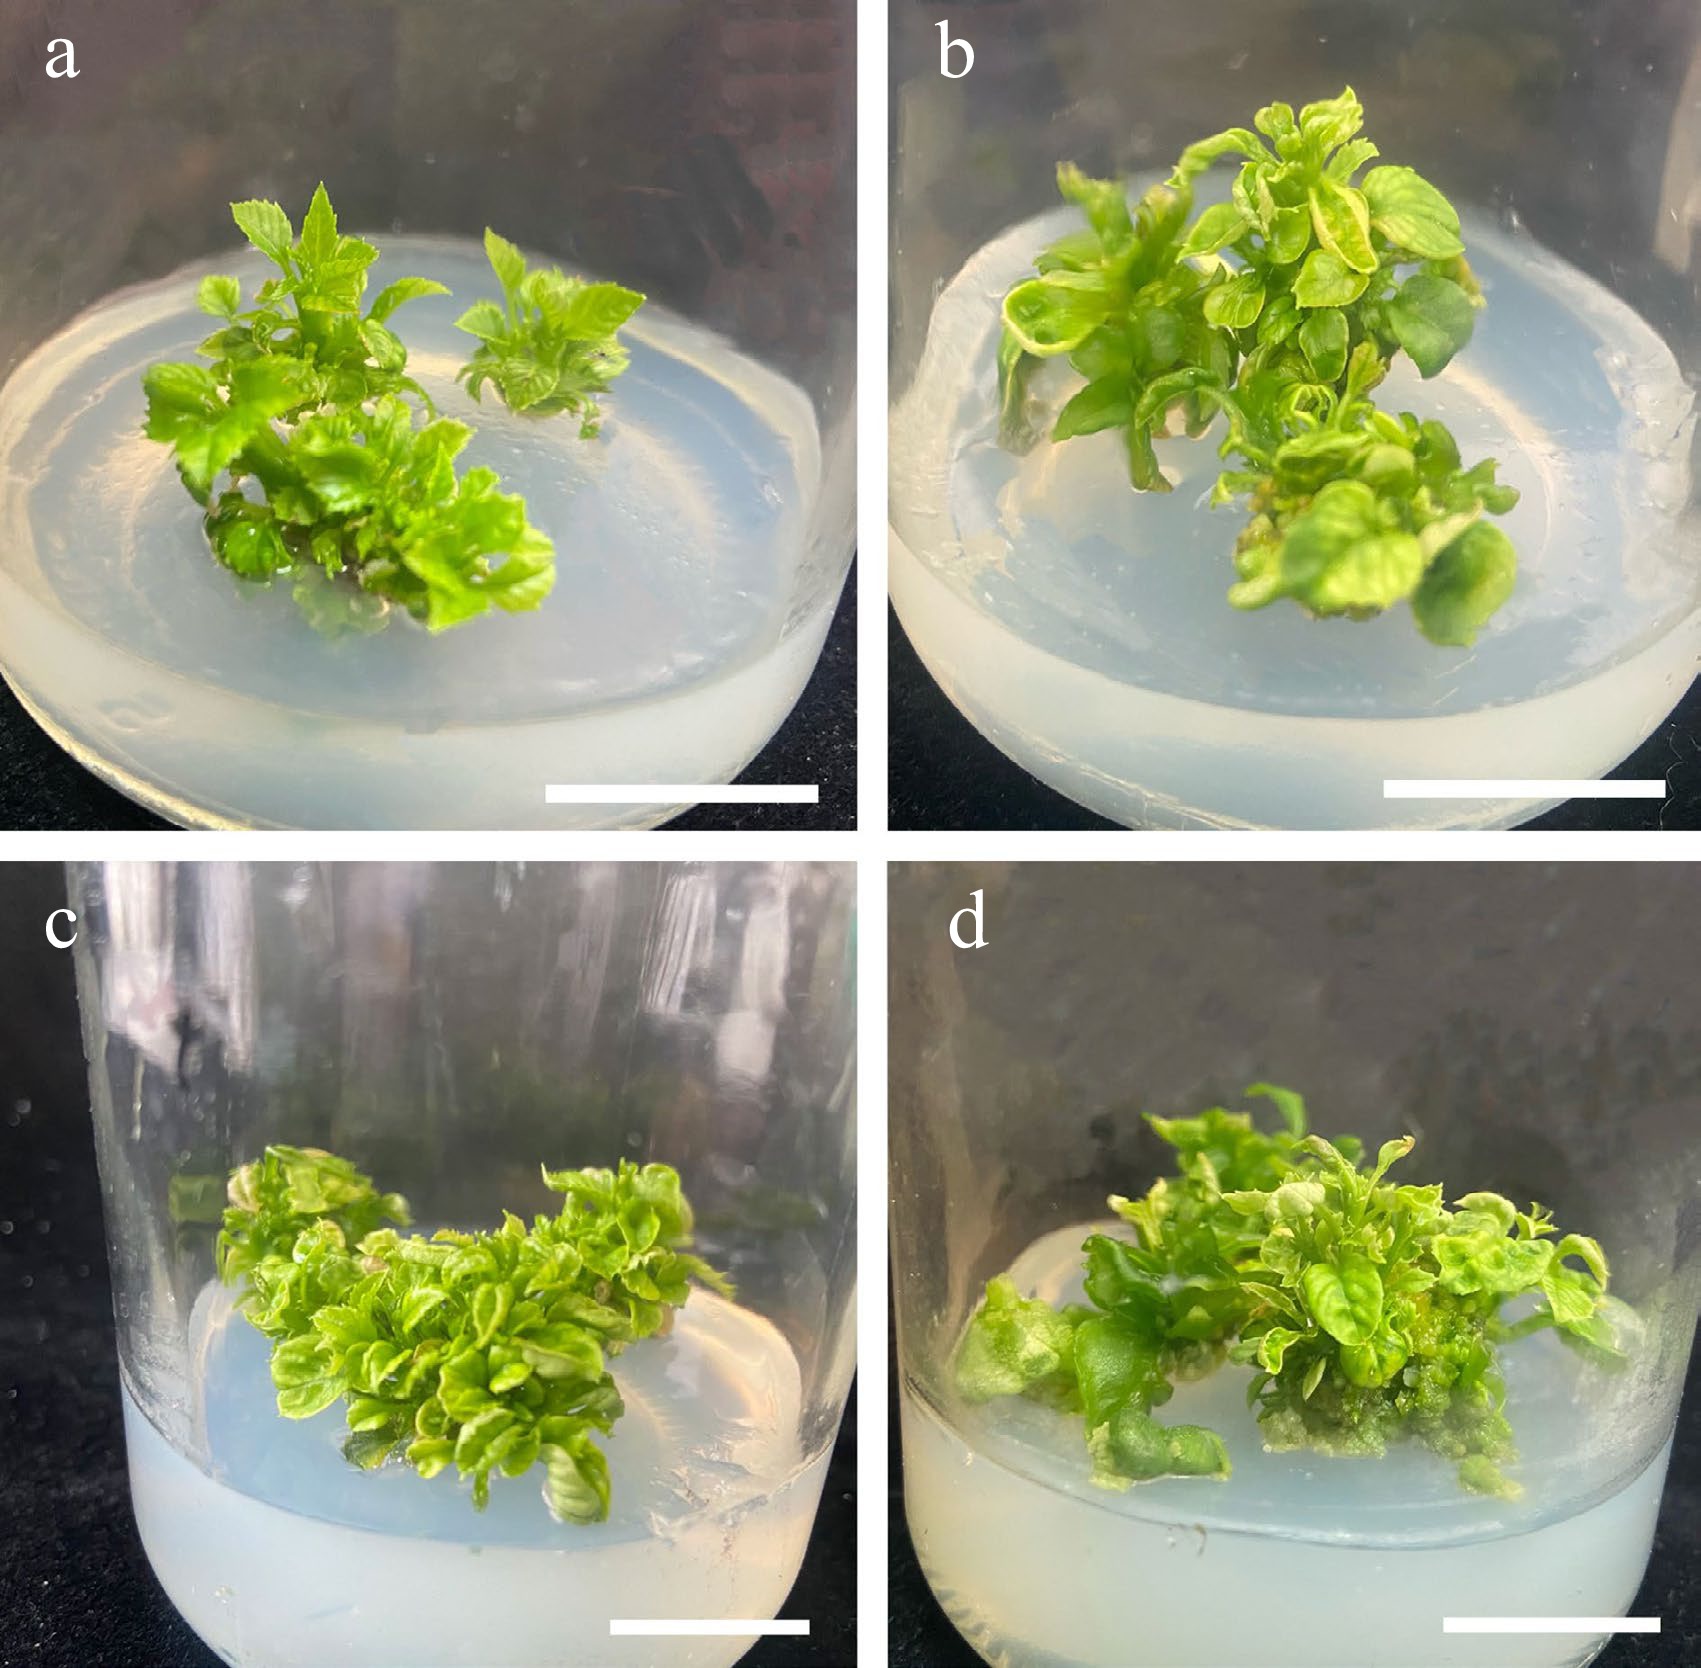
Figure 3.
Effects of different concentrations of 6-BA and NAA on the proliferation of stems. (a) 6-BA (1.25 mg/L) and NAA (0.25 mg/L). (b) 6-BA (1.25 mg/L) and NAA (0.50 mg/L). (c) 6-BA (1.75 mg/L) and NAA (0.25 mg/L). (d) 6-BA (1.75 mg/L) and NAA (0.50 mg/L), Scale bars = 2 cm.
-
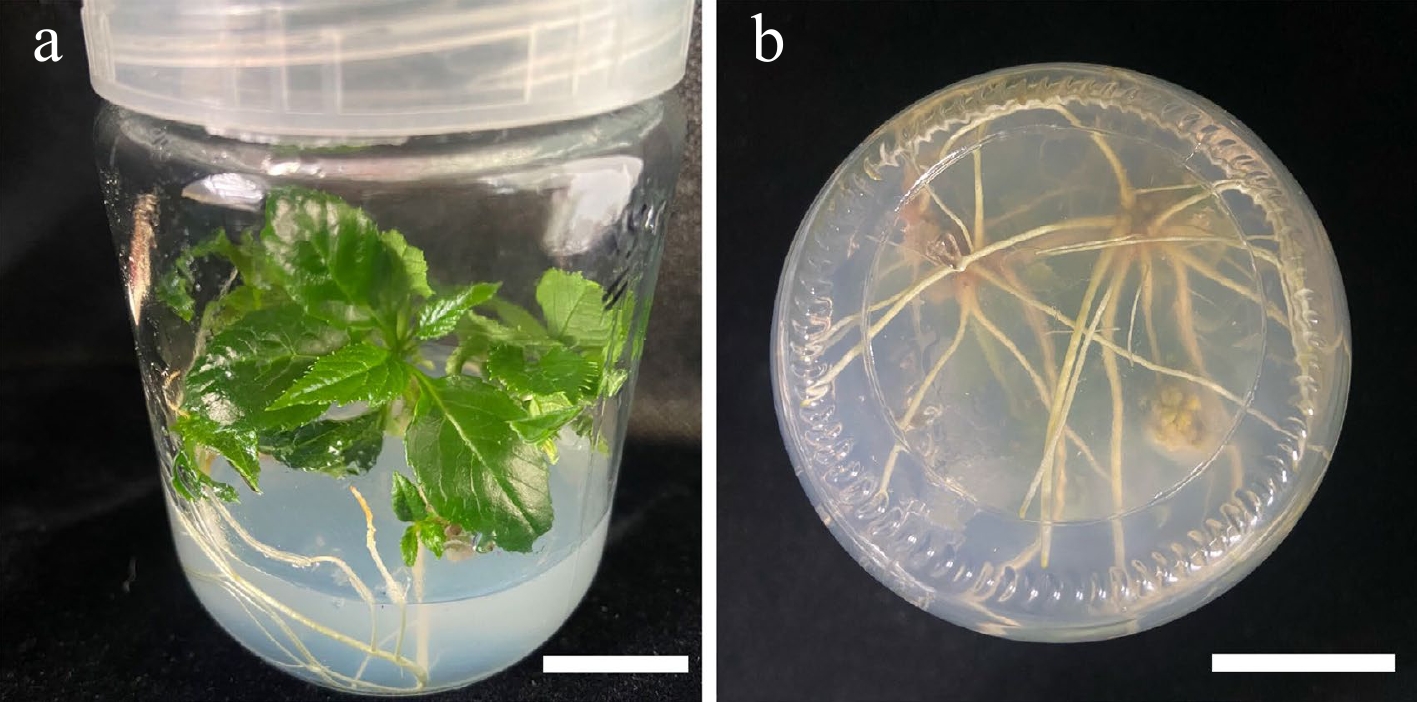
Figure 4.
Morphology of roots treated with NAA (0.20 mg/L) and IBA (1.50 mg/L). (a) 30 d old root, front view. (b) 30 d old root, bottom view. Scale bars = 2 cm.
-
Medium 6-BA (mg/L) NAA (mg/L) Number of shoots/
explantProliferation rate (%) Vitrification (%) 1 1.25 0.25 2.77 ± 0.31c 100 0.00 ± 0.00b 2 1.25 0.50 3.30 ± 0.46bc 100 0.00 ± 0.00b 3 1.75 0.25 4.90 ± 0.10a 100 13.33 ± 5.77a 4 1.75 0.50 3.37 ± 0.15b 100 20.00 ± 10.00a Data are represented as the mean ± SE of three replicates. Different lowercase letters indicate significant differences among treatments as determined by Duncan's test (P ≤ 0.05). Abbreviations: SE = standard error; 6-BA = 6-benzyladenine; NAA = naphthylacetic acid. Table 1.
Effects of 6-BA and NAA on stem proliferation.
-
Medium 6-BA (mg/L) NAA (mg/L) KT (mg/L) Regeneration rate (%) Growth status of explants 1 1.00 0.10 1.00 0.00 ± 0.00b Poor and dense horizontal distribution of yellowish-brown callus 2 1.00 0.25 1.50 0.00 ± 0.00b General, yellow-green dense callus distributed in a few spots 3 1.00 0.50 2.00 0.00 ± 0.00b General, yellow-green dense callus 4 3.00 0.10 1.50 0.00 ± 0.00b General, light-yellow dense callus 5 3.00 0.25 2.00 0.00 ± 0.00b Poor, yellow-brown callus, denser 6 3.00 0.50 1.00 0.00 ± 0.00b General, light-yellow dense callus 7 5.00 0.10 2.00 0.00 ± 0.00b Grew well, callus was loose when it was yellowish and healed 8 5.00 0.25 1.00 0.00 ± 0.00b Good growth, shoot point appeared 9 5.00 0.50 1.50 20.00 ± 0.20a Grew well, adventitious shoots detected Data are represented as the mean ± SE of three replicates. Different lowercase letters indicate significant differences among treatments as determined by Duncan’s test (P ≤ 0.05). Abbreviations: SE = standard error; 6-BA = 6-benzyladenine; NAA = naphthylacetic acid; KT = kinetin. Table 2.
Effects of 6-BA, NAA, and KT on direct shoot regeneration from leaves.
-
Medium 6-BA
(mg/L)2,4-D
(mg/L)TDZ
(mg/L)Induction rate
(%)Growth status of explant 1 0.10 0.10 0.10 23.33 ± 3.83e Poor growth, little yellowish-brown calli with uneven distribution 2 0.10 0.10 0.20 83.33 ± 4.70c General growth, swelling, fewer light-yellow calli 3 0.10 0.10 0.50 96.67 ± 10.64ab General growth, yellowish and whitish relatively compact calli, with small white particles in bulges 4 0.10 1.00 0.10 90.00 ± 13.61bc Poor growth, almost no calli 5 0.10 1.00 0.20 96.67 ± 10.64ab General growth, yellow compact calli with uniform distribution 6 0.10 1.00 0.50 90.00 ± 13.61bc General growth, yellowish compact calli and brown leaves without calli 7 0.10 2.00 0.10 100.00 ± 0.00a General growth, obvious wounds, light-green with yellow, more compact calli 8 0.10 2.00 0.20 100.00 ± 0.00a General growth, many pale-yellow dense calli over the leaves 9 0.10 2.00 0.50 86.67 ± 4.70c Good growth, yellow-green, rapid proliferation and vitrification 10 0.50 0.10 0.10 100.00 ± 0.00a General growth, yellow-green, relatively compact calli, many bulges 11 0.50 0.10 0.20 100.00 ± 0.00a Good growth, yellow-green, compact, evenly covered with calli at the incision 12 0.50 0.10 0.50 100.00 ± 0.00a Good growth, loose and yellowish-green granular calli with even distribution 13 0.50 1.00 0.10 100.00 ± 0.00a General growth 14 0.50 1.00 0.20 100.00 ± 0.00a Good growth, loose yellowish calli 15 0.50 1.00 0.50 100.00 ± 0.00a Good growth, loose yellow-green granular calli 16 0.50 2.00 0.10 100.00 ± 0.00a Good growth, full of calli, granular, loose, yellow-green, with white base 17 0.50 2.00 0.20 100.00 ± 0.00a General growth, yellowish compact calli 18 0.50 2.00 0.50 100.00 ± 0.00a Weak growth, yellowish and whitish with even distribution, tended to turn brown 19 2.00 0.10 0.10 86.67 ± 4.70c General growth, few scattered yellow-green calli 20 2.00 0.10 0.20 100.00 ± 0.00a Poor growth, banded or small calli 21 2.00 0.10 0.50 63.33 ± 3.48d General growth, light-yellow loose calli only appeared at the incision, and calli turned brown gradually 22 2.00 1.00 0.10 100.00 ± 0.00a Poor growth, slightly whiter yellow band, slower emergence, browning of leaf edge, denser and smaller particles 23 2.00 1.00 0.20 100.00 ± 0.00a Poor growth, pale yellow with white, waterlogged, small patches 24 2.00 1.00 0.50 96.67 ± 10.64ab Poor growth, dense cluster distribution, and little browning 25 2.00 2.00 0.10 100.00 ± 0.00a Poor growth, light green and more brown granular calli, severe browning of leaves, slower emergence 26 2.00 2.00 0.20 96.67 ± 10.64ab General growth, yellow-green brownish and compact calli 27 2.00 2.00 0.50 96.67 ± 10.64ab General growth, large leaf curl, uniform distribution of yellow-brown calli Data are represented as the mean ± SE of three replicates. Different lowercase letters indicate significant differences among treatments as determined by Duncan’s test (P ≤ 0.05). Abbreviations: SE = standard error; 6-BA = 6-benzyladenine; NAA = naphthylacetic acid; KT = kinetin. Table 3.
Effects of 6-BA, 2, 4-D, and TDZ on leaf callus induction.
-
Medium 6-BA (mg/L) NAA (mg/L) Regeneration rate (%) 1 1.00 0.10 0.00 ± 0.00a 2 1.00 0.30 0.00 ± 0.00a 3 1.00 0.50 0.00 ± 0.00a 4 3.00 0.10 0.00 ± 0.00a 5 3.00 0.30 3.33 ± 0.19a 6 3.00 0.50 0.00 ± 0.00a 7 5.00 0.10 0.00 ± 0.00a 8 5.00 0.30 0.00 ± 0.00a 9 5.00 0.50 0.00 ± 0.00a Data are represented as the mean ± SE of three replicates. Different lowercase letters indicate significant differences among treatments as determined by Duncan’s test (P ≤ 0.05). Abbreviations: SE = standard error; 6-BA = 6-benzyladenine; NAA = naphthylacetic acid. Table 4.
Effects of 6-BA and NAA on indirect shoot regeneration from calli.
-
NAA
(mg/L)IBA
(mg/L)Rooting Rate
(%)Rooting number
(strip)Rooting status 1 0.00 1.00 26.67 ± 2.29cd 2.50 ± 0.13cd Light-green with white roots, thick, and more extensive aboveground parts 2 0.00 1.50 36.67 ± 3.89c 2.75 ± 0.09c Light-green with white roots, thick, and more extensive aboveground parts 3 0.20 1.00 56.67 ± 2.03b 4.11 ± 0.06b White main root, many lateral roots 4 0.20 1.50 76.67 ± 4.43a 4.78 ± 0.12a White main root, many lateral roots 5 0.40 1.00 23.33 ± 3.83de 2.29 ± 0.15d White main root, stout, with lateral roots 6 0.40 1.50 6.67 ± 8.66f 1.50 ± 0.50ef White stout short root 7 0.80 1.00 16.67 ± 2.74de 1.20 ± 0.20f White main root, few lateral roots 8 0.80 1.50 13.33 ± 2.96e 1.75 ± 0.25e White roots with browning at the base Data are represented as the mean ± SE of three replicates. Different lowercase letters indicate significant differences among treatments as determined by Duncan's test (P ≤ 0.05). Abbreviations: SE = standard error; NAA = naphthylacetic acid; IBA = indole butyric acid. Table 5.
Effects of NAA and IBA on rooting of S.caloneura.
-
Level Factor A B C D Basic medium type Initial callus quality (g) Initial liquid volume (mL) Ratio of old-to-new liquid culture medium 1 MS 1.5 120 0 2 WPM 3.0 100 1/3 3 ½MS 4.5 80 1/1 Abbreviations: MS = Murashige and Skoog; WPM = woody plant medium; ½MS = ½Murashige and Skoog. Table 6.
Influencing factors and level of orthogonal test for callus suspension.
-
Variation source df MS F P-value 6-BA 1 3.641 11.614 0.008* NAA 1 0.603 1.932 0.199 Error 9 0.314 Total 12 * Represents a significant difference at P < 0.05. ** Represents a highly significant difference at P < 0.01. Abbreviations: df = degree of freedom; MS = mean square; 6-BA = 6-benzyladenine; NAA = naphthylacetic acid. Table 7.
Variation analyses of the average number of shoots for different 6-BA and NAA combinations.
-
Variation source df MS F P-value NAA 3 1558.764 83.091 < 0.001 ** IBA 1 3.190 0.170 0.686 Error 16 38.076 Total 21 * Represents a significant difference at P < 0.05. ** Represents a highly significant difference at P < 0.01. Abbreviations: df = degree of freedom; MS = mean square; NAA = naphthylacetic acid; IBA = indole butyric acid. Table 8.
Variation analyses of rooting rate for different NAA and IBA combinations.
-
XI proliferation
(g)X2 proliferation
(g)(X2–X1) proliferation
(g)XI proliferation coefficient X2 proliferation coefficient (X2–X1) proliferation coefficient c1 7.51 17.97 10.46 5.00 11.98 6.97 c2 7.54 14.64 7.10 2.51 4.88 2.37 c3 8.69 15.93 7.25 1.93 3.54 1.61 c4 7.17 10.40 3.23 4.78 6.93 2.15 c5 10.08 12.33 2.25 3.36 4.11 0.75 c6 9.85 16.55 6.70 2.19 3.68 1.49 c7 6.54 11.37 4.83 4.36 7.58 3.22 c8 6.77 13.23 6.47 2.26 4.41 2.16 c9 9.09 19.80 10.71 2.02 4.40 2.38 X1 is the amount of calli proliferation after 15 d of suspension culture, X2 is the amount of calli proliferation after 30 d of suspension culture, (X2–X1) is the difference between the two calli proliferation rates. Proliferation coefficient = (proliferation amount – initial addition amount) / initial addition amount × 100. Table 9.
Results of orthogonal table for calli proliferation.
-
A B C D X1 K1 23.74 21.21 26.68 − K2 27.10 24.38 23.93 − K3 22.40 27.64 22.62 − k1 7.91 7.07 8.89 − k2 9.03 8.13 7.98 − k3 7.47 9.21 7.54 − R 1.57 2.14 1.35 − X2 K1 48.54 39.74 50.10 47.75 K2 39.28 40.20 42.56 44.84 K3 44.41 52.29 39.56 39.63 k1 16.18 13.25 16.70 15.92 k2 13.09 13.40 14.19 14.95 k3 14.80 17.43 13.19 13.21 R 3.09 4.18 3.51 2.71 (X2–X1) K1 24.80 18.52 23.42 23.63 K2 12.18 15.81 18.63 21.03 K3 22.01 24.65 16.94 14.33 k1 8.27 6.17 7.81 7.88 k2 4.06 5.27 6.21 7.01 k3 7.34 8.22 5.65 4.78 R 4.21 2.95 2.16 3.10 Range = k(max) − k(mix); K1A = XA1 + XA2 + XA3, K2A = XA4 + XA5 + XA6, K3A = XA7 + XA8 + XA9…; kx = Kx/number of levels. Table 10.
Weight range analysis of suspension proliferation.
-
Variation source Sum of squares df MS F P-value X1 Type of medium 9.36 2 4.68 0.917 0.413 Addition of initial calli amount 100.107 2 50.053 37.797 0.000** Addition of initial liquid amount 7.167 2 3.583 0.69 0.511 X2 Type of medium 26.825 2 3.412 1.475 0.249 Addition of initial calli amount 143.564 2 71.782 16.969 0.000** Addition of initial liquid amount 33.632 2 16.816 1.909 0.170 Liquid retention 20.283 2 10.142 1.083 0.355 (X2-X1) Type of medium 140.251 2 70.125 9.863 0.001** Addition of initial calli amount 62.952 2 31.476 3.047 0.066 Addition of initial liquid amount 18.190 2 9.095 0.746 0.485 Liquid retention 71.879 2 35.939 3.609 0.043* df: degree of freedom; MS: mean square; Sig.: significance; * Represents a significant difference at P < 0.05. ** Represents a highly significant difference at P < 0.01. Table 11.
Variation analyses for suspension proliferation.
Figures
(4)
Tables
(11)