-
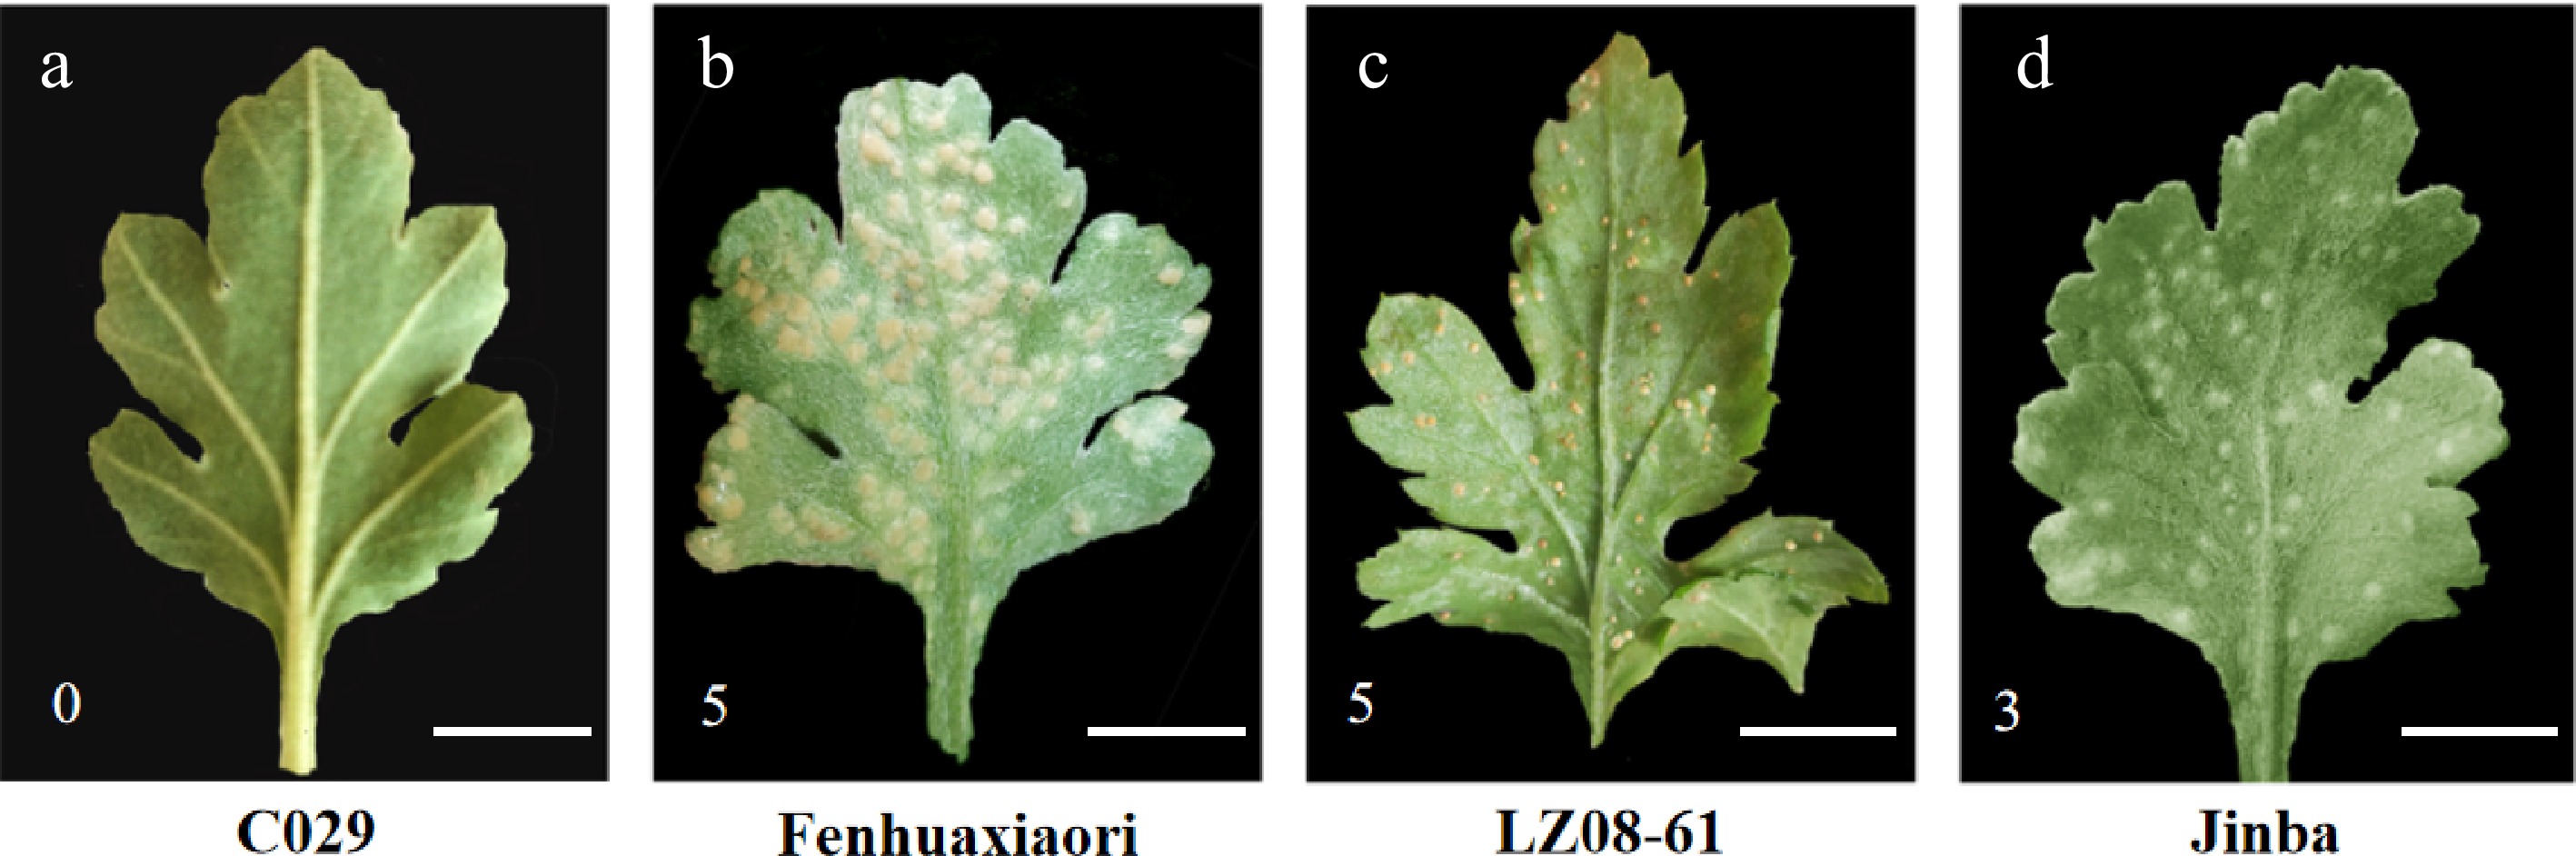
Figure 1.
The phenotype of the abaxial of the leaves of Chrysanthemum in the stage of symptom appearance. (a)−(d) showed the highly resistant cultivar 'C029' and susceptible cultivars 'Fenhuaxiaori', 'LZ08-61', and 'Jinba', respectively. The scale bar represents 1 cm. 0 is immune, represents no visible symptoms; 5 is highly susceptible, represents yellowish necrosis and clear telia were same as the third-class, but telia crowded together, telia was more 1/2 of the whole leaf; 3 is susceptible, represents yellowish necrosis and clear telia on the back, larger and less, or smaller and more, total telia area was no more than 1/4 of the whole leaf.
-
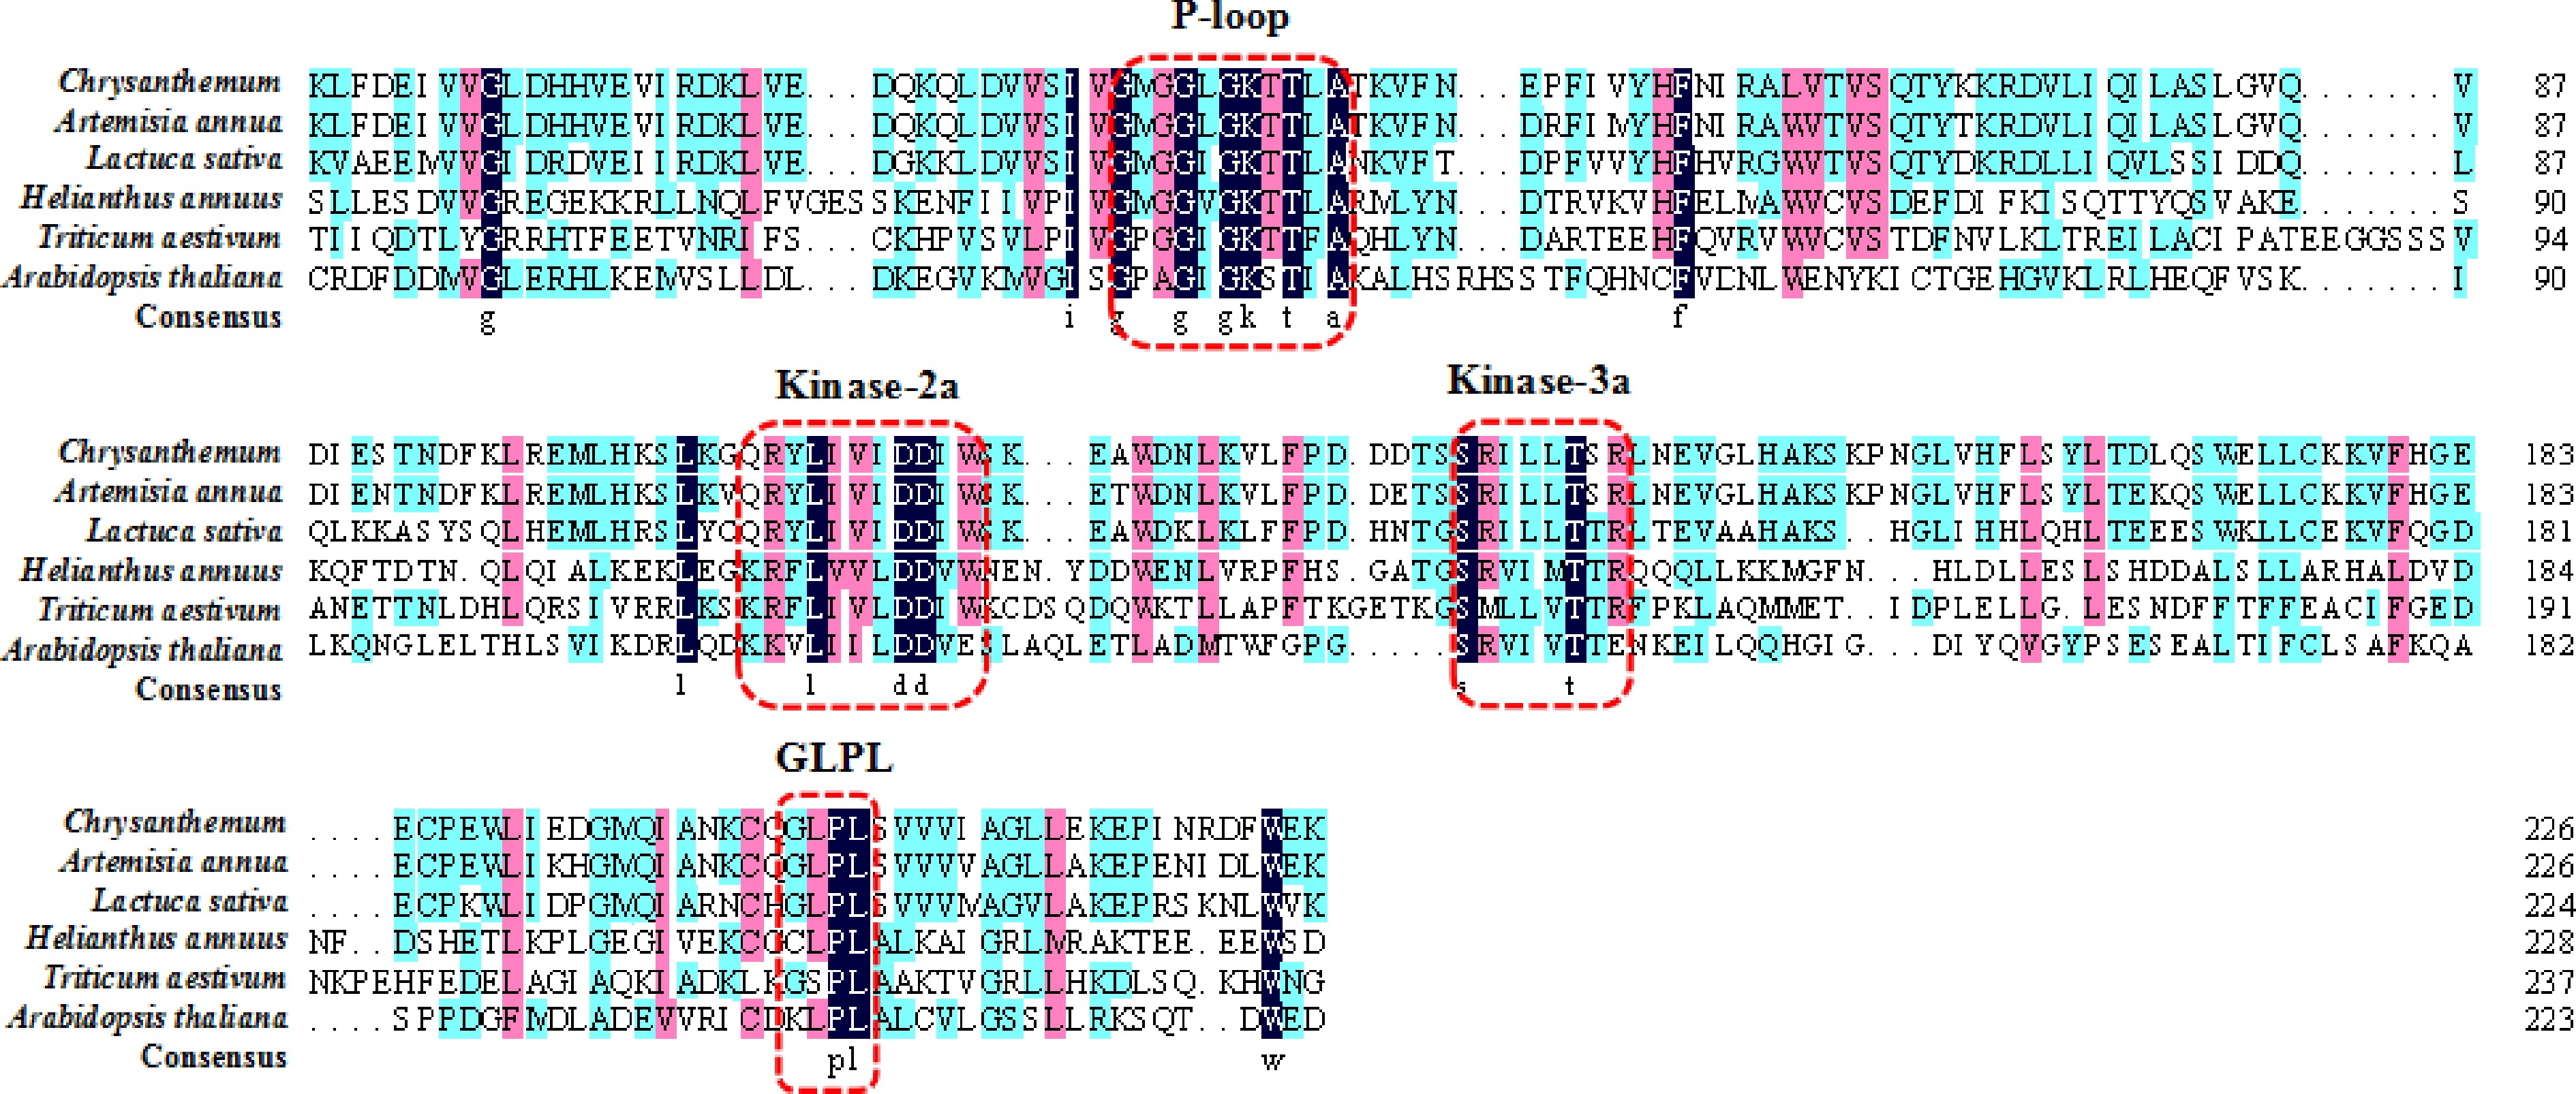
Figure 2.
The NBS conserved domain in different plants. Conserved domains are marked with dashed red lines.
-
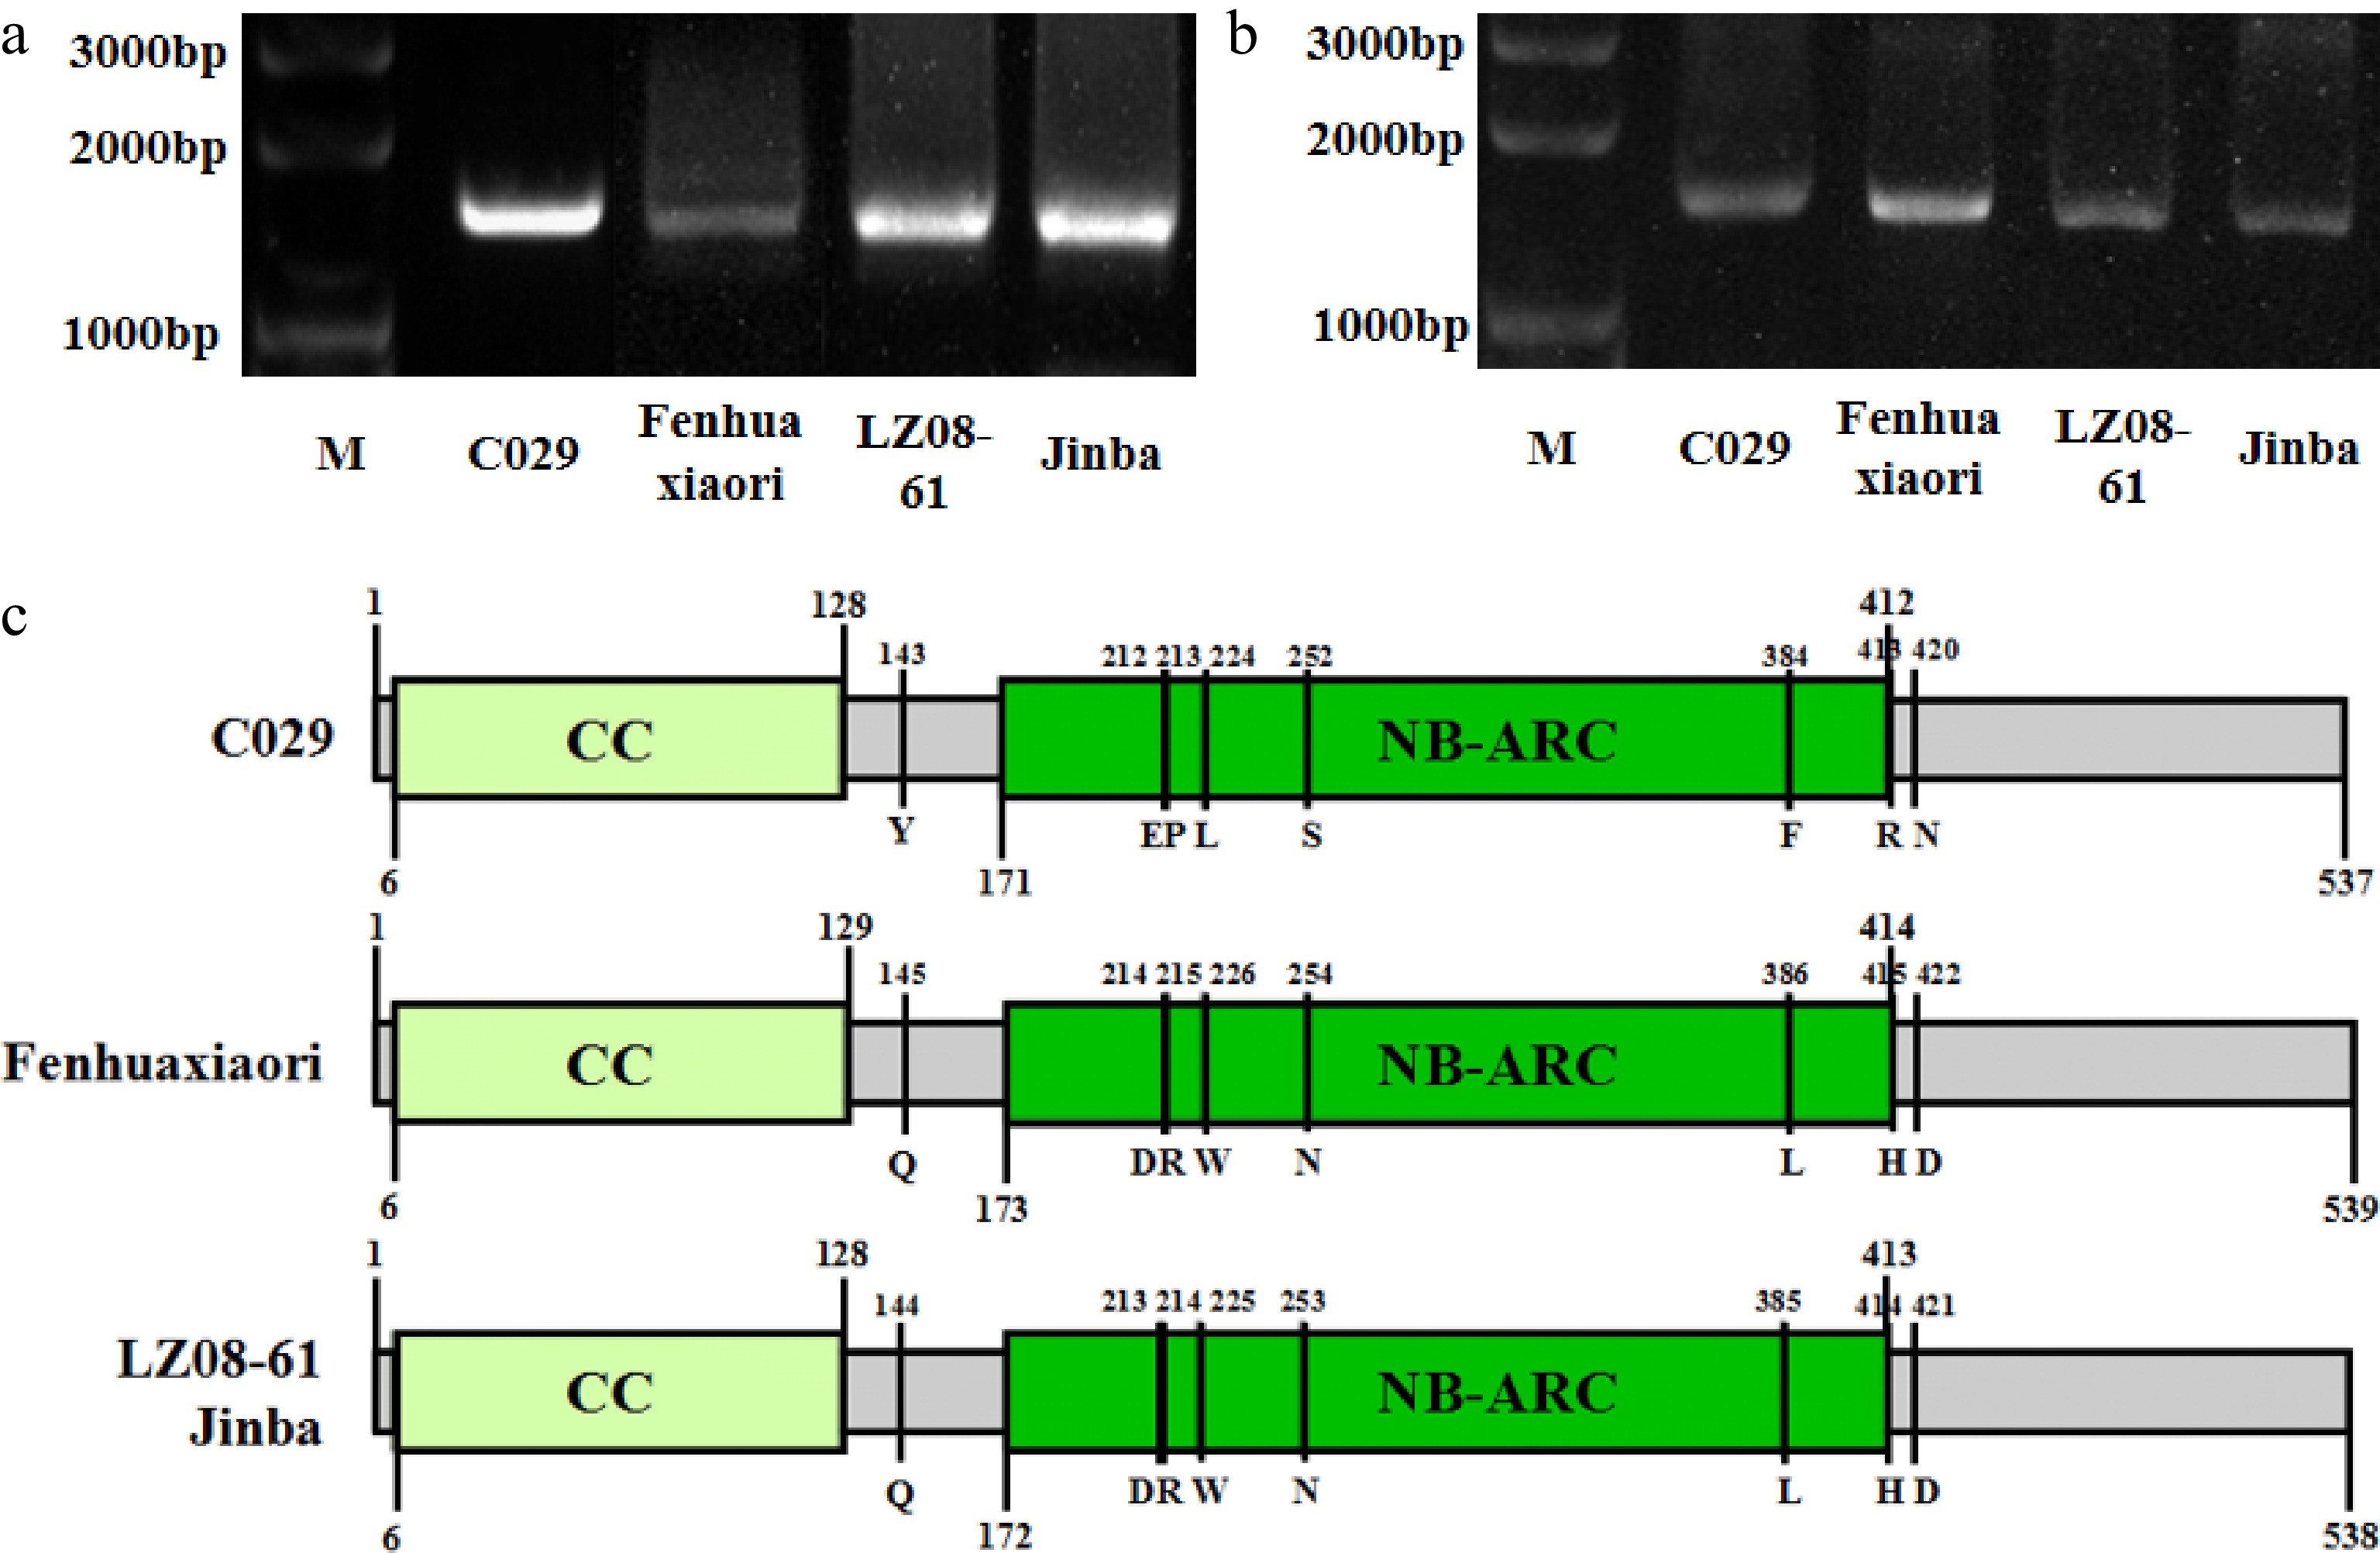
Figure 3.
Amplification and conserved domain prediction of CHR00059759 in highly resistant and susceptible cultivars. (a) PCR amplification of the genomic sequence of CHR00059759 in cultivars 'C029', 'Fenhuaxiaori', 'LZ08-61', and 'Jinba', respectively. (b) Amplification of the coding sequence of CHR00059759 in cultivars 'C029', 'Fenhuaxiaori', 'LZ08-61', and 'Jinba', respectively. M, DNA marker. (c) The structure of CHR00059759 in the four cultivars. Gray boxes indicate exons of CHR00059759 gene. Yellow and green indicate the CC and NB-ARC conserved domain, respectively. Several unique variations between the highly resistant- and susceptible- cultivars were omitted.
-
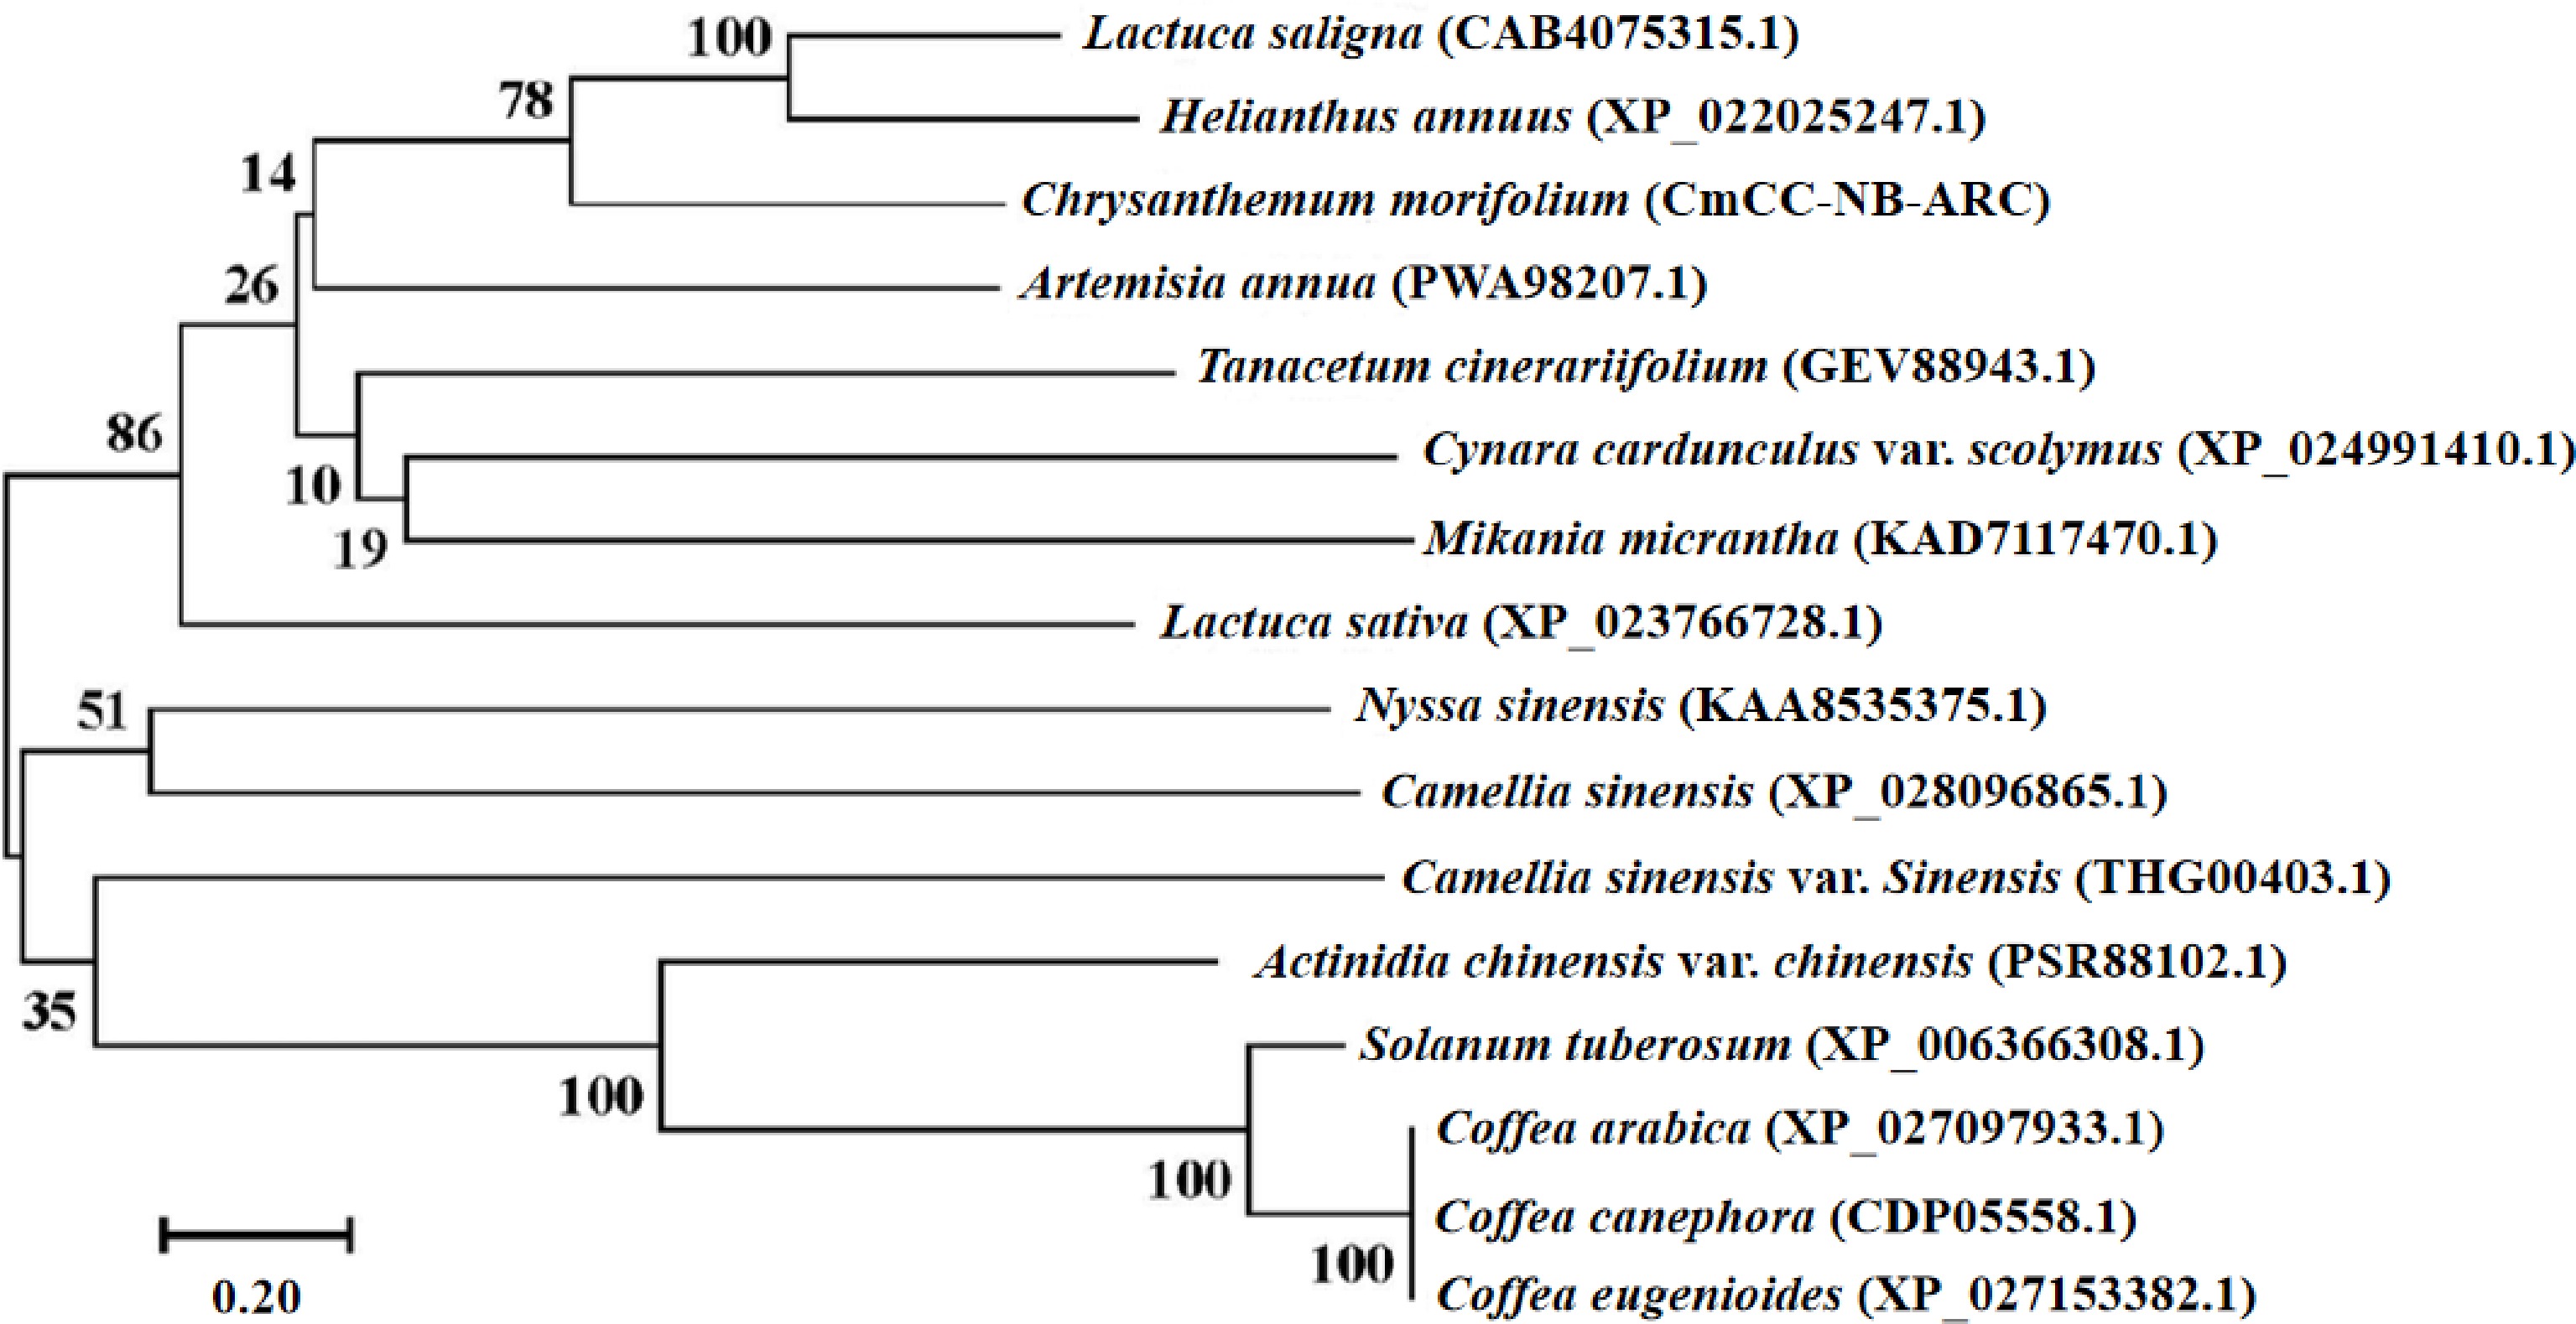
Figure 4.
The phylogenetic tree of the CmCC-NB-ARC. The phylogenetic tree was constructed by the neighbor-joining method[[57]]. The percentage of replicate trees in which the associated taxa clustered together in a bootstrap test (1000 replications) is shown next to the branches[[58]]. In the guided test (1000 replicates), the percentage of replicate trees with related taxa clustered together is shown next to the branch. The evolutionary distances were computed using the Poisson correction method and given in units of amino acid substitutions per site[[61]]. All ambiguous positions for each sequence pair were removed.
-
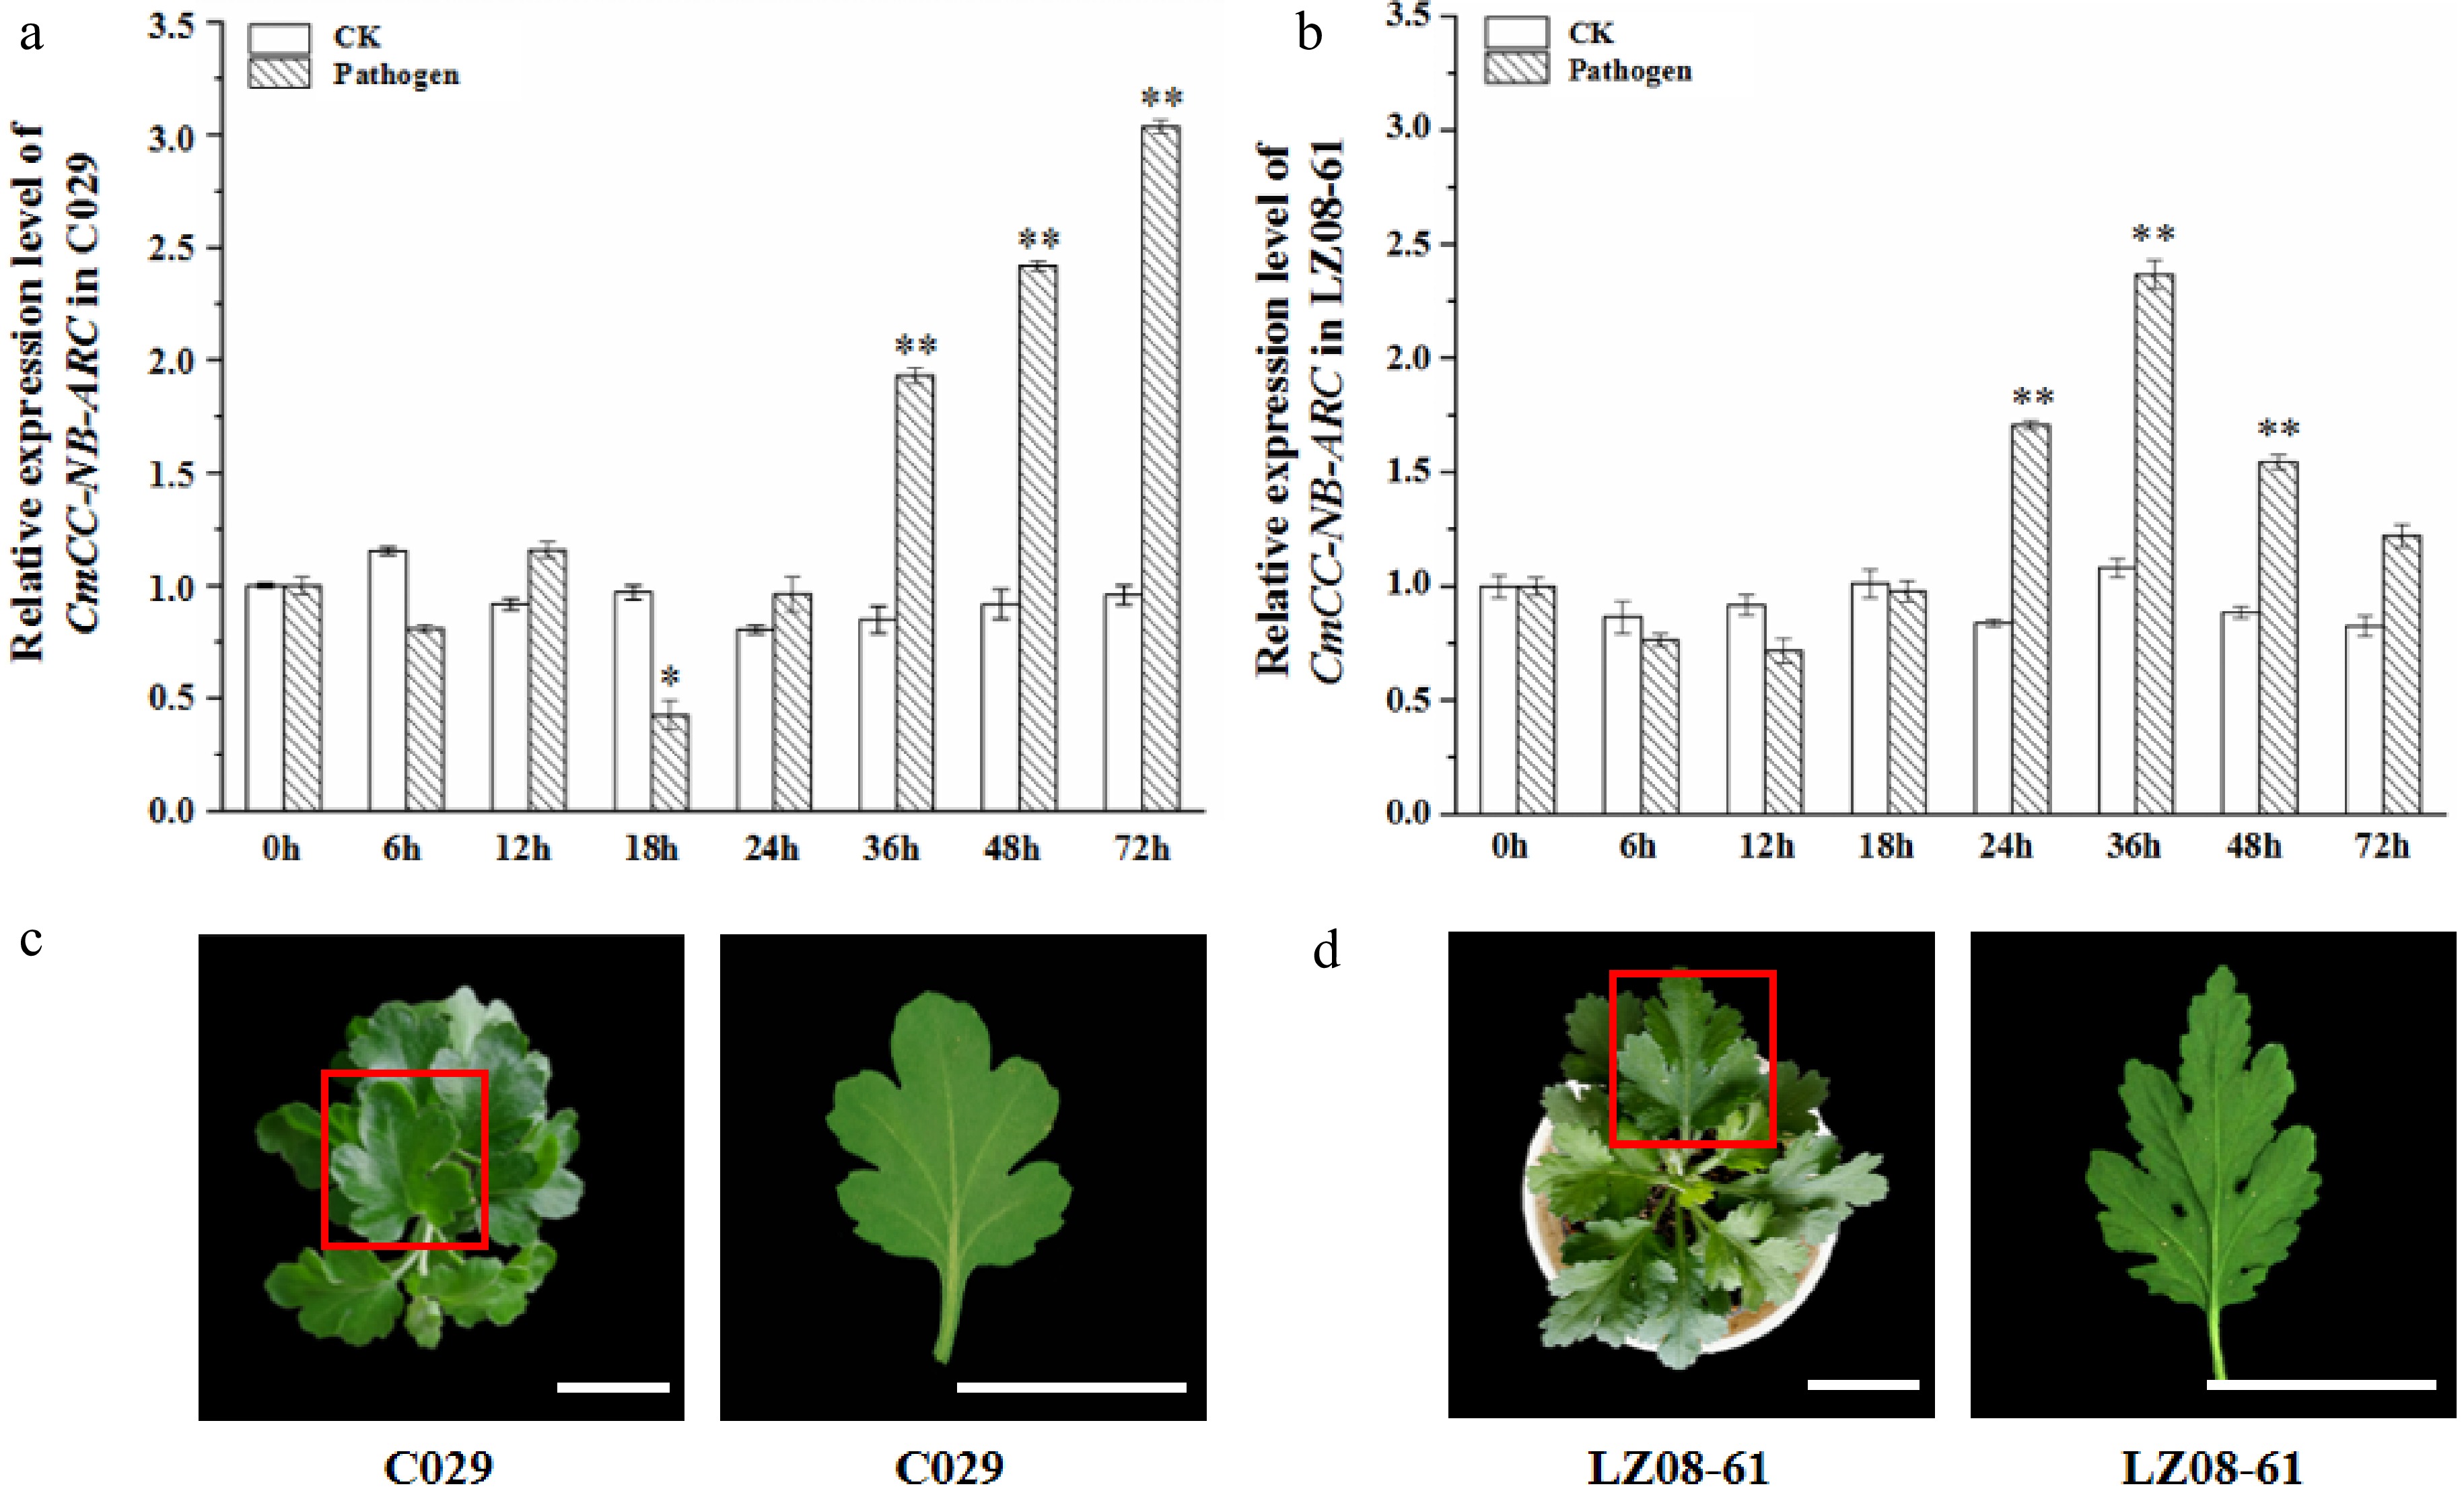
Figure 5.
Transcription profiling of CmCC-NB-ARC and phenotype of the highly resistant cultivar 'C029' and susceptible cultivar 'LZ08-61' at one month after inoculation with P. horiana. (a), (b) Relative expression level of CmCC-NB-ARC in the highly resistant cultivar 'C029' and susceptible cultivar 'LZ08-61'. The leaf under inoculation for 0 h (before inoculation) is the control. CmACTIN served as an equal loading control. The error bars represent standard errors of three biological replicates. The asterisks on the error bars represent significant differences at the same time point of both under inoculation of with the fungus resuspended in buffer and sterile water. Asterisks represent significant differences using a t-test with three repeats (* p < 0.05, ** p < 0.01). (c), (d), Phenotypes of 'C029' and 'LZ08-61' plants at one month after inoculation with P. horiana. The red box represents the single leaf which was used for morbidity observation. Scale bar = 3 cm.
-
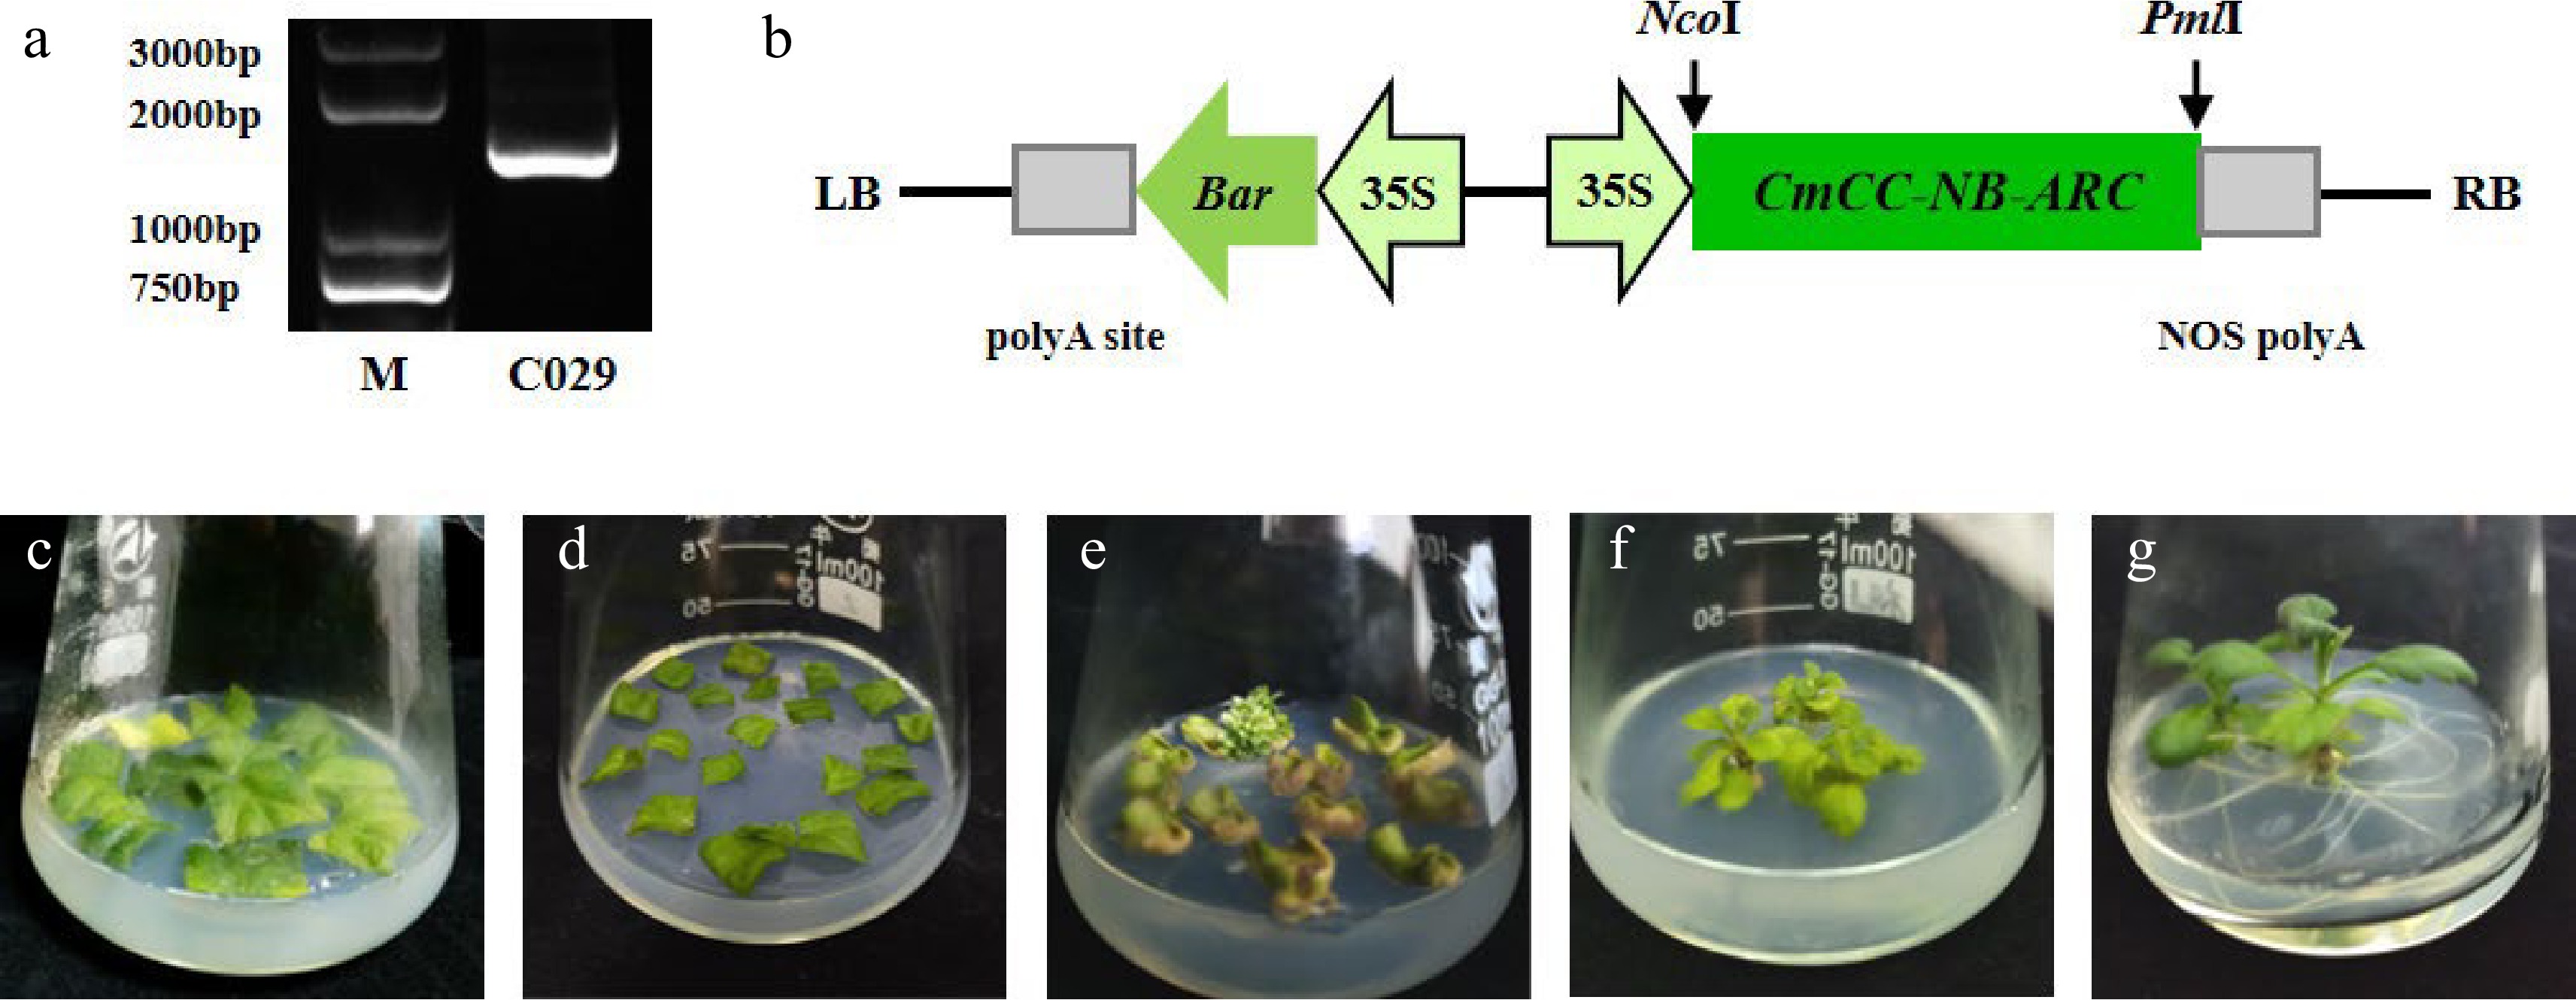
Figure 6.
Construction of the recombinant overexpression vector and genetic transformation. (a) The specific fragment of CmCC-NB-ARC in 'C029' on the agarose gel. (b) Schematic of overexpression cassette of the gene. (c)–(g) The procedure of Agrobacterium-mediated transformation. (c) Leaf discs were pre-cultured. (d) Leaf discs were cultured after being immersed with Agrobacterium. (e) Regenerated kanamycin-resistant buds. (f) Rooting. (g) Seedling.
-
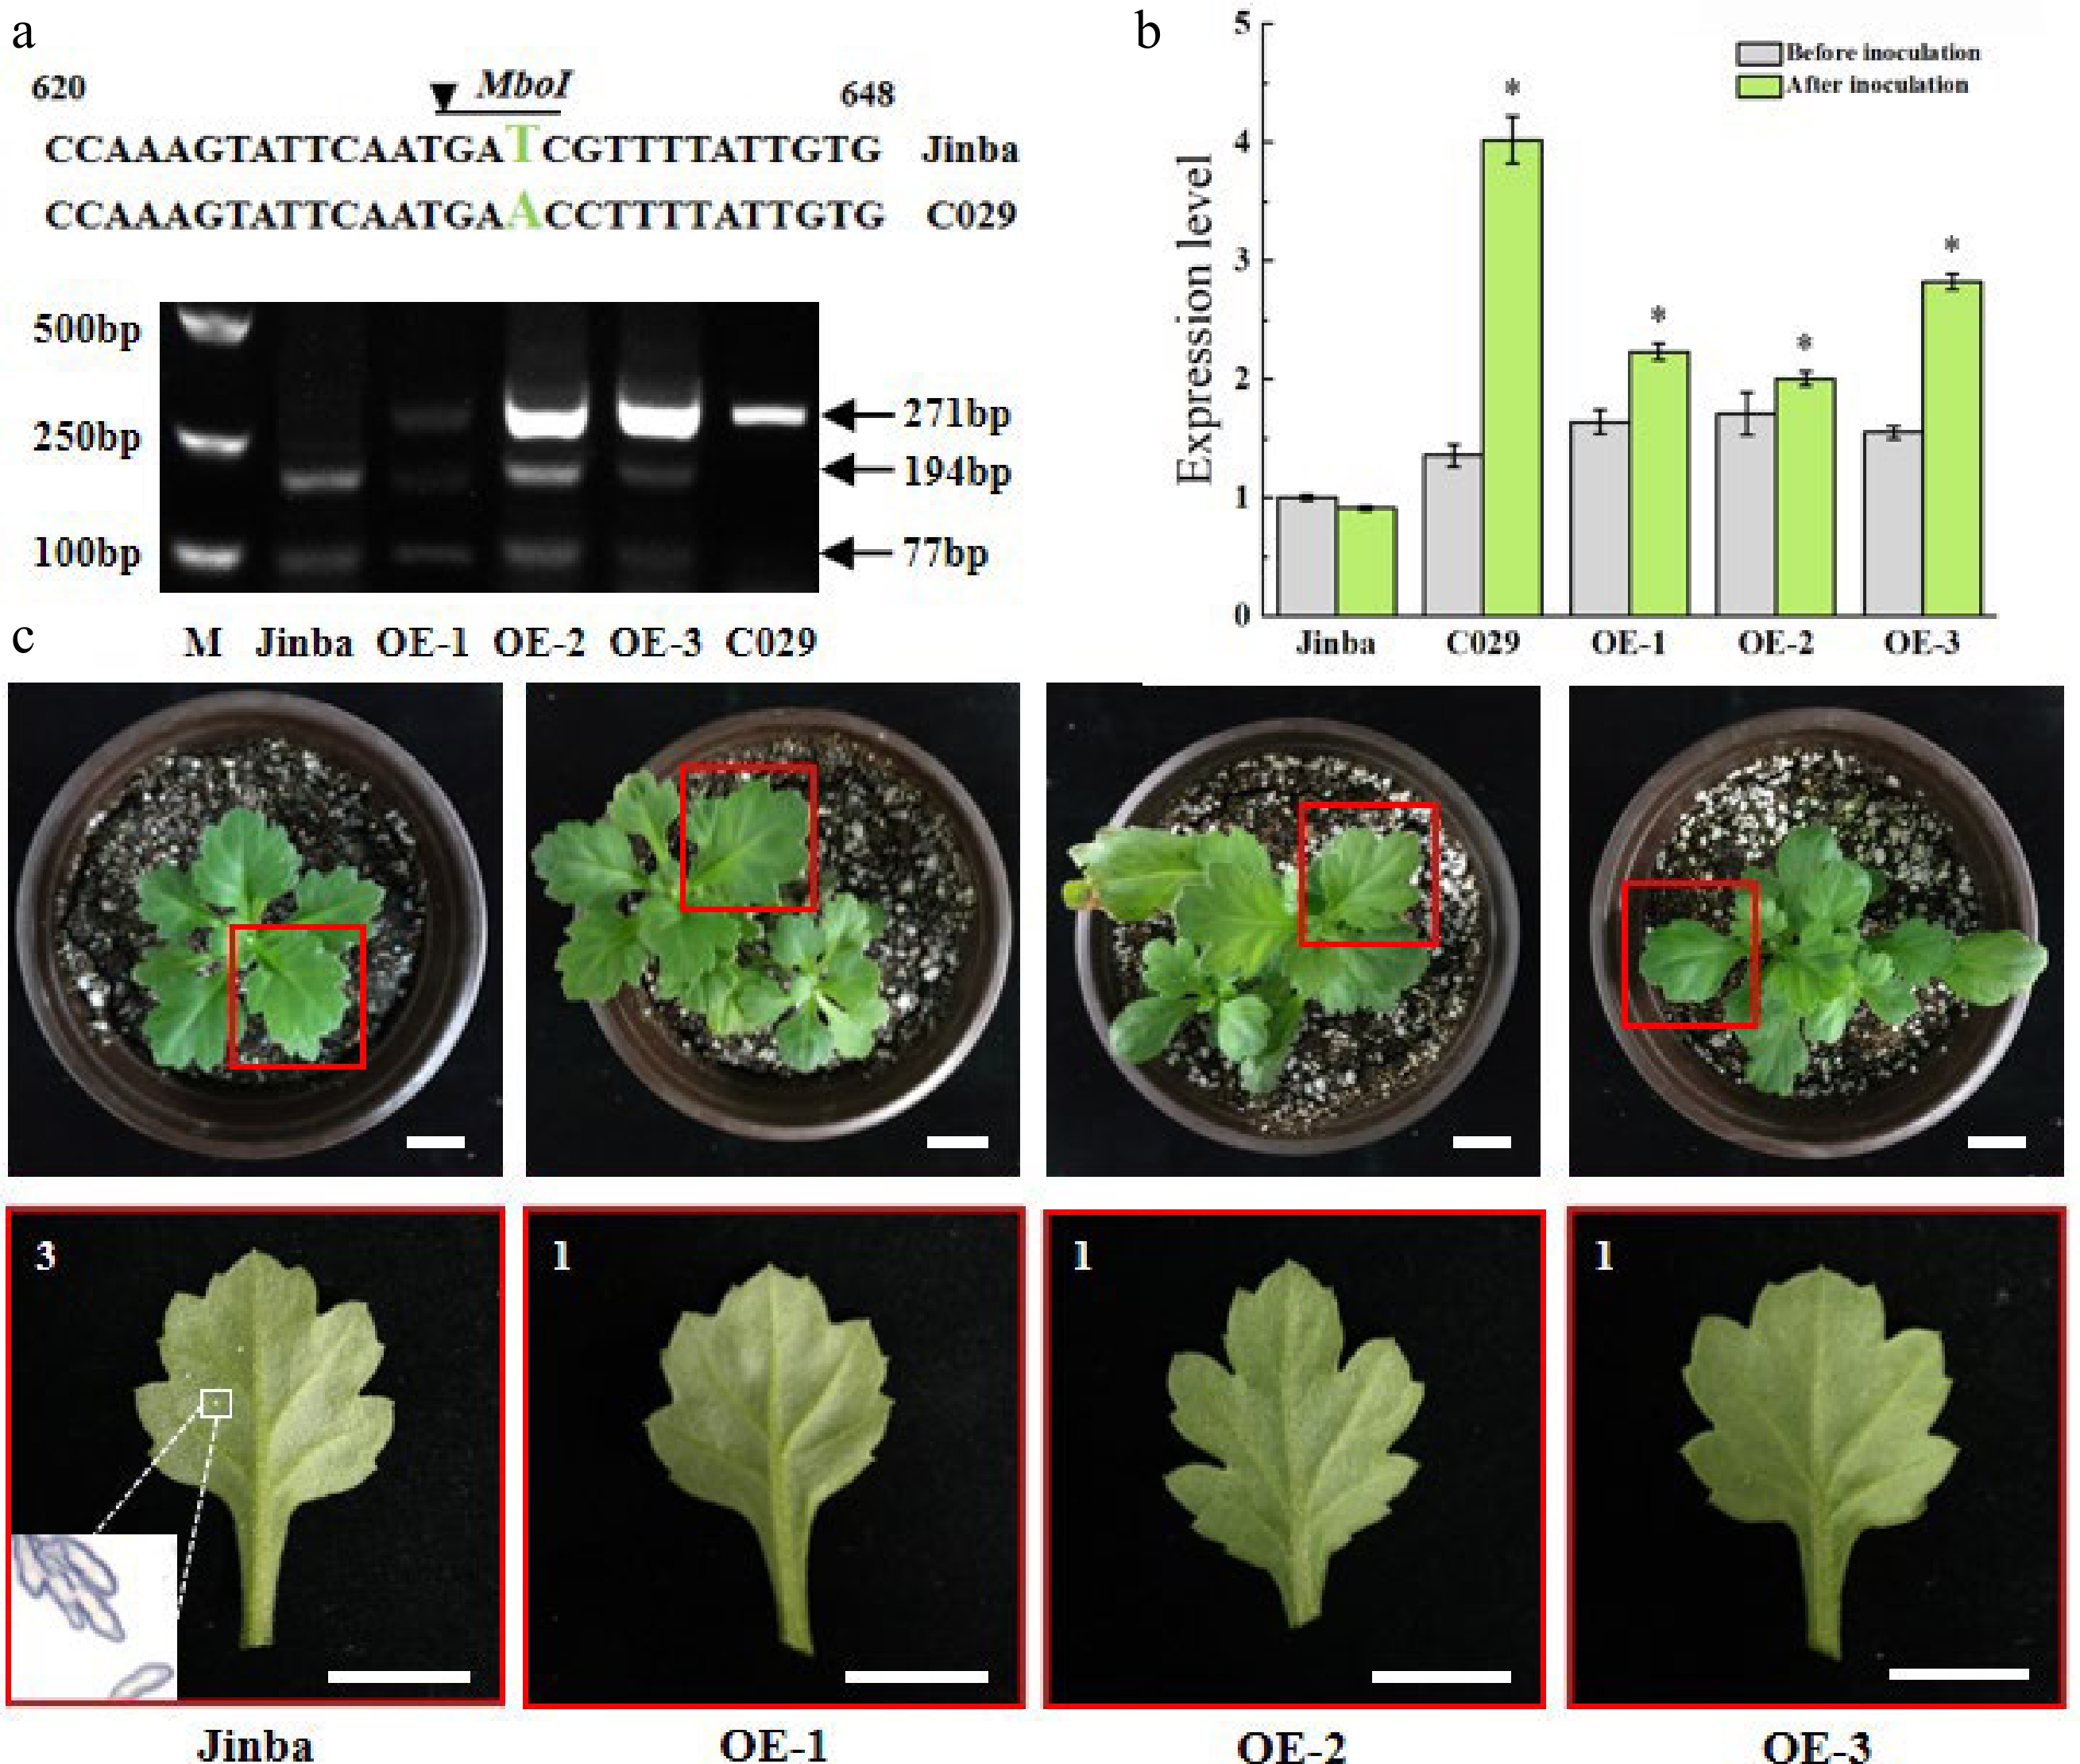
Figure 7.
Characterization of overexpressing plants. (a) The specific fragments indicate the digested PCR products by restriction enzyme MboI in the two wild types and the three transgenic individuals, respectively. Fragments 271bp represent the size of the amplified product without the cutting site of restriction enzyme. Fragments 194bp and 77bp represent the size cleaved by the enzyme. (b) Relative expression levels of CmCC-NB-ARC in the two wild types and the transgenic individuals before inoculation and at 48 h after inoculation, respectively. Asterisks represent a significantly different expression level to that of ‘Jinba’, as determined using a t-test with three repeats. (*p < 0.05). (c) Phenotypes of the transgenic lines at 15 d after inoculation. The red box indicates leaves were selected to be observed in the potted plant. The white box indicates the telia from diseased spots under a microscope of 200×. Scale bars = 2 cm. 3 is susceptible, represents yellowish necrosis and clear telia on the back, larger and less, or smaller and more, total telia area was no more than 1/4 of the whole leaf. 1 is highly resistant, represents rare visible whitish or yellowish necrotic or chlorotic lesions are discernible.
Figures
(7)
Tables
(0)