-
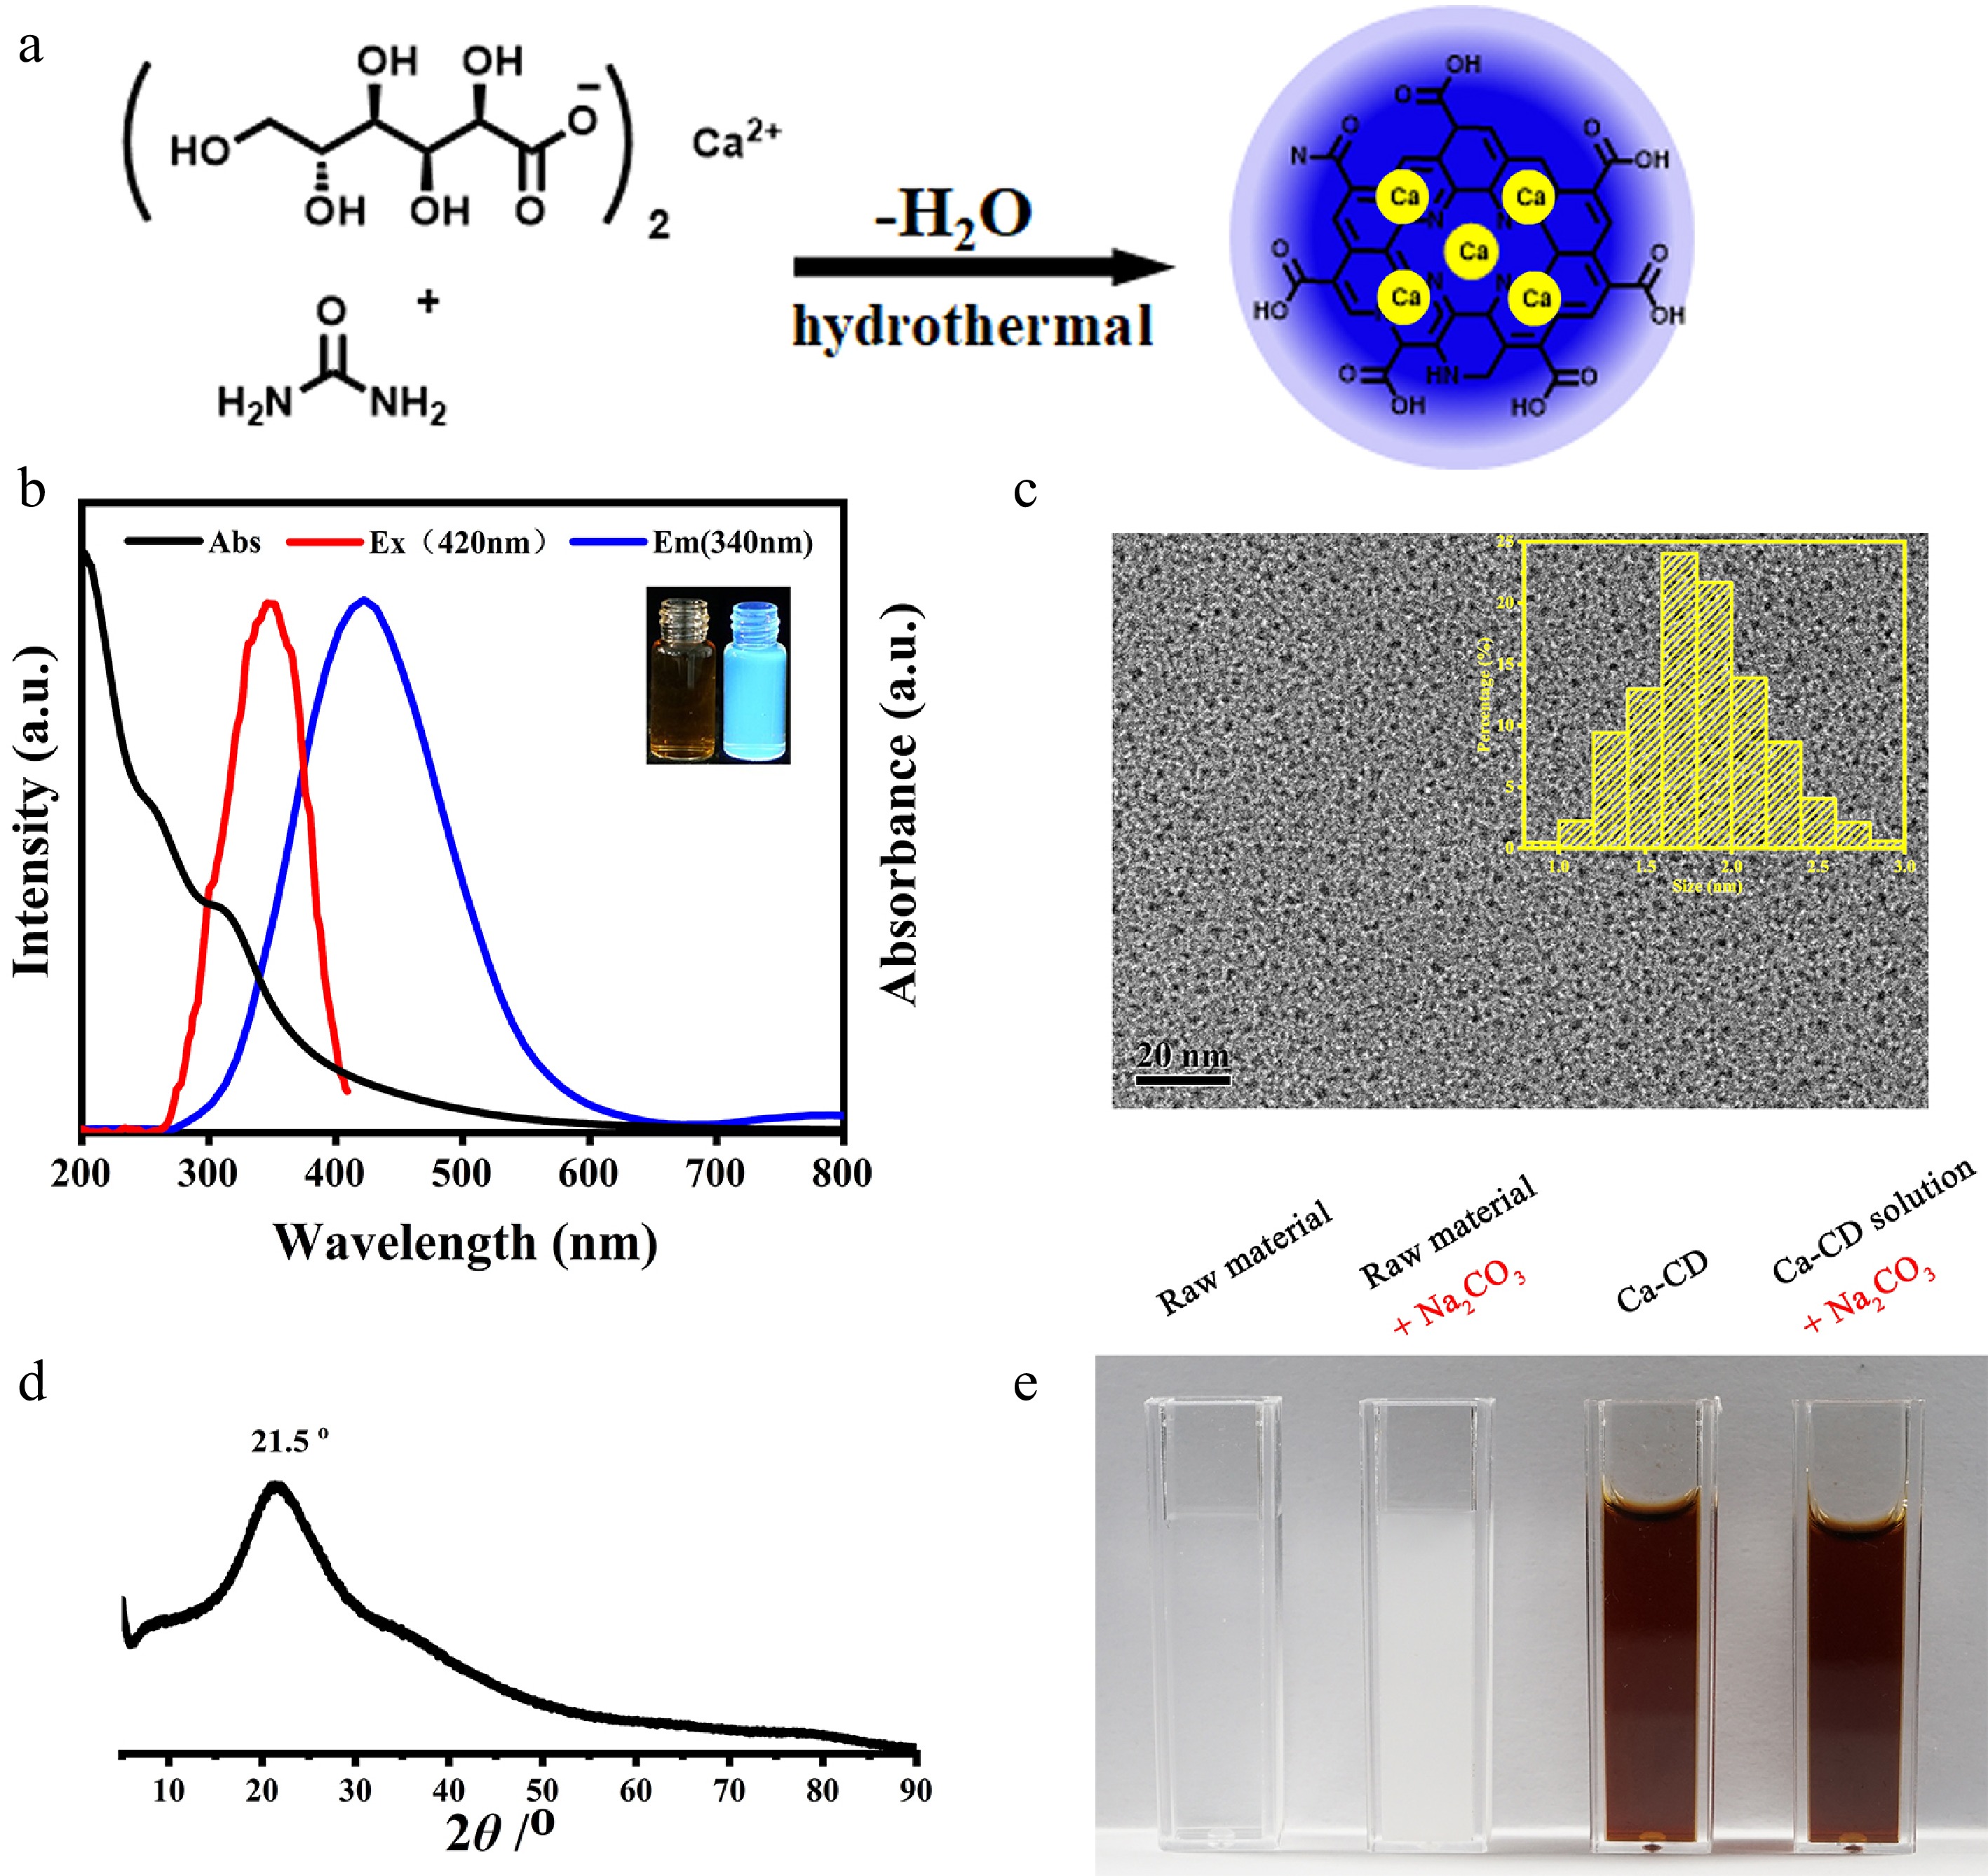
Figure 1.
Characterization of Ca-encapsulated CDs. (a) Illustration of the synthesis of Ca-CDs. (b) UV-Vis absorption, FL excitation and emission spectra of Ca-CDs (insert: Images of Ca-CDs under daylight and 365 nm exciting light illustration). (c) TEM images of Ca-CDs (insert: Size distribution of as-prepared Ca-CDs). (d) XRD spectrum of Ca-CDs. (e) Images after the addition of Na2CO3 into the raw material solution and the crude Ca-CDs solution.
-
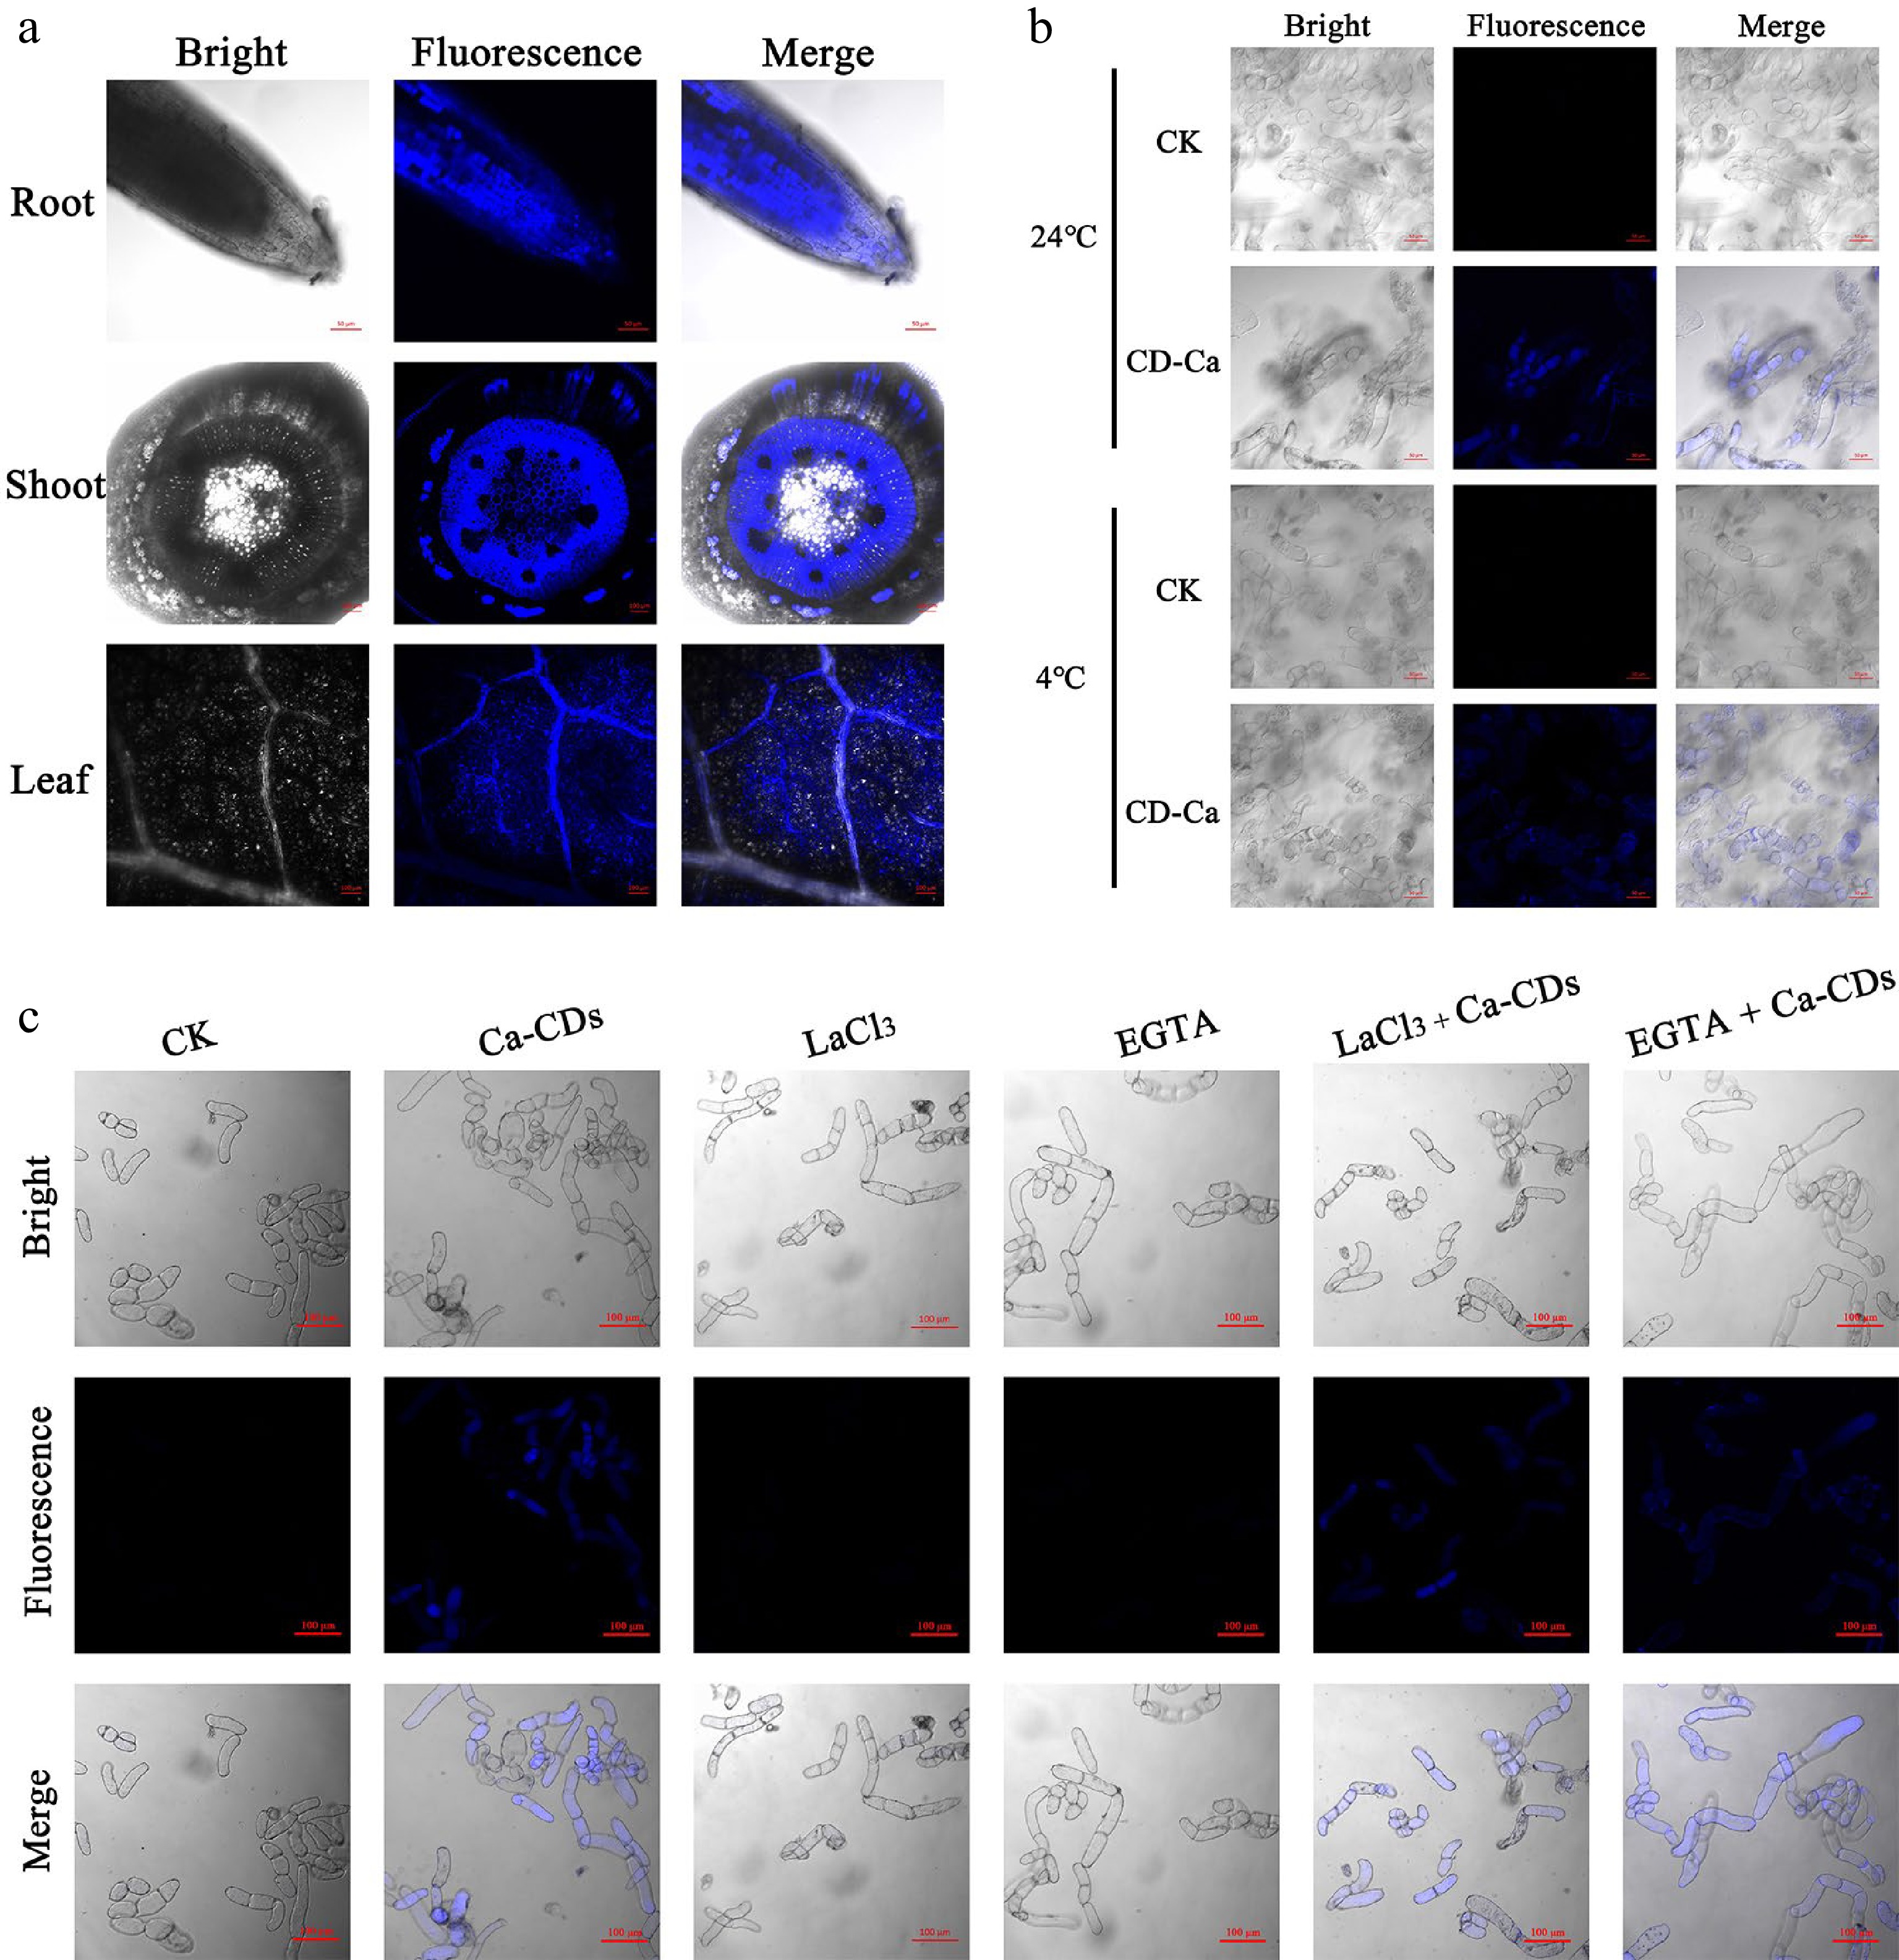
Figure 2.
Uptake, transport and distribution of Ca-CDs. (a) Confocal microscopy images of Ca-CDs localization in the roots, stems and leaves of apple seedlings. (b) Uptake of Ca-CDs in 'Orin' apple calli cells at 24 °C and 4 °C. (c) Images of calli cells after different treatments with Ca-CDs, EGTA and LaCl3. The confocal images were obtained with the LSM880 confocal microscope (405 nm excitation, 410−585 nm collection).
-
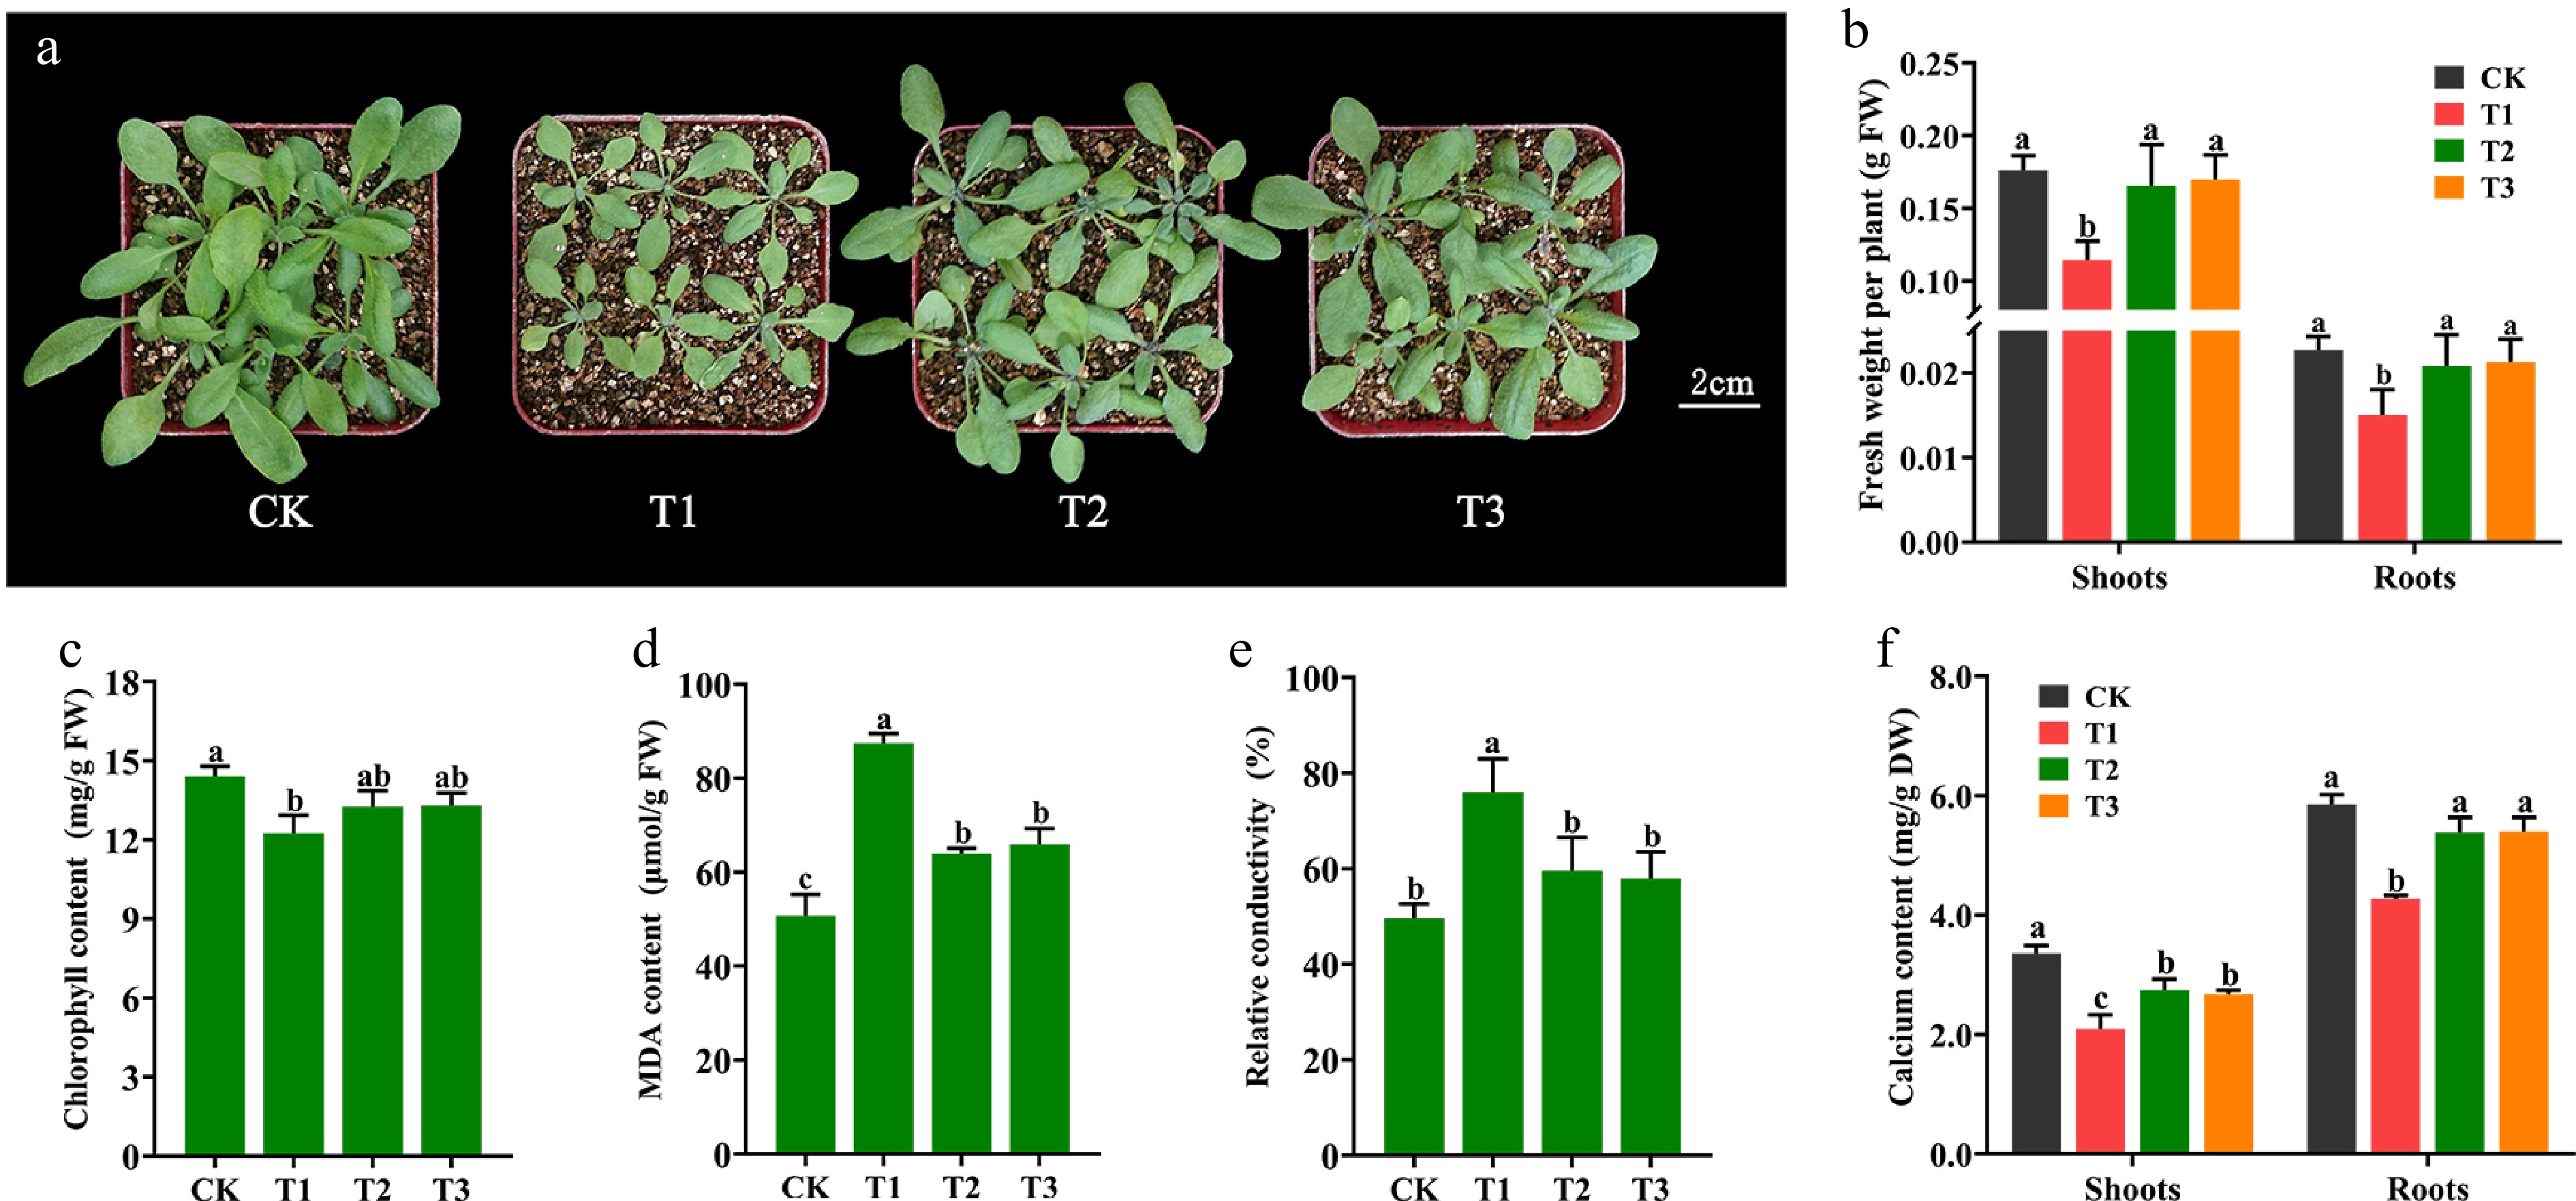
Figure 3.
Effect of Ca-CDs treatment on Arabidopsis seedlings. (a) Arabidopsis seedlings grown under Ca-sufficient (CK) and -deficient (T1) conditions for 14 d. T1 seedlings were then treated with 1,000 mg/L Ca-CDs (T2) and 5 mM CaCl2 (T3) solution for 10 d, respectively. (b) Fresh weight, (c) chlorophyll content, (d) MDA content, (e) RCD and (f) calcium content of Arabidopsis seedlings.
-
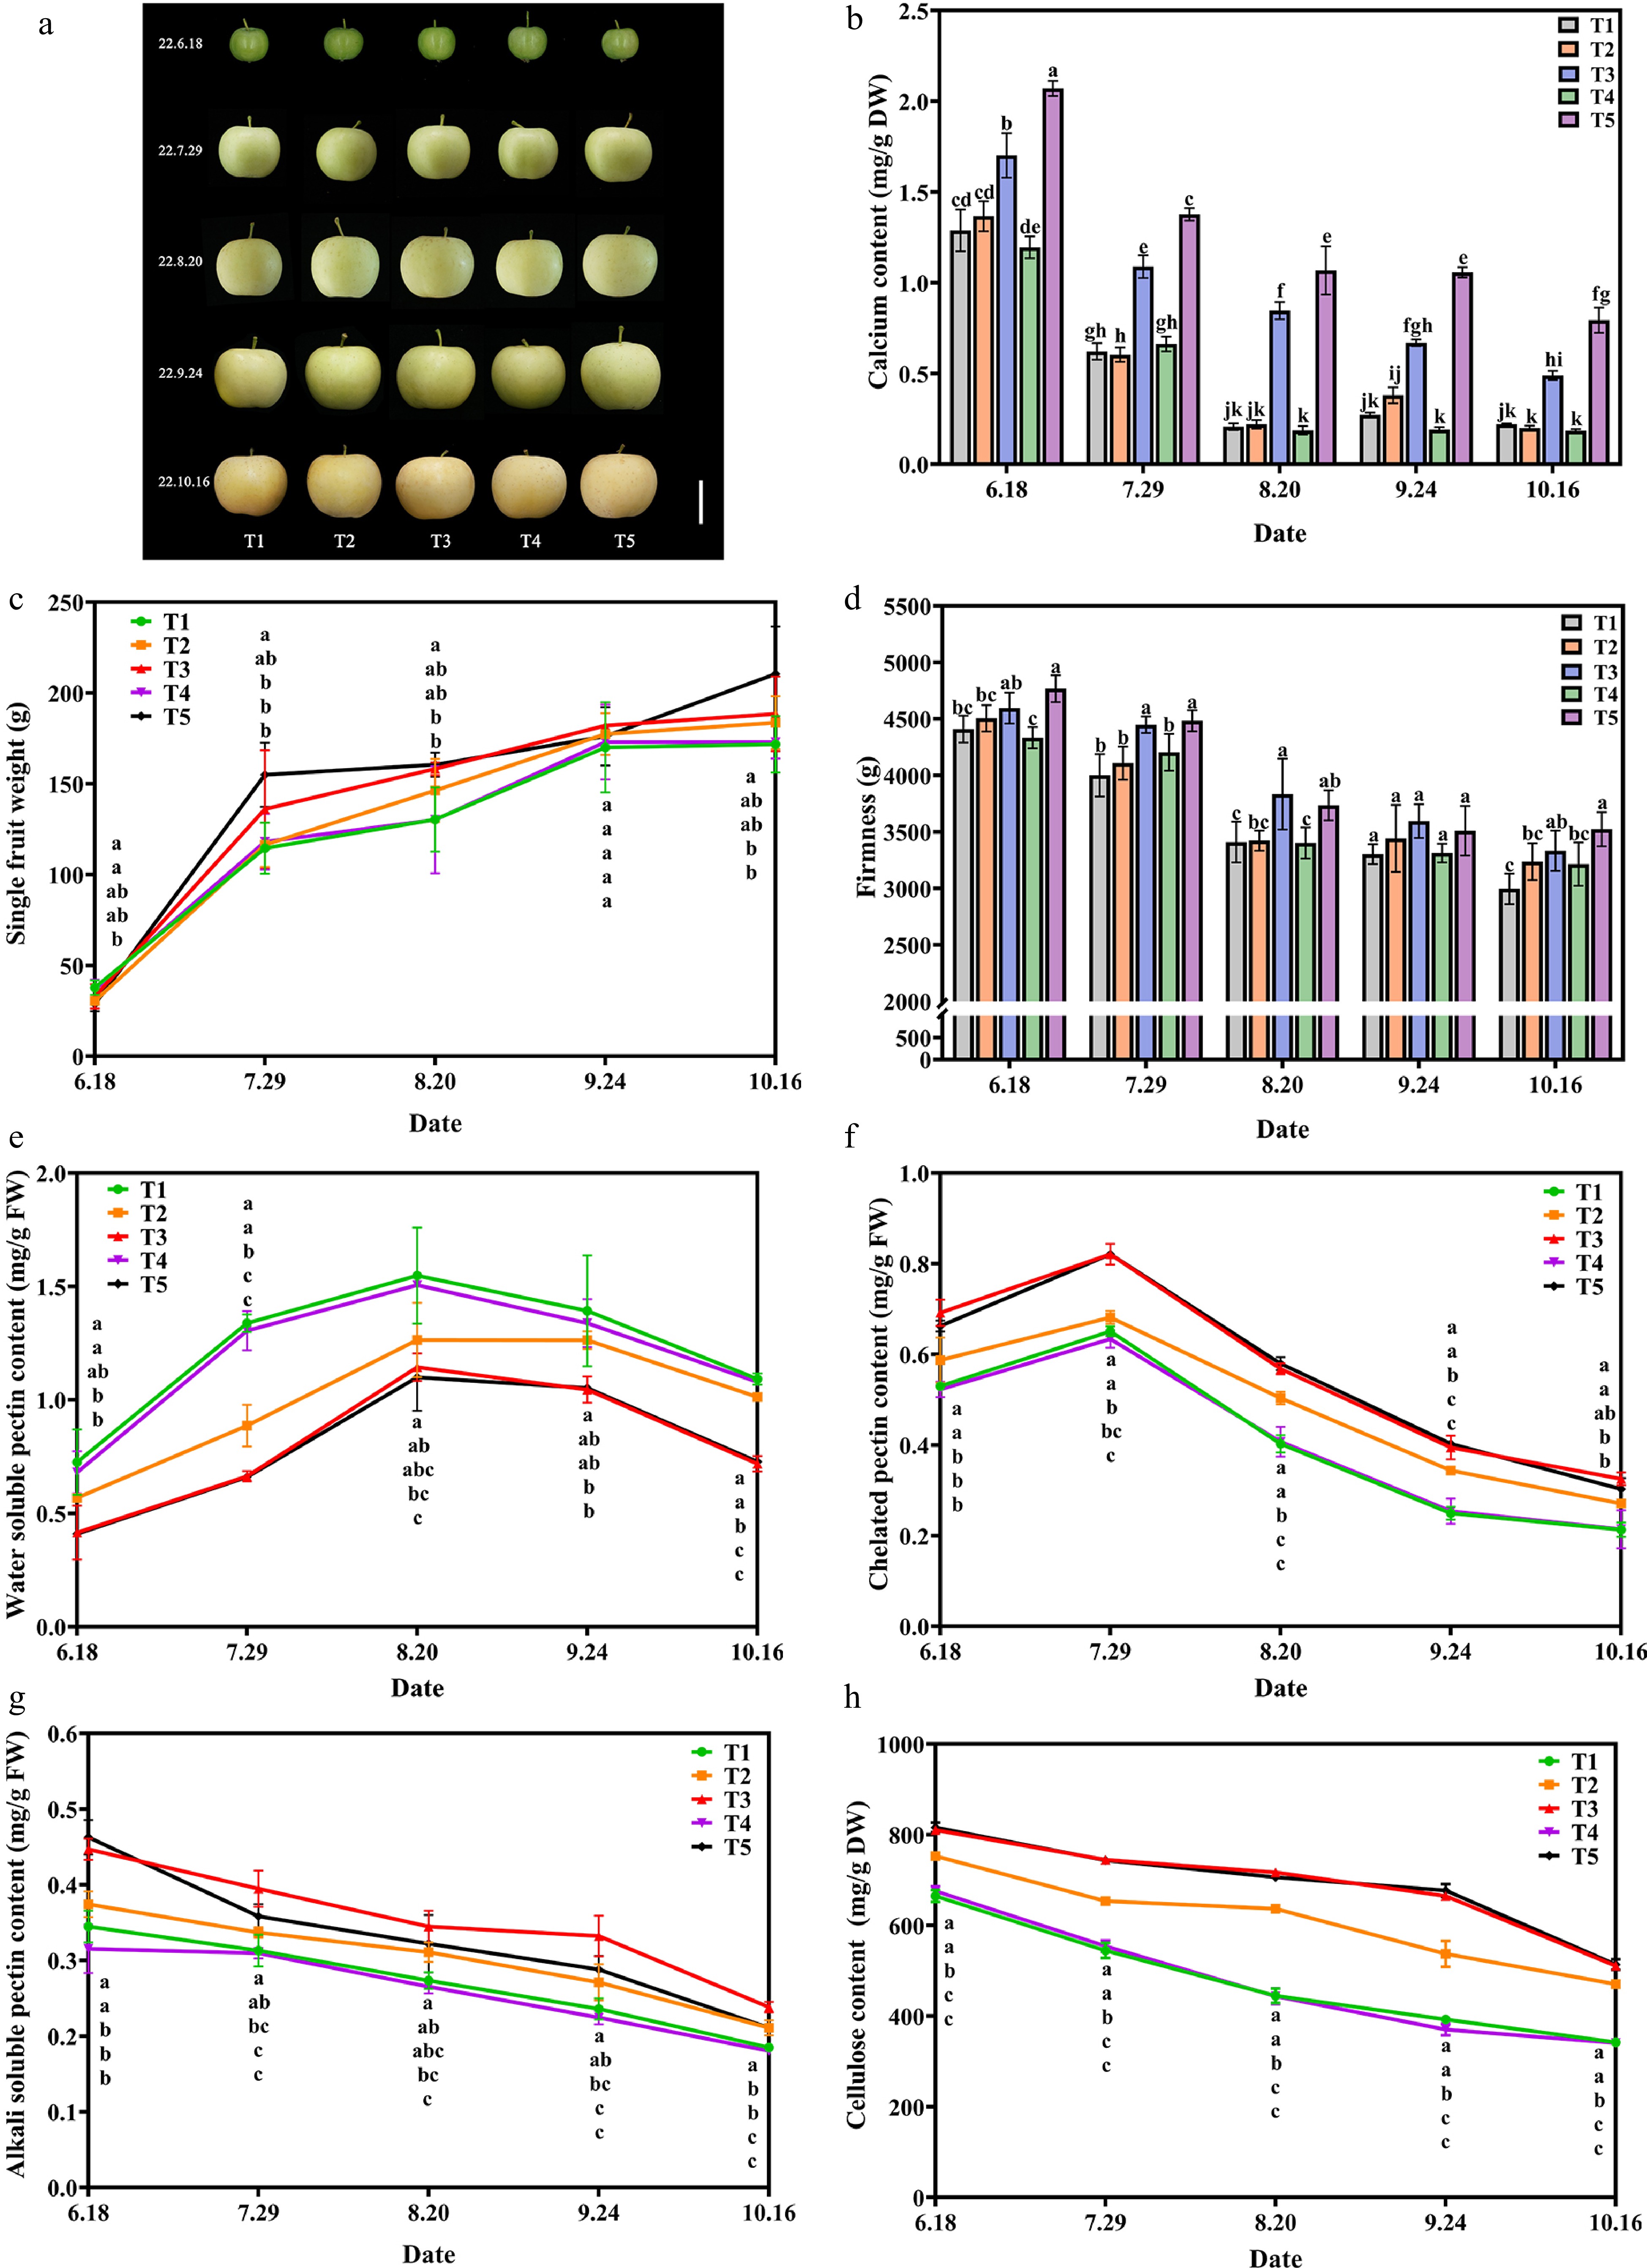
Figure 4.
Effect of exogenous Ca-CDs on apple fruit. (a) Phenotypic images, (b) calcium content, (c) weight per fruit, (d) fruit hardness, (e) water-soluble pectin, (f) chelated pectin, (g) alkali-soluble pectin and (h) cellulose content of apple fruits under different treatments.
Figures
(4)
Tables
(0)