-
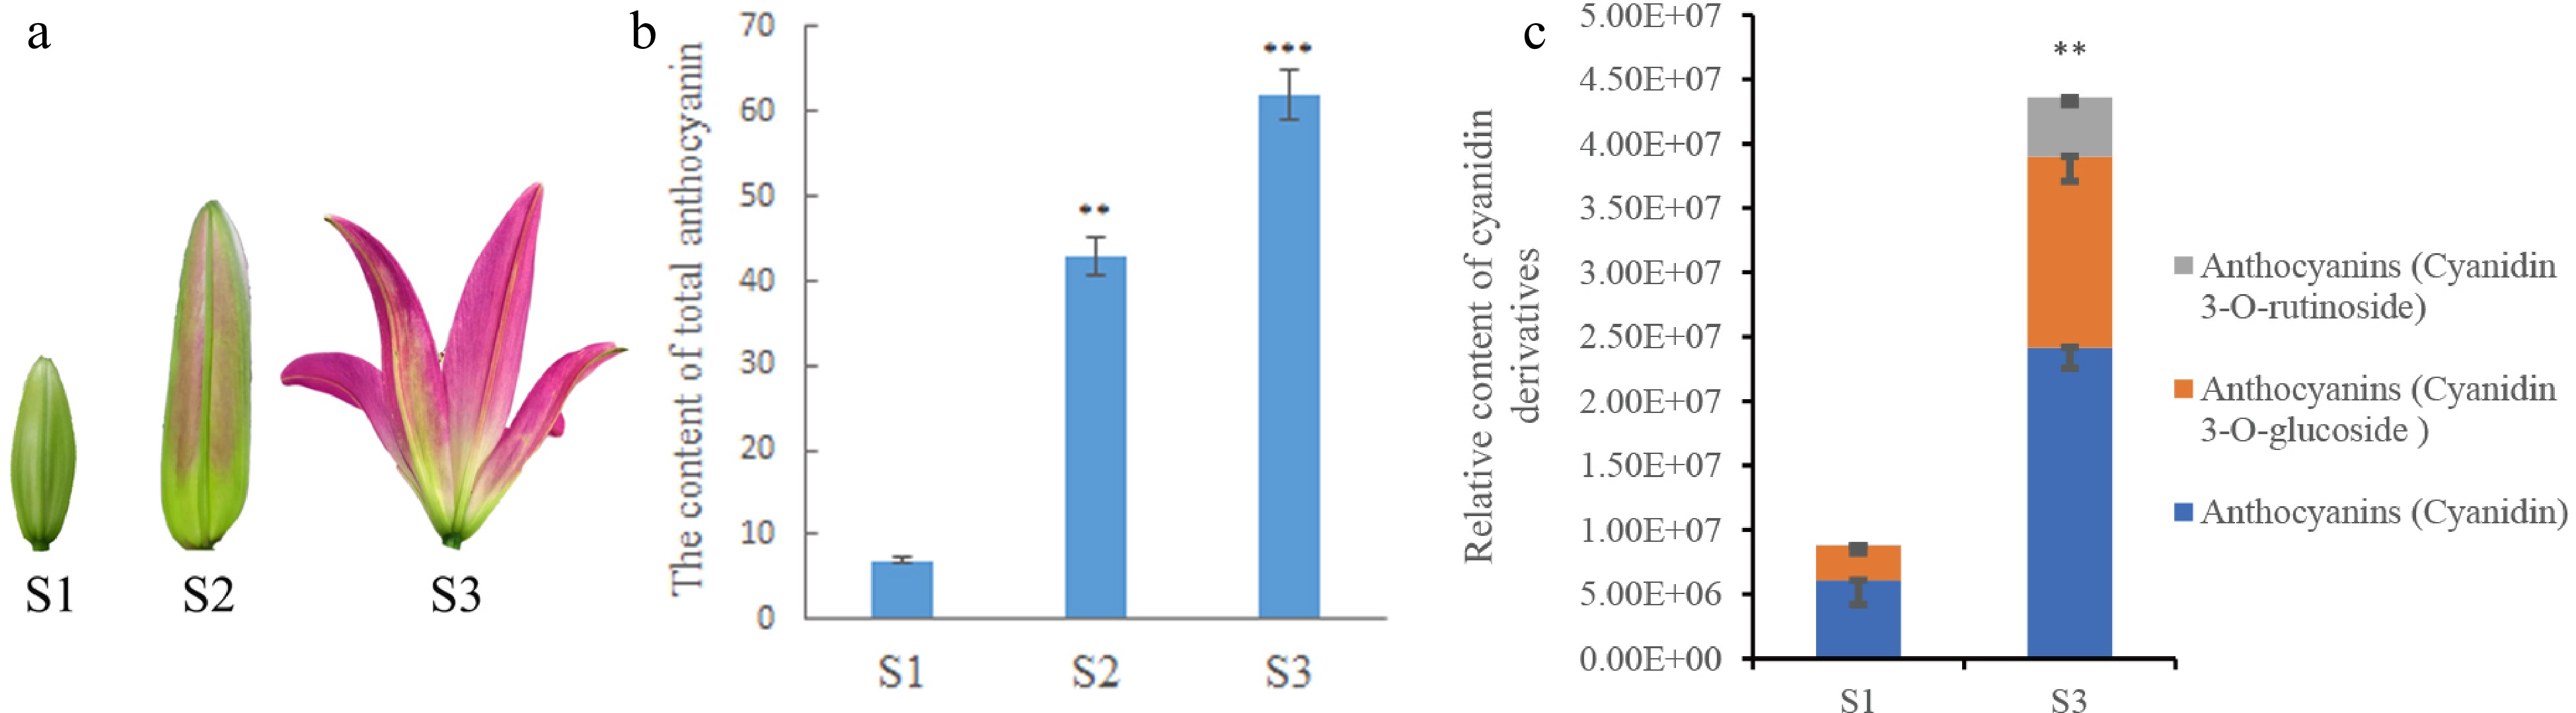
Figure 1.
Determination of anthocyanin content in lily petals. (a) Lily petals in different periods. (b) Anthocyanin content in lily petals at different periods of lily development. (c) The relative content of cyanidin and its compounds in petals determined in metabolomics analysis. * Denotes statistically significant differences between samples. * p-value ≤ 0.1; ** p-value ≤ 0.05; *** p-value ≤ 0.01.
-
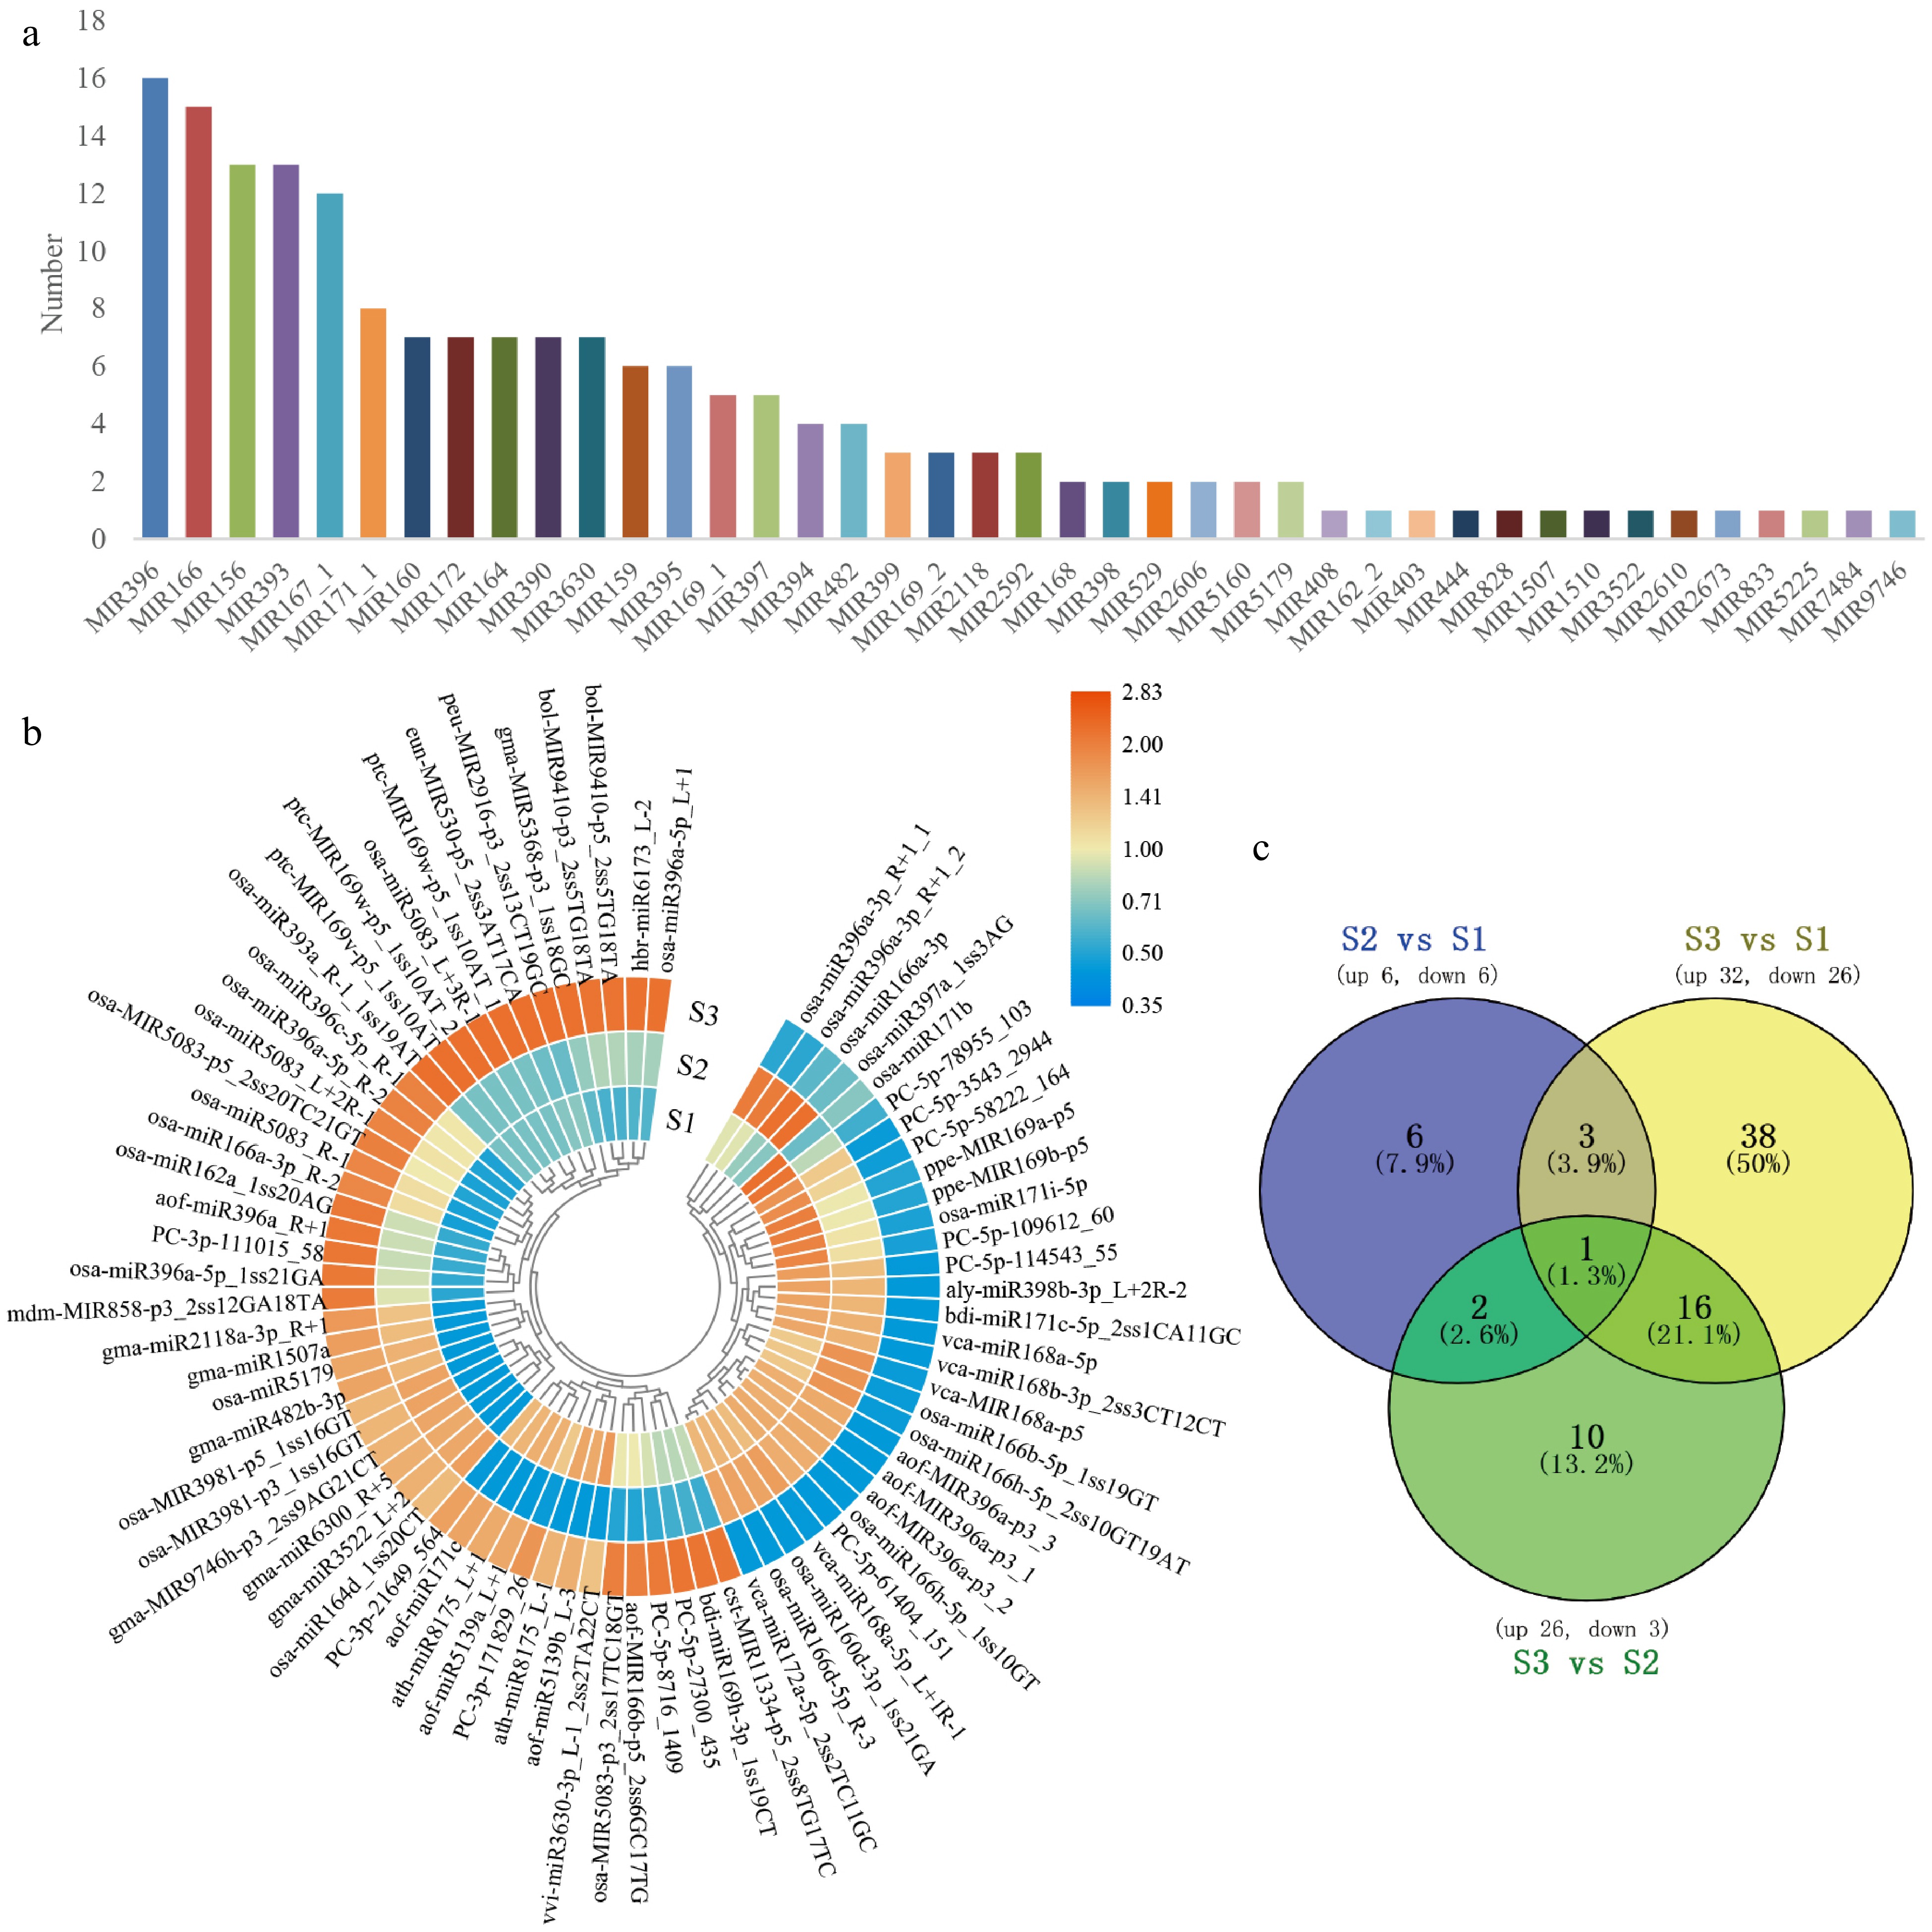
Figure 2.
The classification of miRNA and the target genes. (a) The selected 285 known miRNA belonged to 41 MiRNA families. (b) Heatmap of DEMs expression in the development of flower. After performing row clusters, each colored cell shows the average log2 (FPKM) value of each miRNA. (c) DEMs in floral development is depicted in a Venn diagram.
-
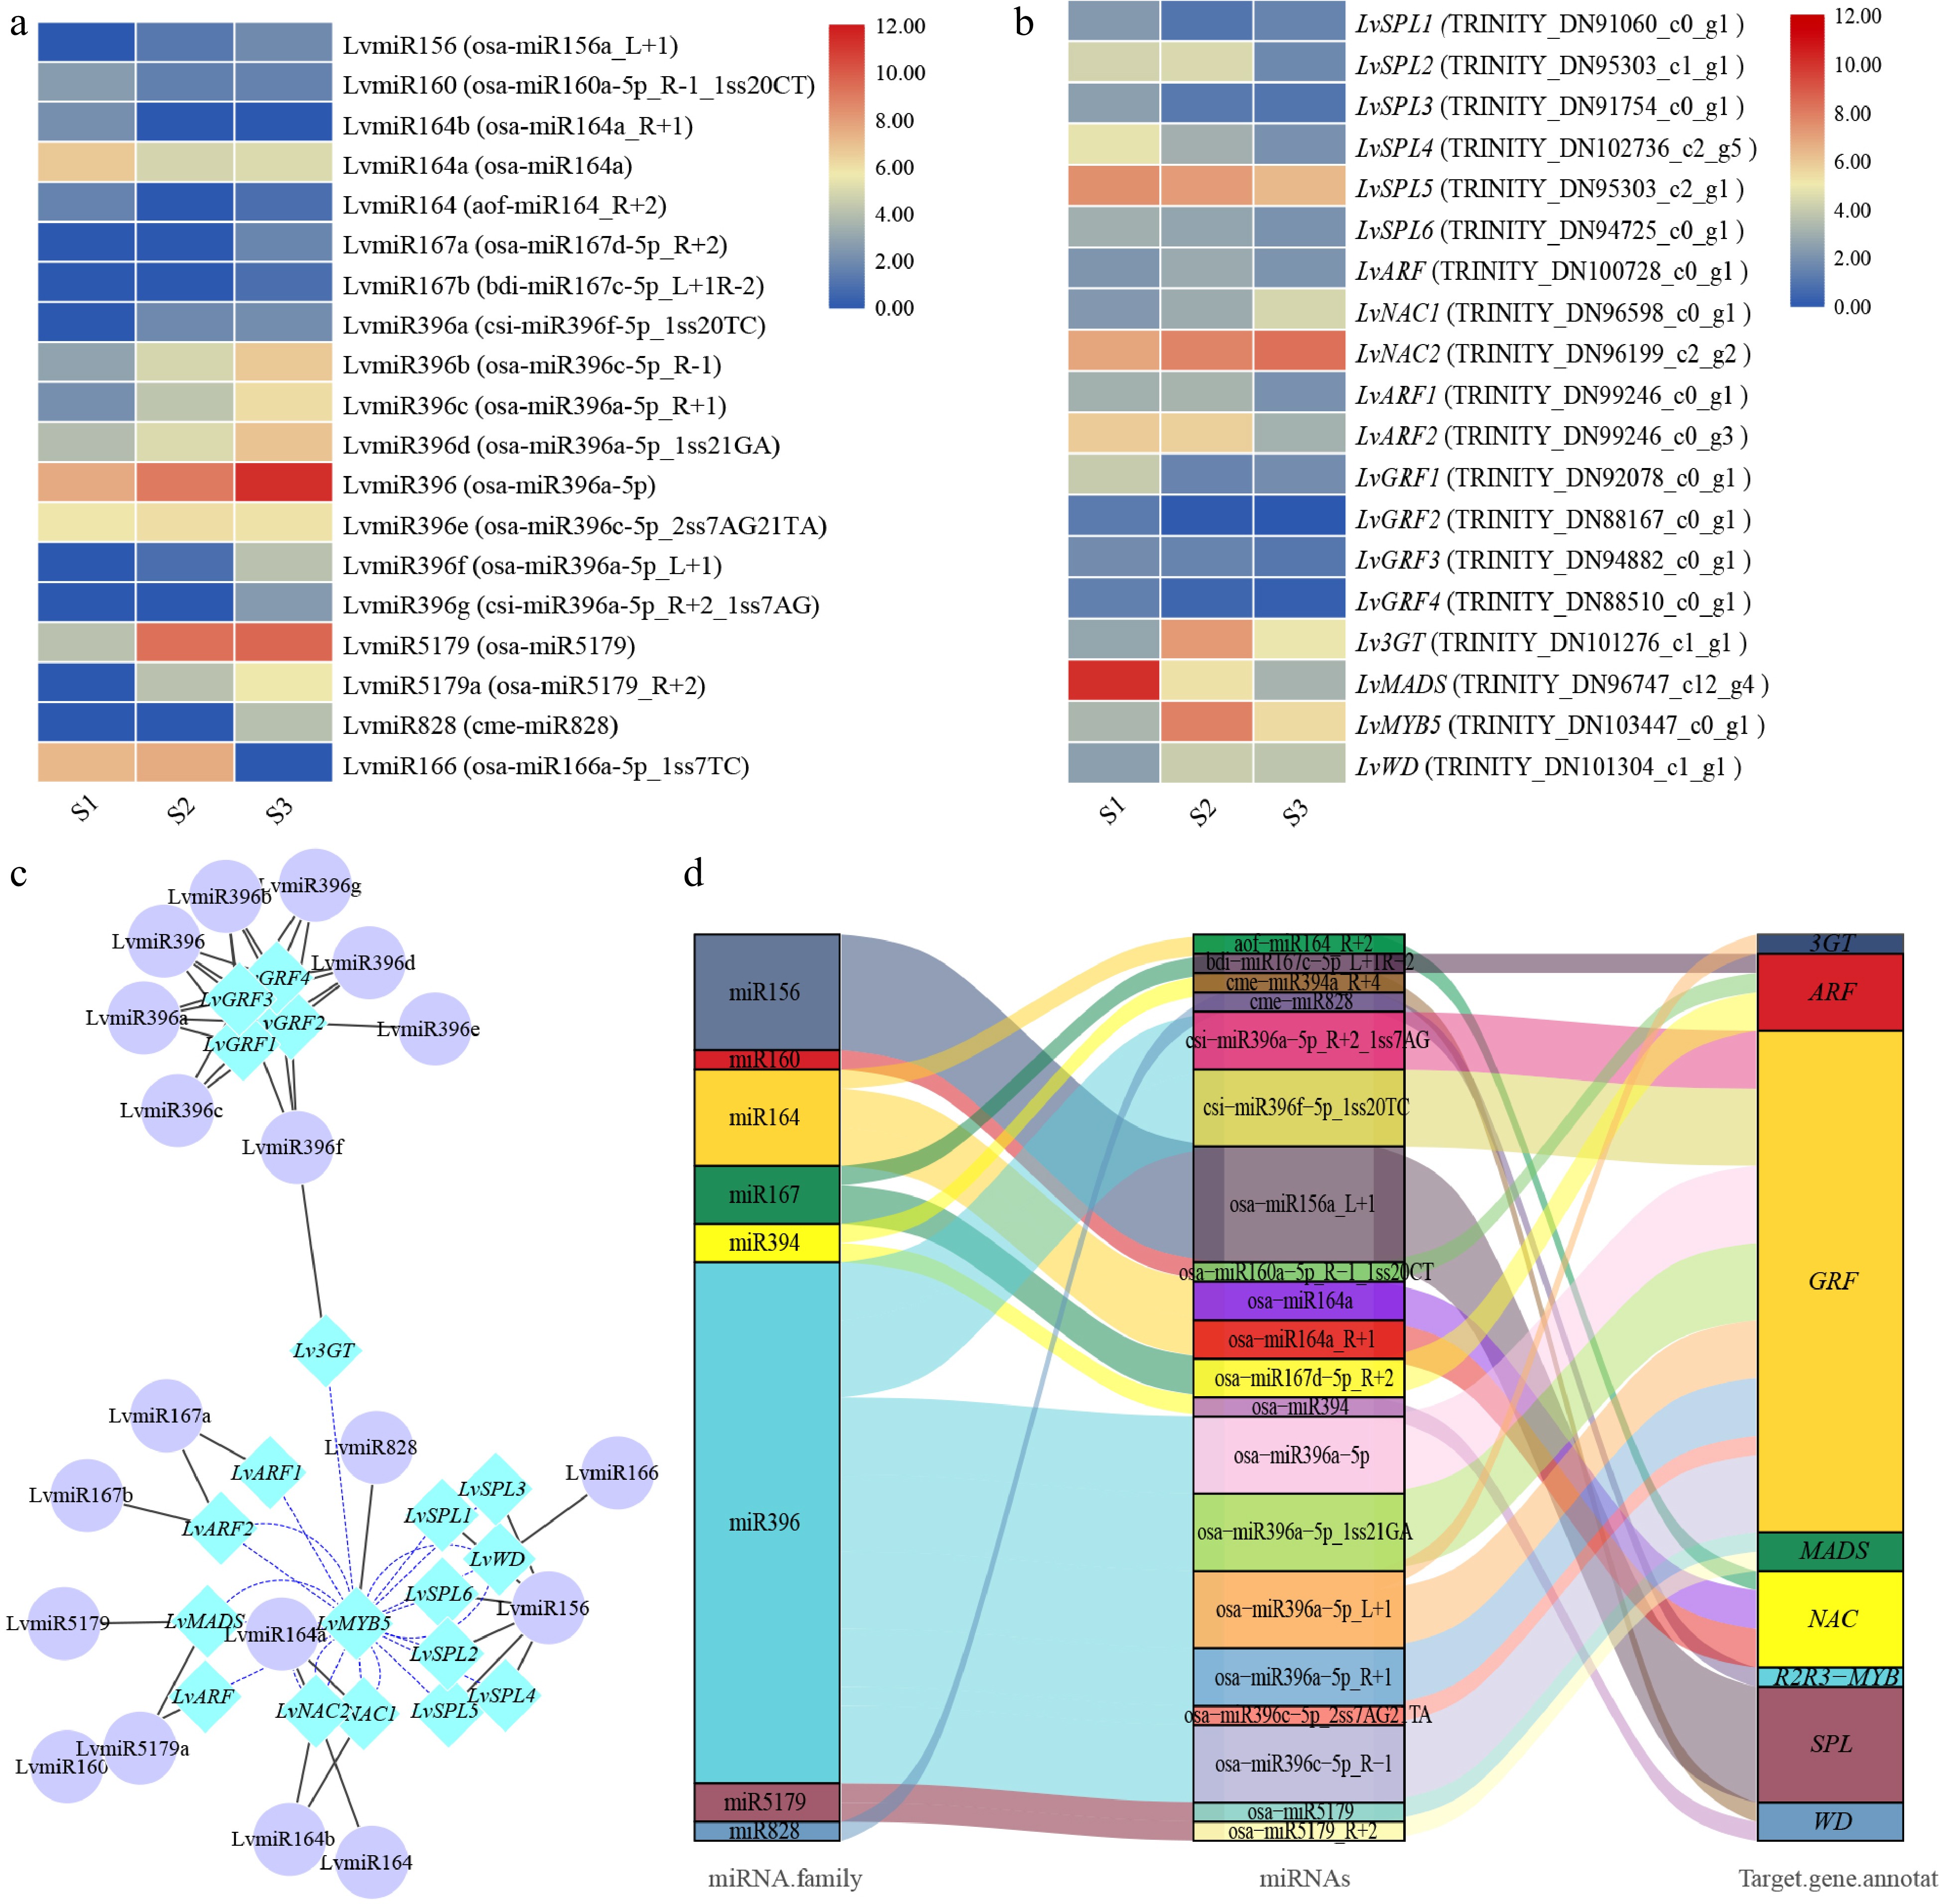
Figure 3.
The correlation between miRNA and target genes screened from lily petals related to anthocyanin synthesis. (a) Heatmap of miRNA expression. (b) MiRNA target gene expression heatmap. The average log2 (FPKM) value of each gene is shown by the color of each cell. (c) The network of target genes and miRNAs controls the progress of anthocyanins synthesis. TF genes are represented by the blue rhombic nodes, miRNA are represented by the purple oval nodes; black lines represent negative correlation; and blue lines represent positive correlation. (d) The Sankey plot of miRNA and target genes.
-
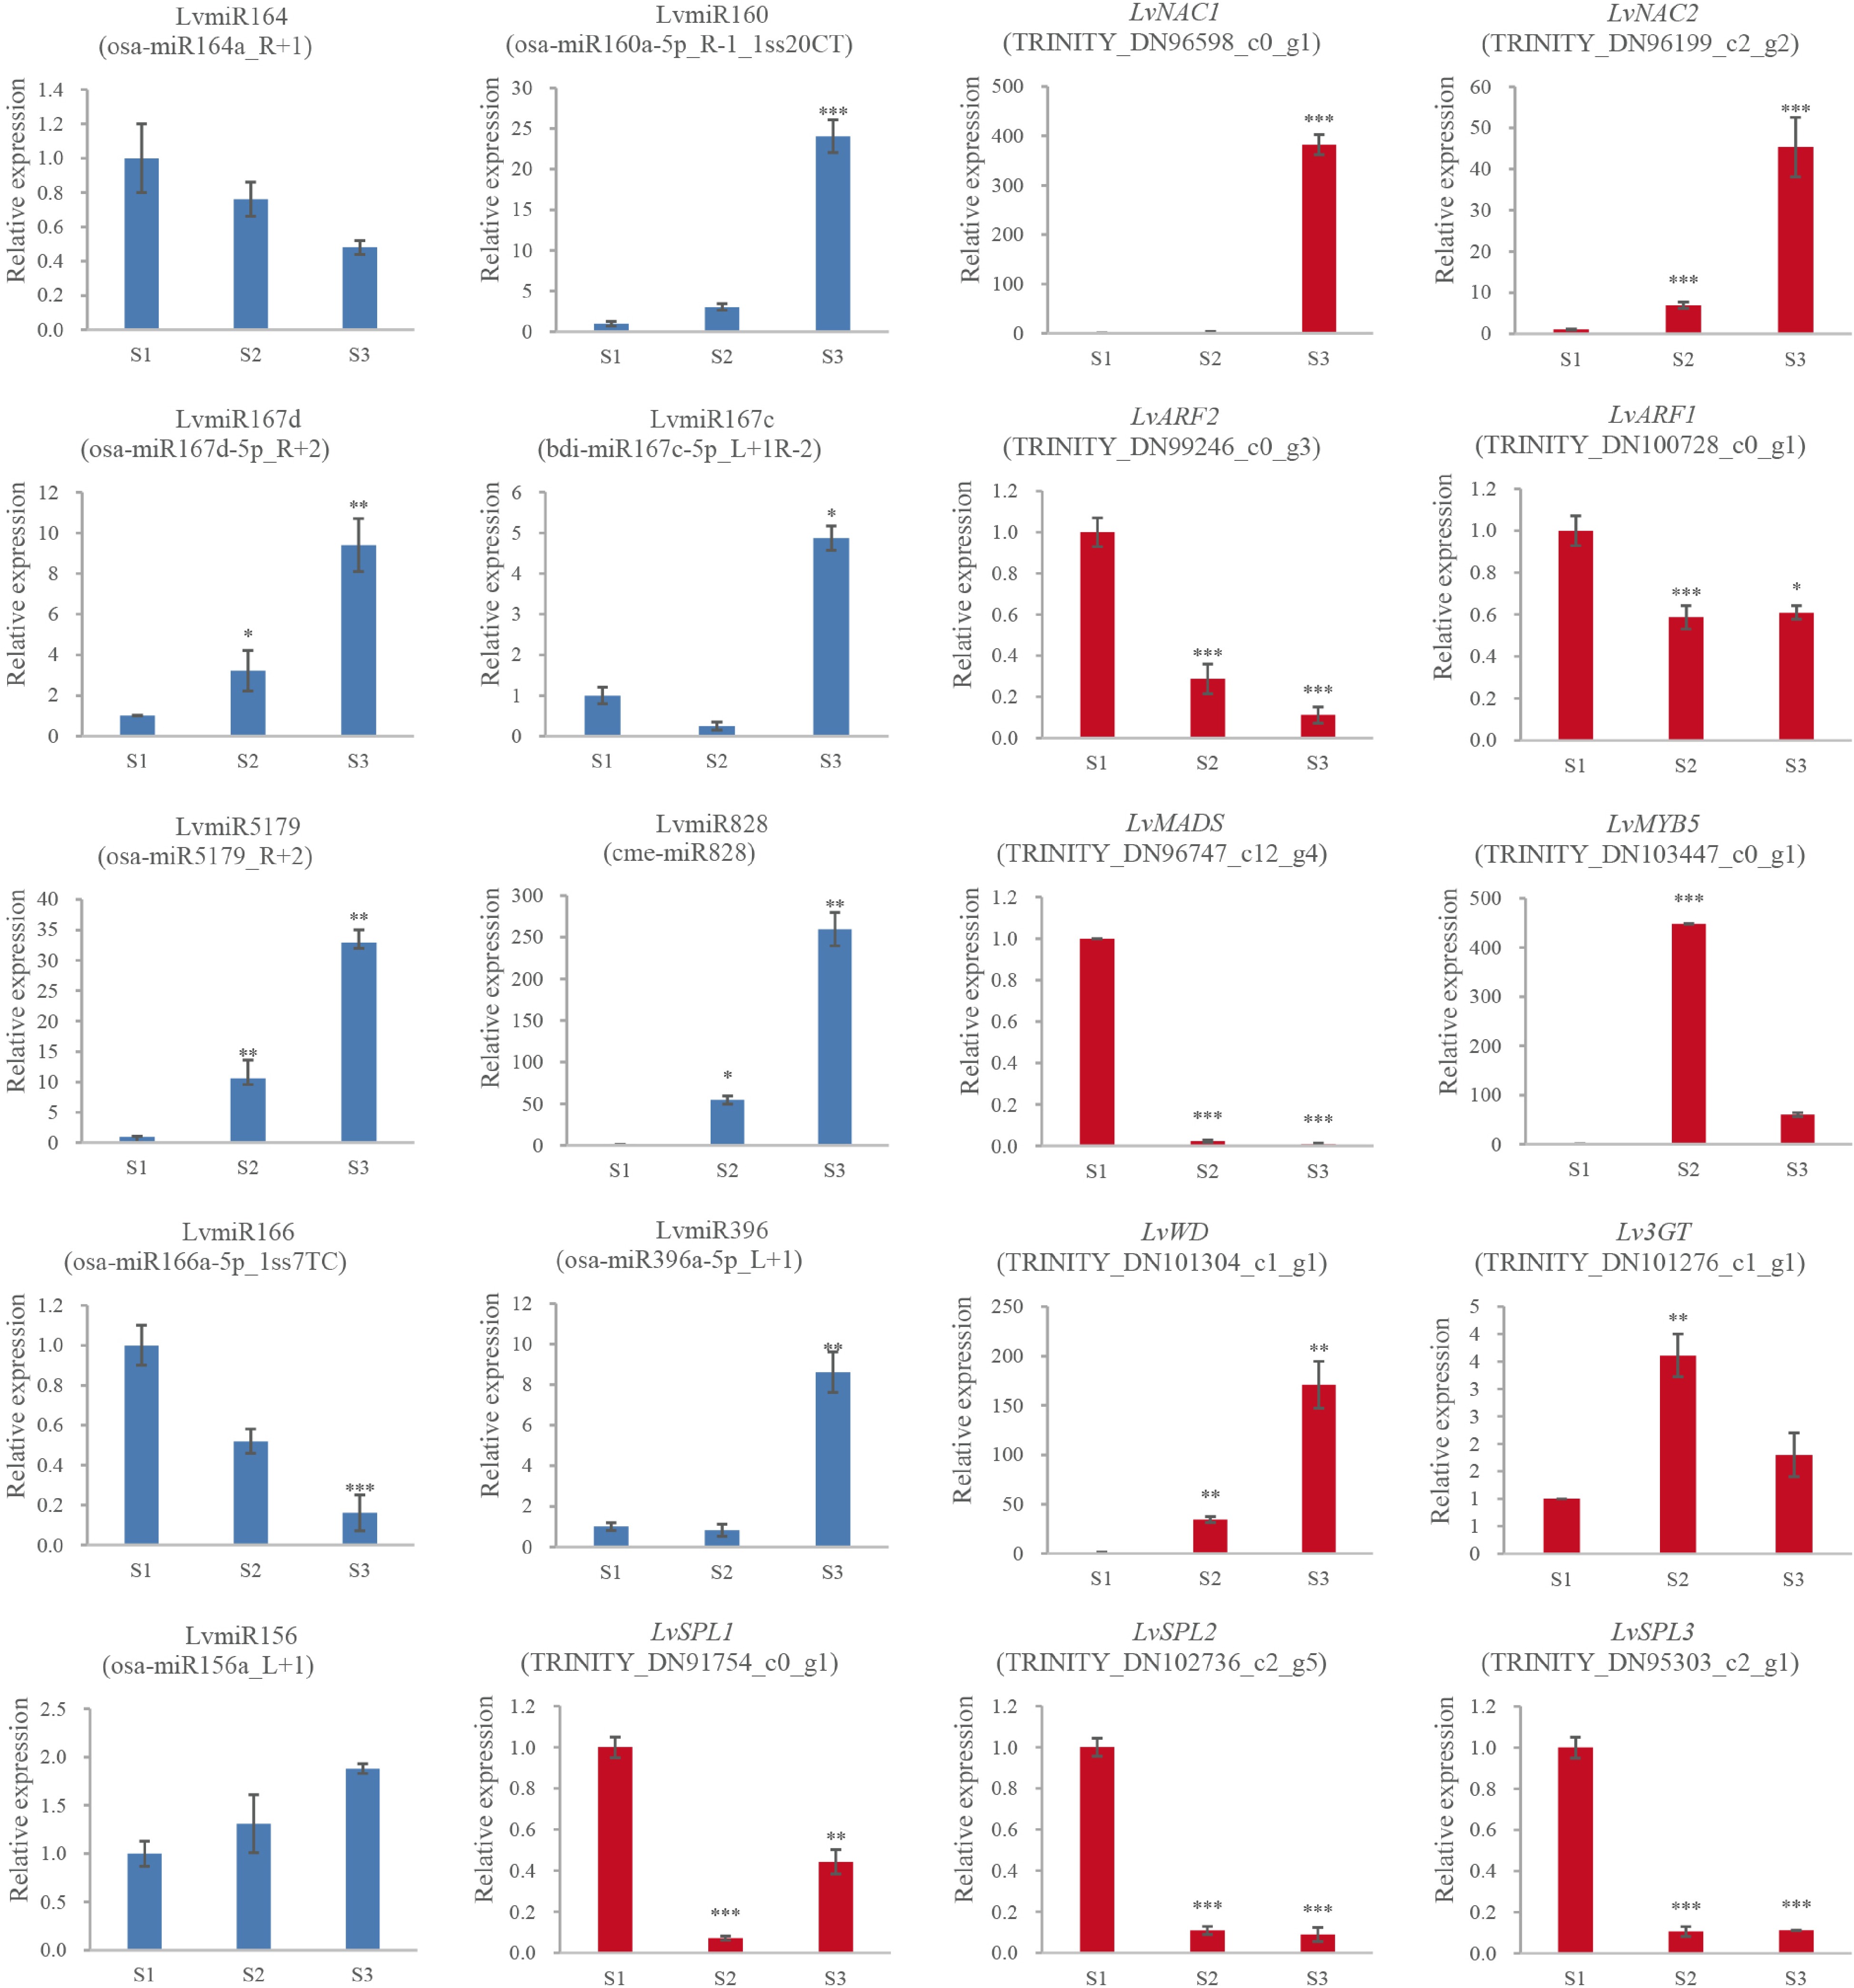
Figure 4.
The expression and the regulation of miRNA and the target genes. 2−ΔΔCᴛ method was used to measure genes' relative expression in S1, S2, S3 stage of lily cultivar Vivian. * Denotes statistically significant differences between samples.
-
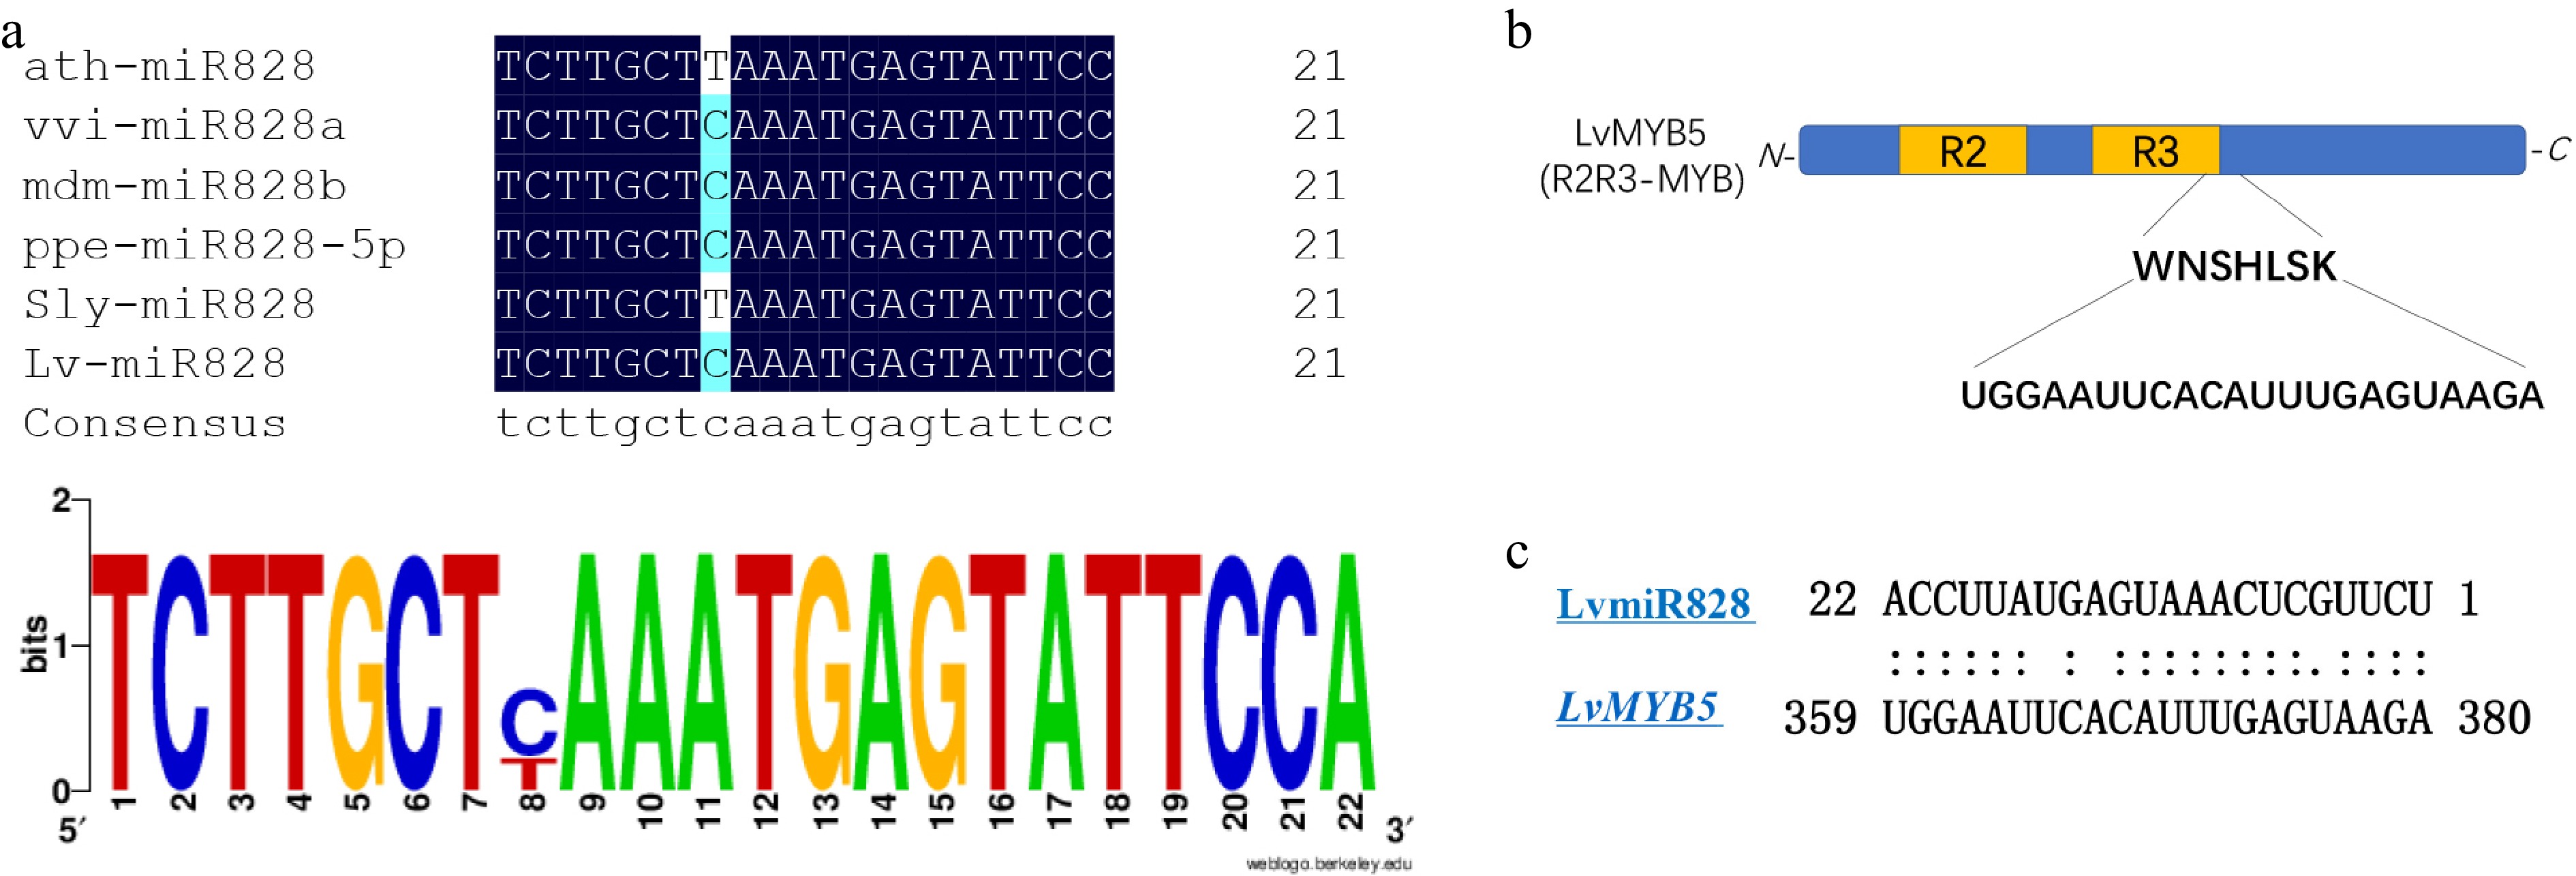
Figure 5.
A preliminary regulation analysis of LvmiR828 target LvMYB5. (a) Multiple sequence alignment of the mature miR828 in plant. (b) Predicted conserved binding site of LvMYB5 targeted by miR828. (c) The binding sites of MYB in plant targeted by miR828.
-
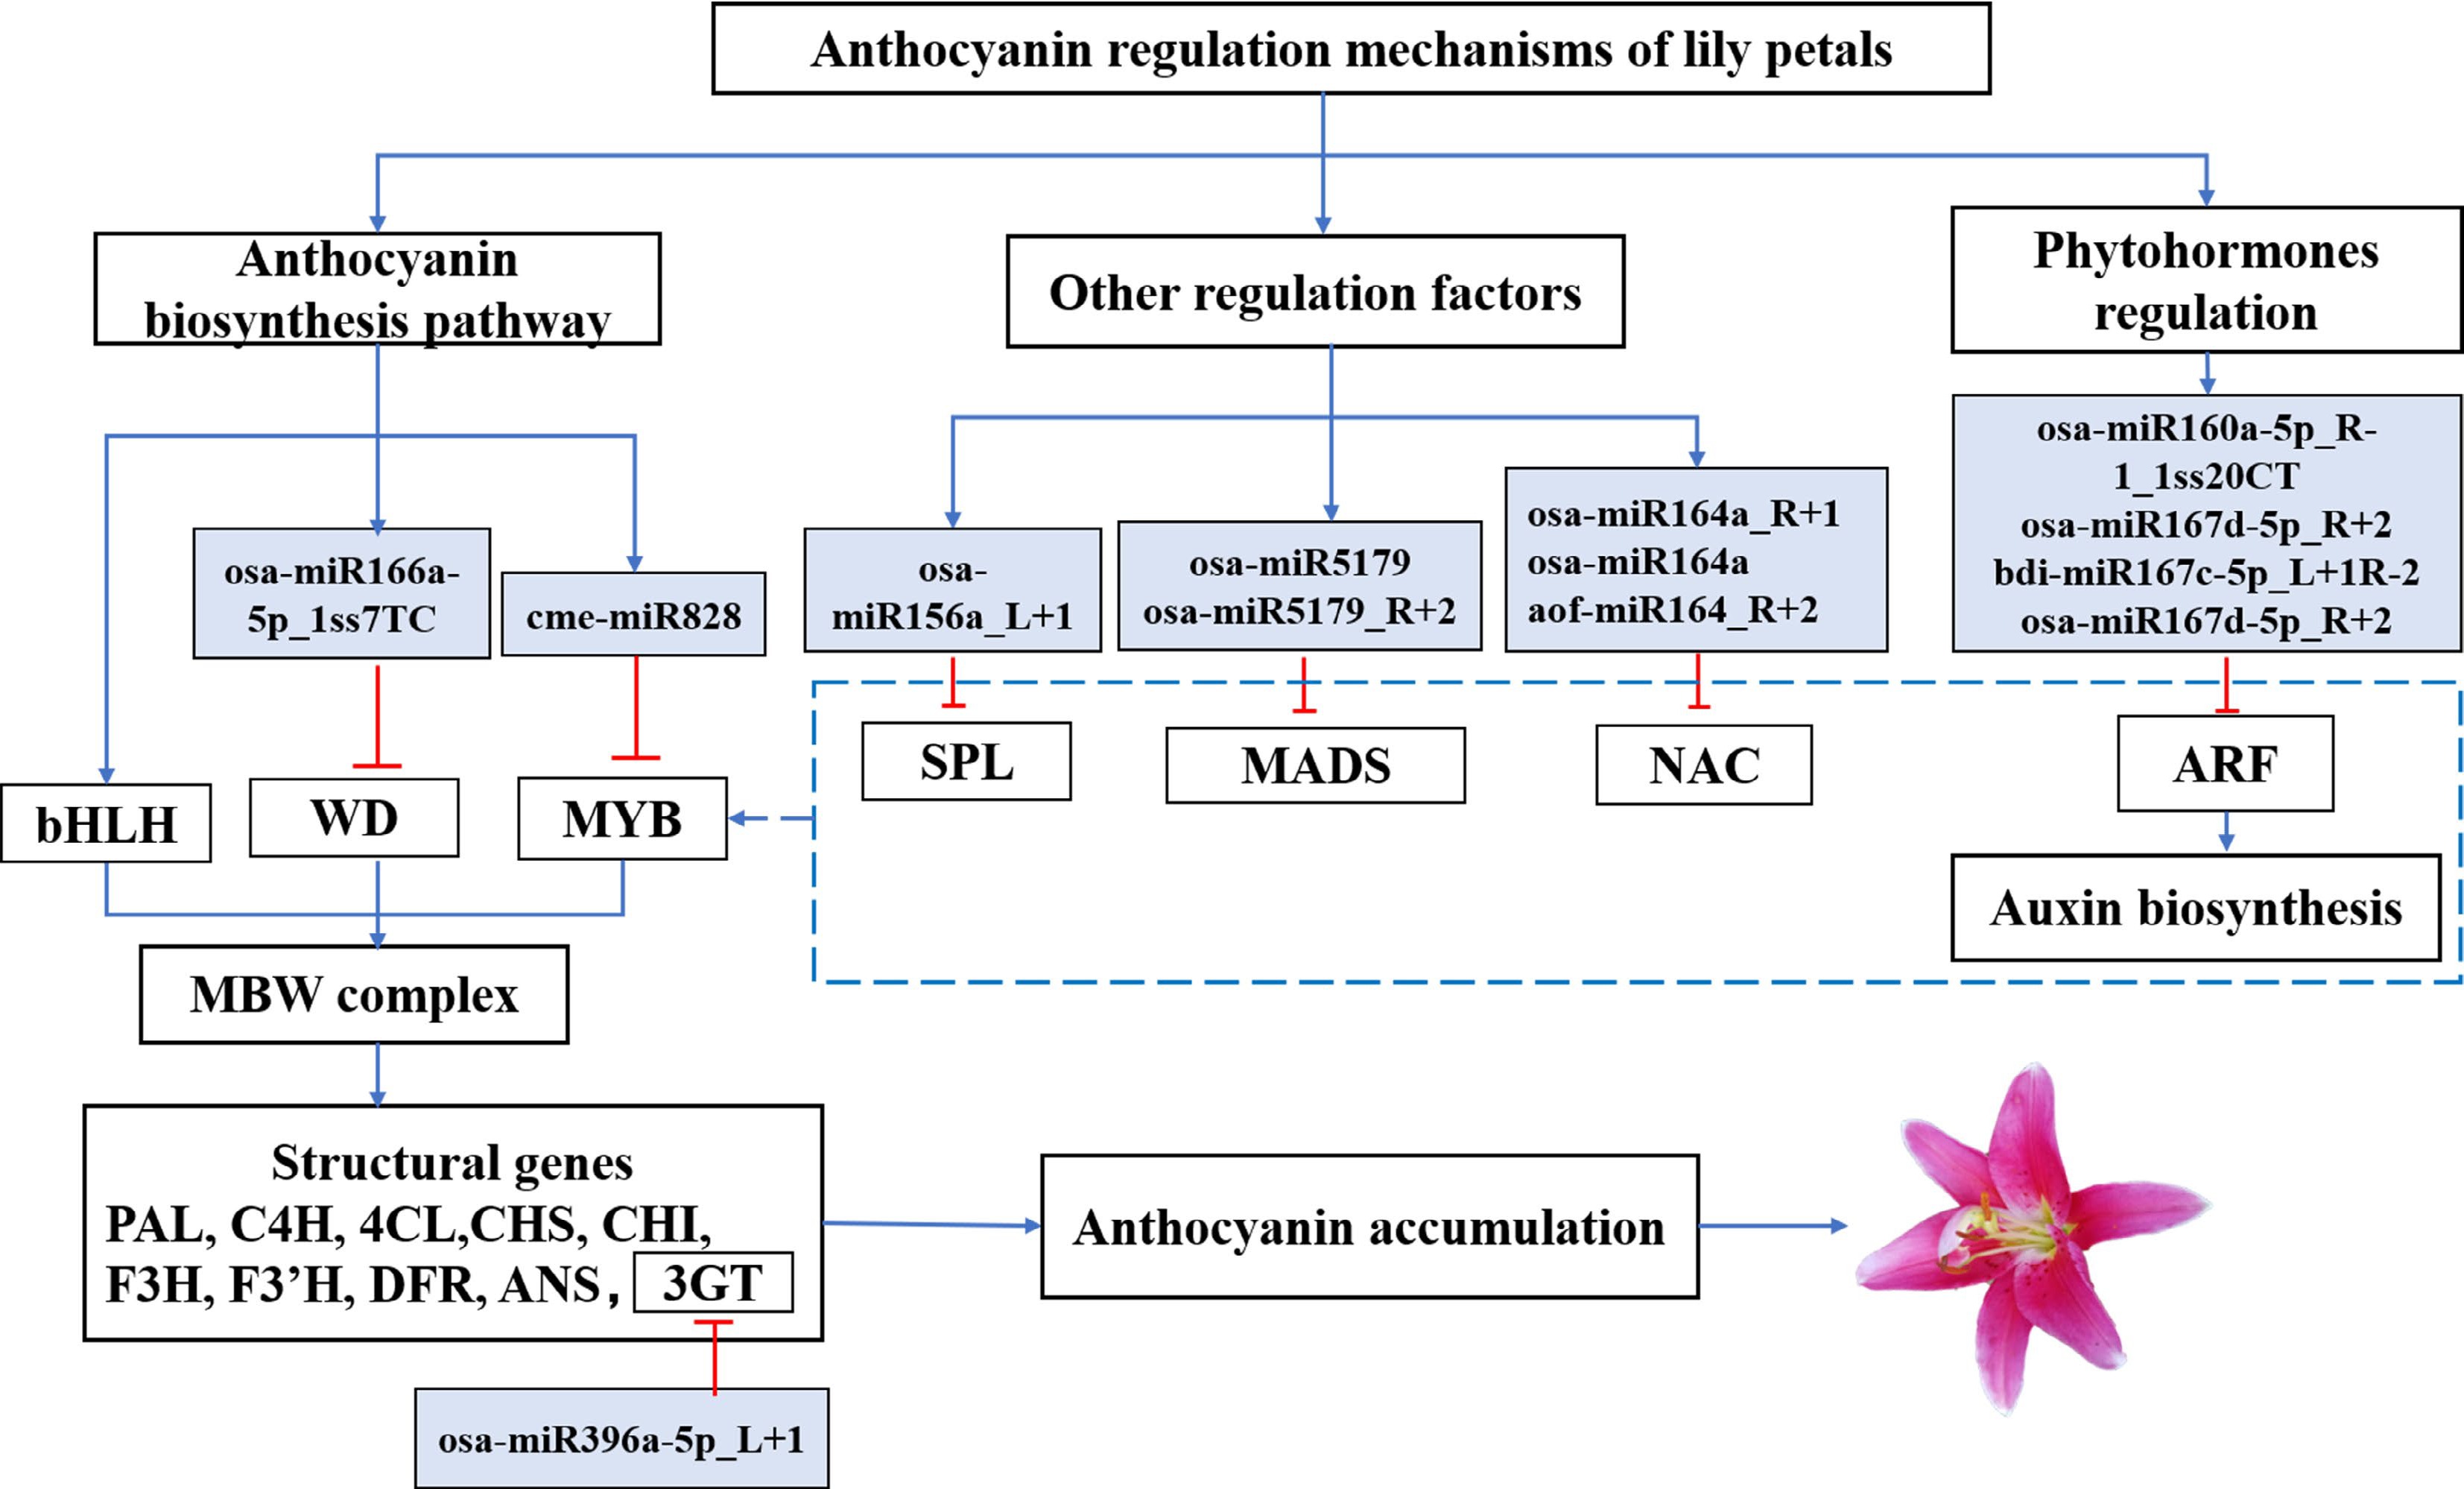
Figure 6.
An interaction model between the target genes for miRNAs involved in the progress of flower coloration in lily petals has been presented. Solid arrowhead lines: the proven regulatory roles. Dashed lines: potential roles.
-
miRNA family miRNAs Target genes Target gene annotation miR156 osa-miR156a_L+1 TRINITY_DN91060_c0_g1, TRINITY_DN95303_c1_g1, TRINITY_DN91754_c0_g1, TRINITY_DN95303_c2_g1, TRINITY_DN94725_c0_g1, TRINITY_DN102736_c2_g5 SPL miR828 cme-miR828 TRINITY_DN103447_c0_g1 R2R3-MYB miR166 osa-miR166a-5p_1ss7TC TRINITY_DN101304_c1_g1 WD miR396 osa-miR396a-5p_L+1 TRINITY_DN101276_c1_g1 3GT csi-miR396f-5p_1ss20TC, osa-miR396c-5p_R-1, osa-miR396a-5p_R+1, osa-miR396a-5p_1ss21GA, osa-miR396a-5p TRINITY_DN92078_c0_g1 GRF csi-miR396f-5p_1ss20TC, osa-miR396c-5p_2ss7AG21TA, osa-miR396c-5p_R-1, osa-miR396a-5p_R+1, osa-miR396a-5p_1ss21GA, osa-miR396a-5p, osa-miR396a-5p_L+1, csi-miR396a-5p_R+2_1ss7AG TRINITY_DN88167_c0_g1 GRF osa-miR396c-5p_R-1, osa-miR396a-5p_R+1, osa-miR396a-5p_1ss21GA, osa-miR396a-5p, csi-miR396f-5p_1ss20TC, osa-miR396a-5p_L+1,
csi-miR396a-5p_R+2_1ss7AGTRINITY_DN94882_c0_g1 GRF csi-miR396f-5p_1ss20TC, osa-miR396c-5p_R-1, osa-miR396a-5p_1ss21GA, osa-miR396a-5p, osa-miR396a-5p_L+1, csi-miR396a-5p_R+2_1ss7AG TRINITY_DN88510_c0_g1 GRF miR5179 osa-miR5179, osa-miR5179_R+2 TRINITY_DN96747_c12_g4 MADS miR164 osa-miR164a, osa-miR164a_R+1 TRINITY_DN96598_c0_g1 NAC osa-miR164a_R+1, osa-miR164a, aof-miR164_R+2 TRINITY_DN96199_c2_g2 NAC miR160 osa-miR160a-5p_R-1_1ss20CT TRINITY_DN100728_c0_g1 ARF miR167 osa-miR167d-5p_R+2 TRINITY_DN99246_c0_g1 ARF bdi-miR167c-5p_L+1R-2, osa-miR167d-5p_R+2 TRINITY_DN99246_c0_g3 ARF Table 1.
Target genes of anthocyanin biosynthesis related miRNAs in lily petals.
Figures
(6)
Tables
(1)