-
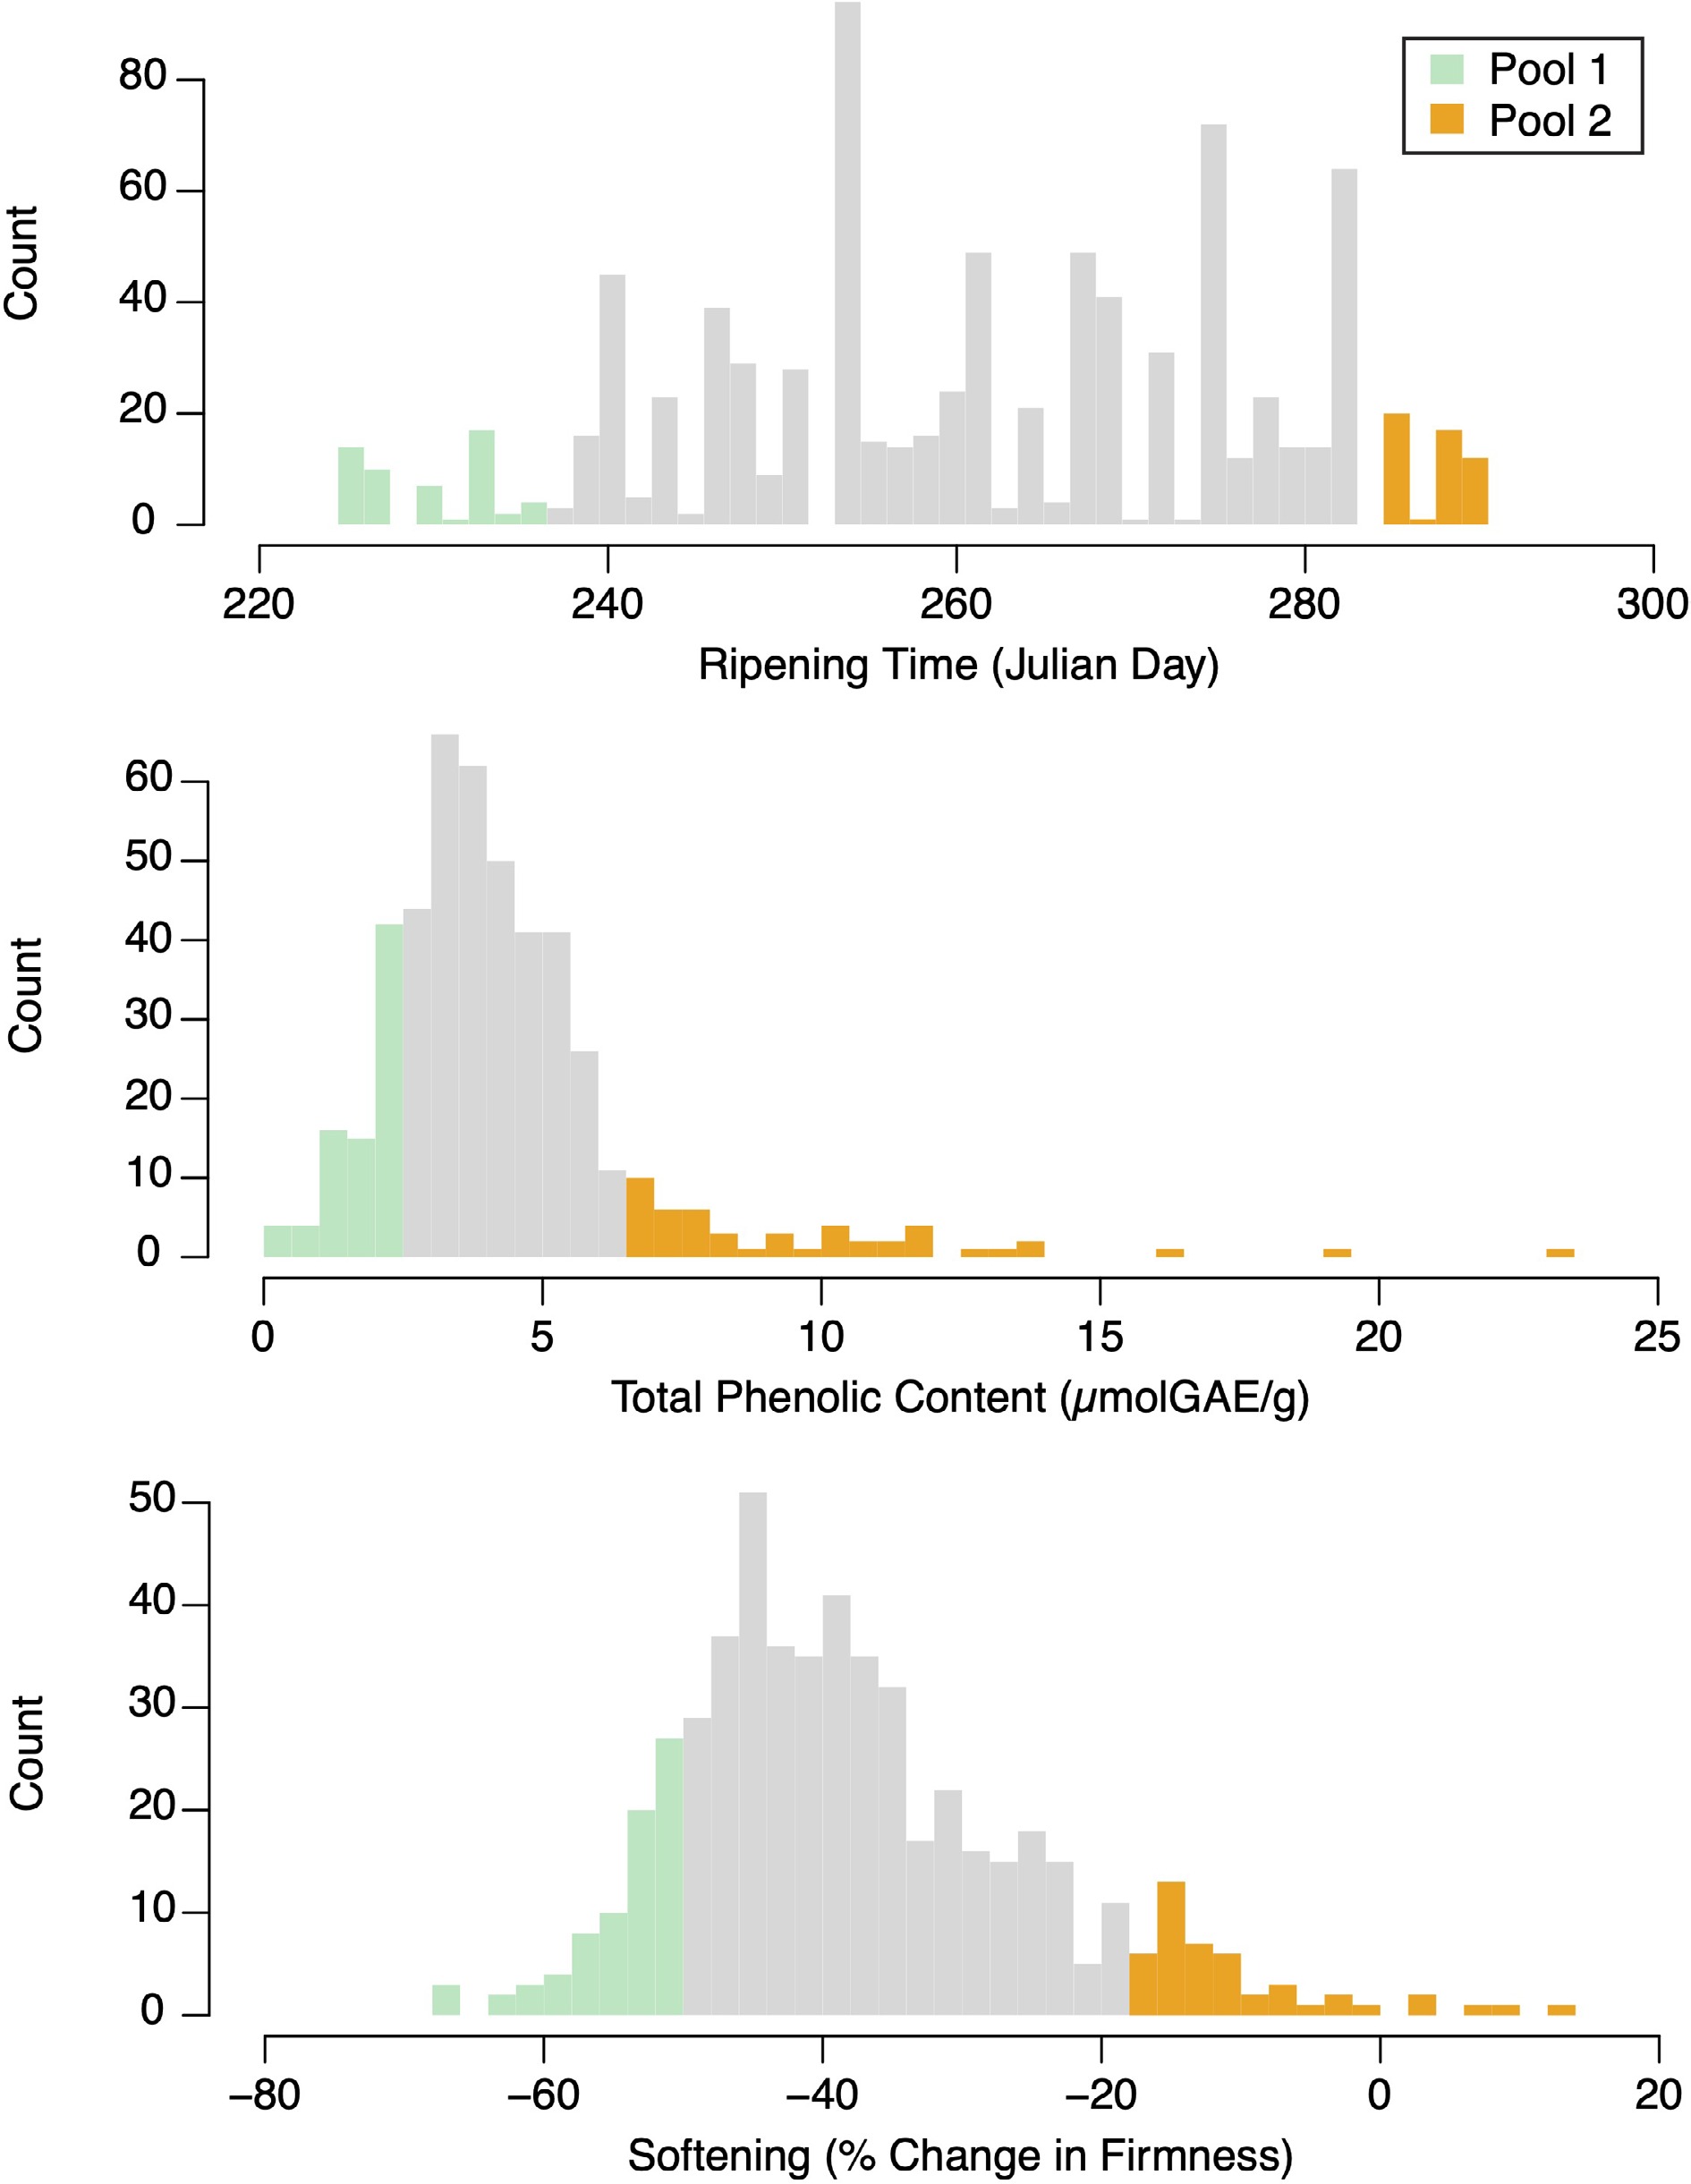
Figure 1.
Phenotype distributions for ripening time, phenolic content, and softening. Green and orange bars represent accessions selected for pooled sequencing.
-

Figure 2.
Manhattan plots for genome wide delta-AFe and chi-squared test p-values for ripening time. (a) Delta-AFe values and (b) chi-squared test p-values from variants detected across the genome. (c), (d) Zoom-in plots for signals on chromosome 3 and chromosome 4. Yellow bars indicate gene coding regions. Red bar outlines the NAC18.1 coding region. The red dot is the D5Y SNP, a putatively causal non-synonymous mutation previously identified in the NAC18.1 gene6. 'R' on the X-axis of the genome-wide plots indicates the 'random' chromosome containing contigs that remain unanchored to the reference genome.
-
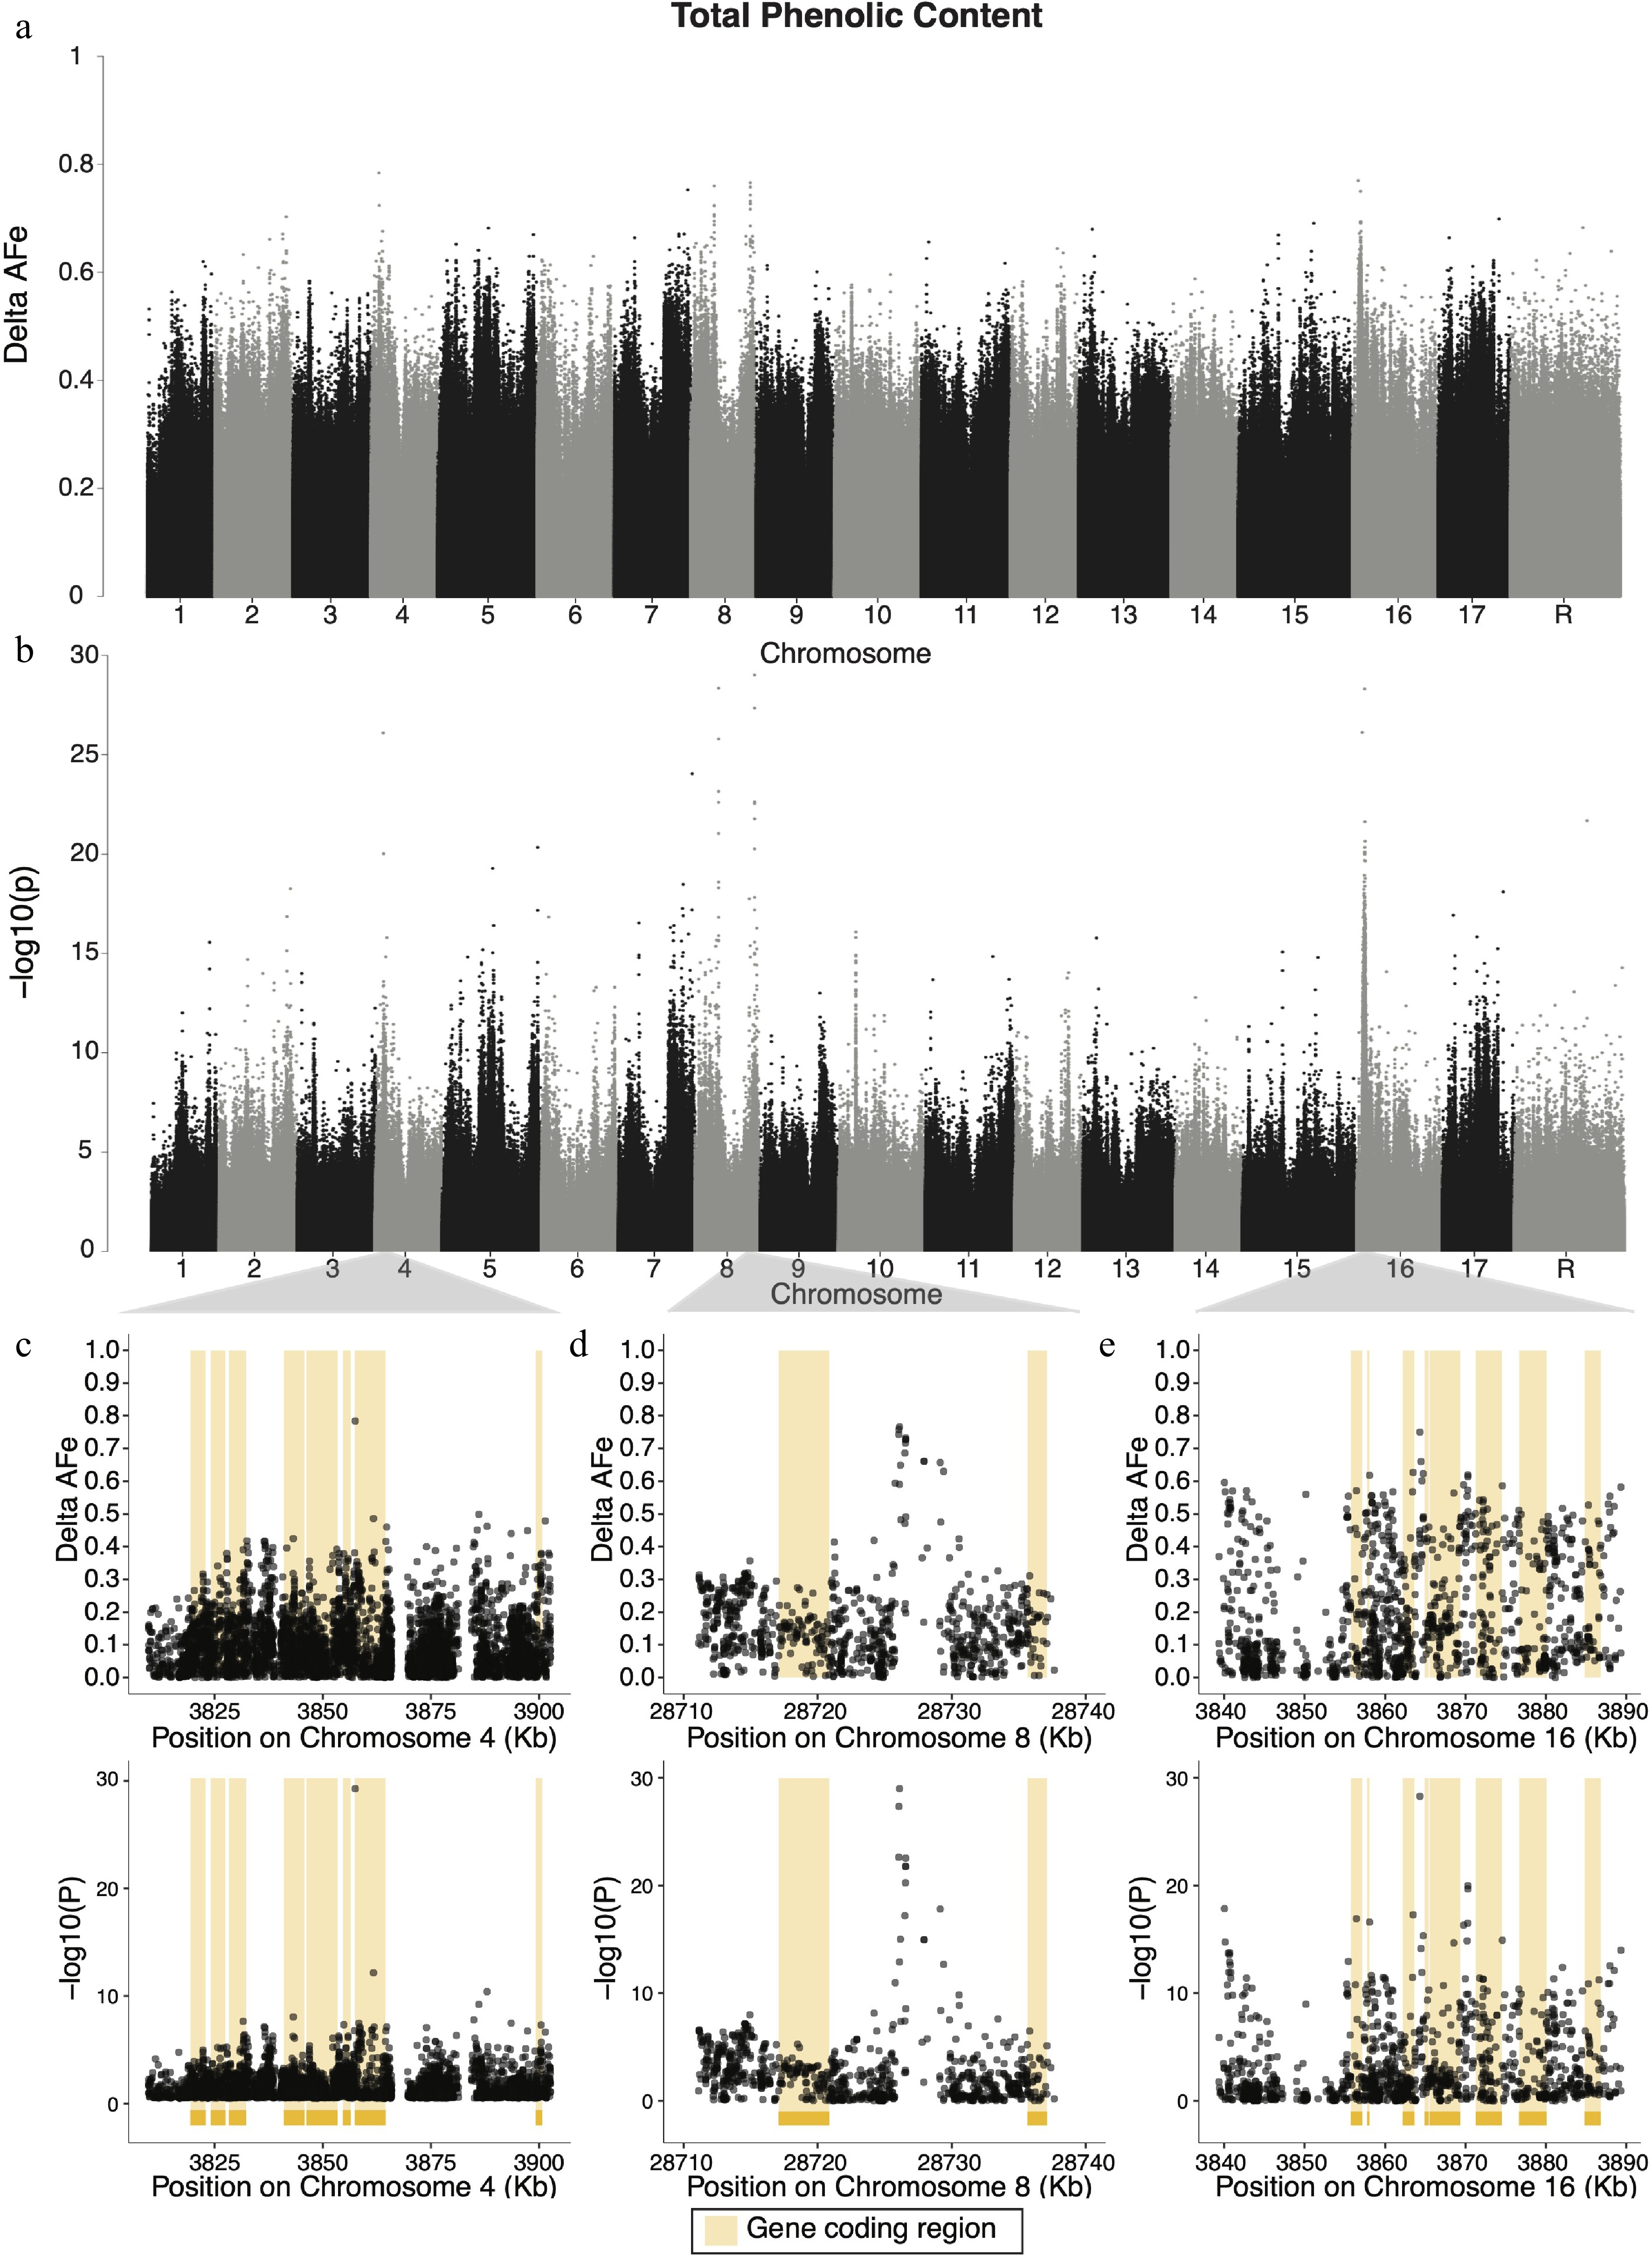
Figure 3.
Manhattan plots of delta-AFe and chi-squared test p-values for phenolic content. (a) Delta-AFe values and (b) chi-squared test p-values from variants detected across the genome. (c), (d) Zoom-in plots for signals on chromosome 4, chromosome 8, and 16. Yellow bars indicate protein coding regions.
-
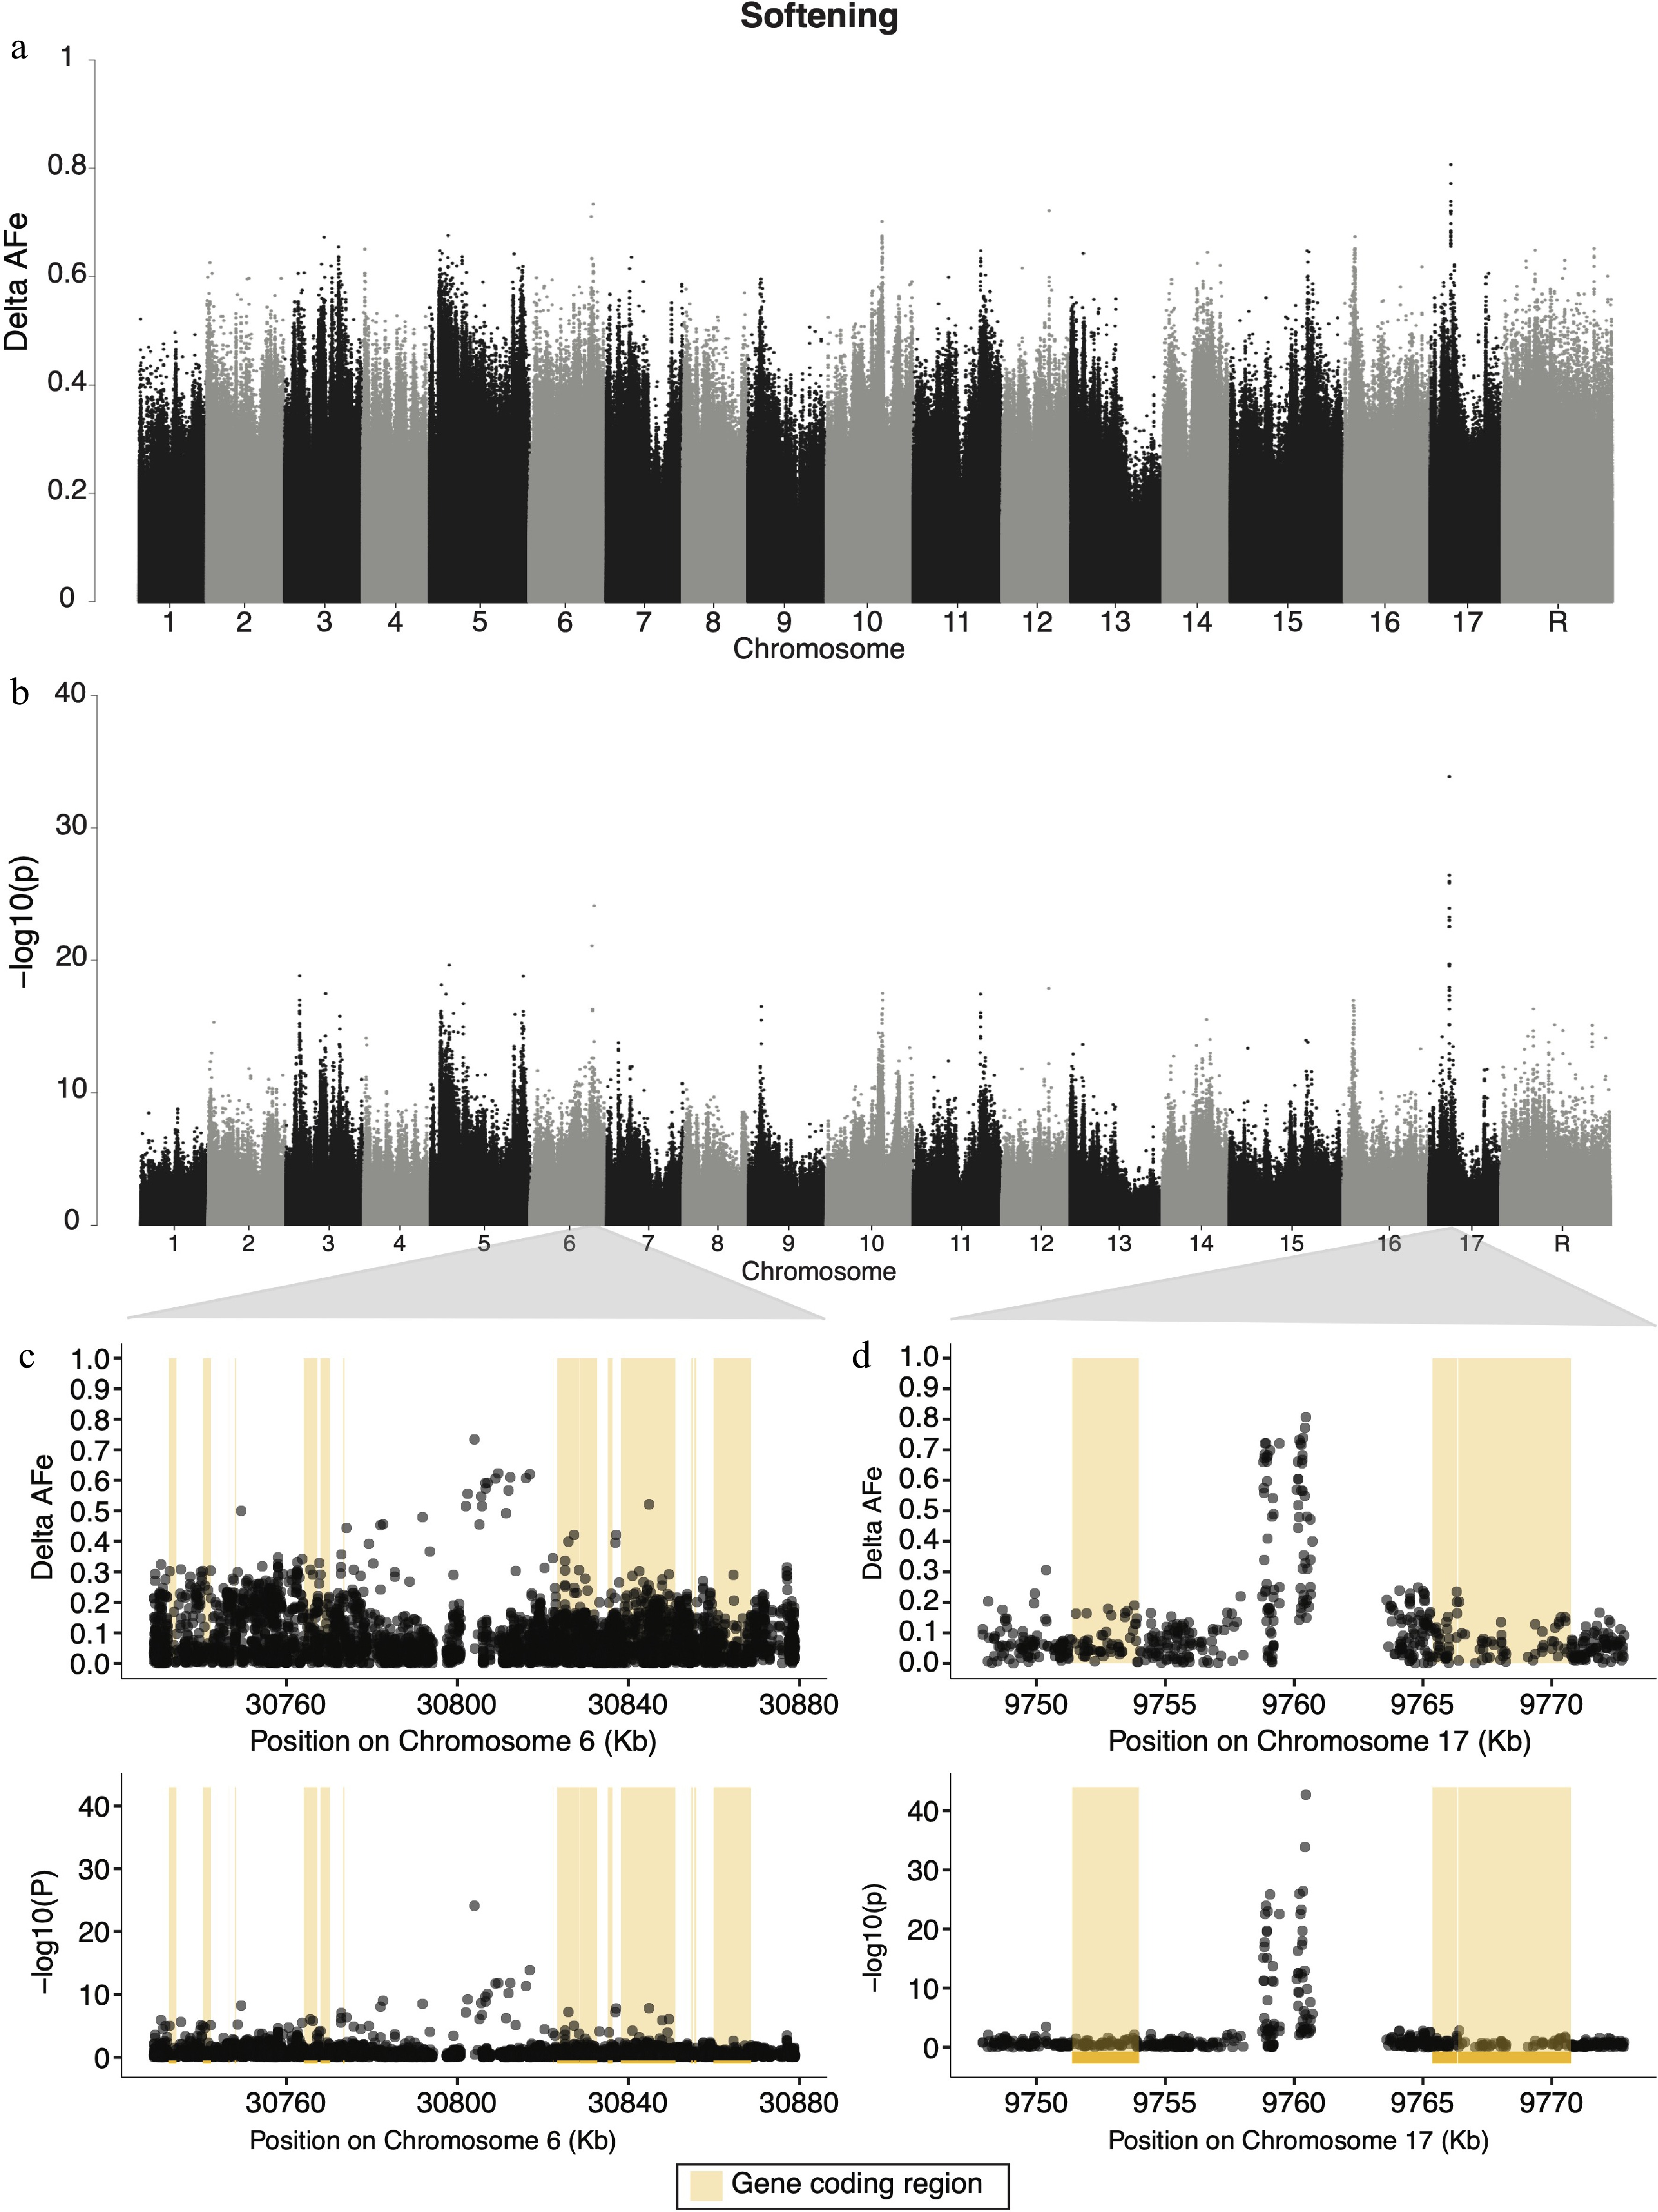
Figure 4.
Manhattan plots for genome wide delta-AFe and chi-squared test p-values for apple softening. (a) Delta-AFe values and (b) chi-squared test p-values from variants detected across the genome. (c), (d) Zoom-in plots for signals on chromosome 6 and chromosome 17. Yellow bars indicate protein coding regions.
Figures
(4)
Tables
(0)