-
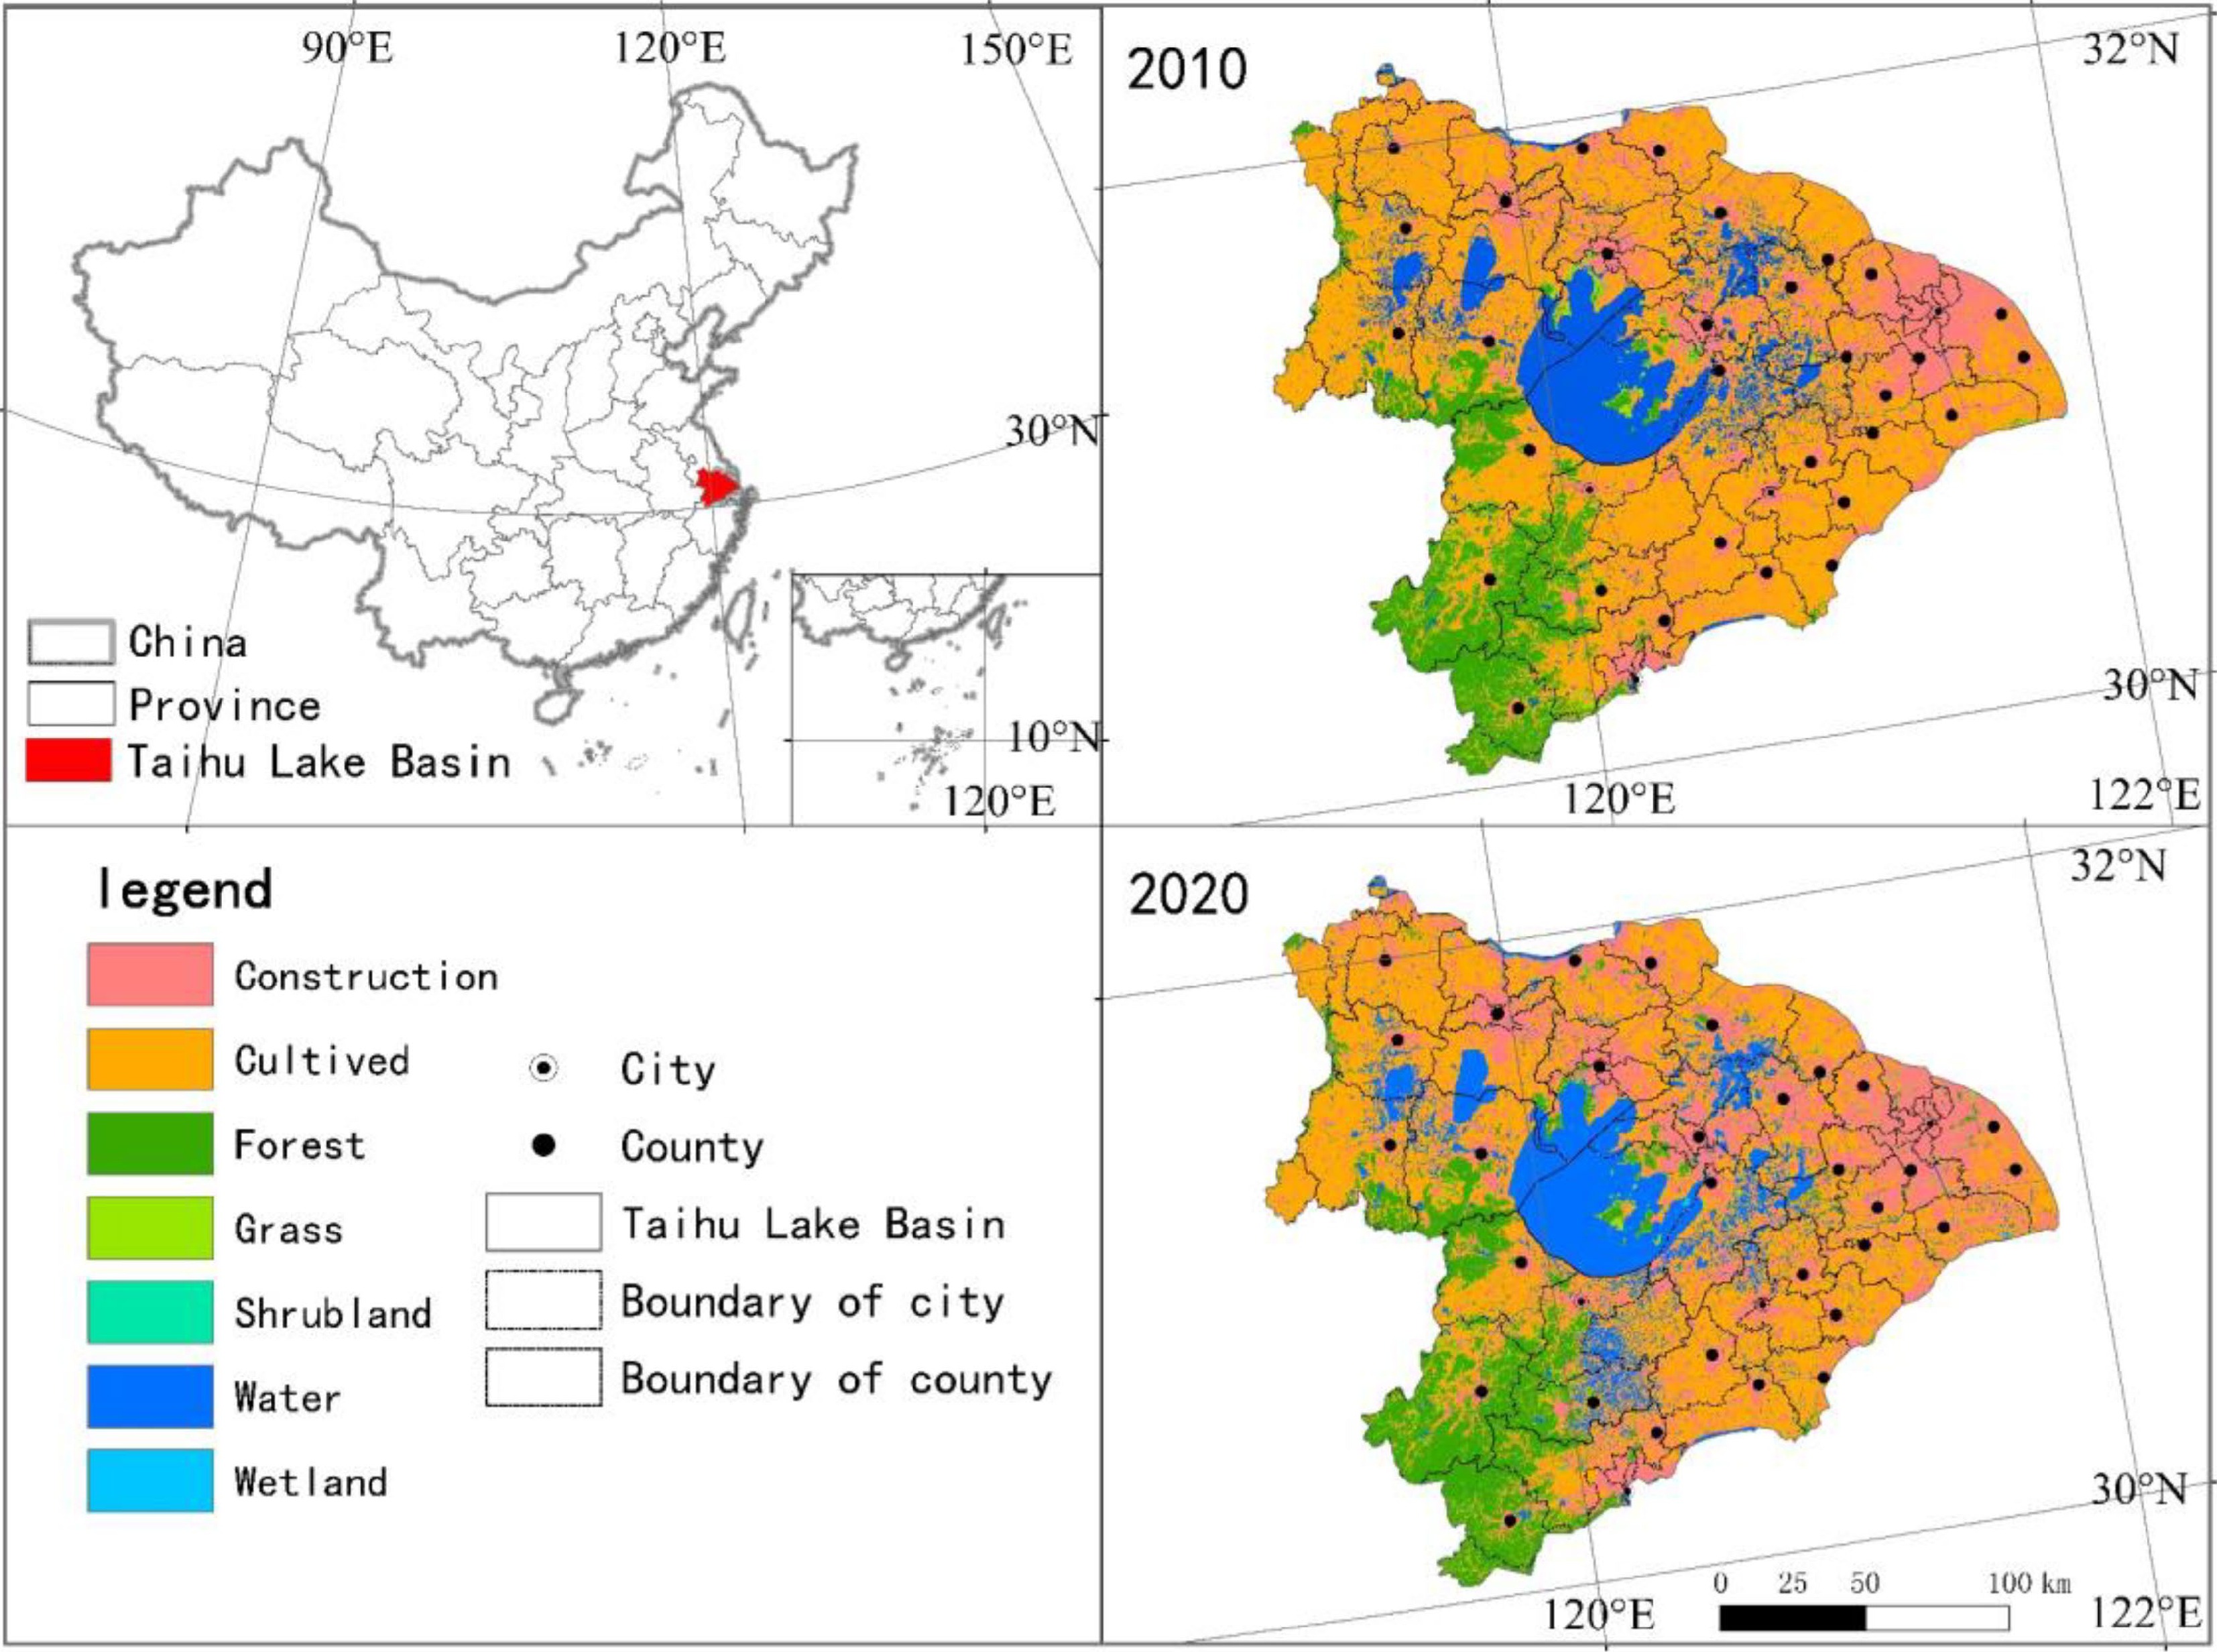
Figure 1.
Location of TLB in the Yangtze River Delta in China.
-
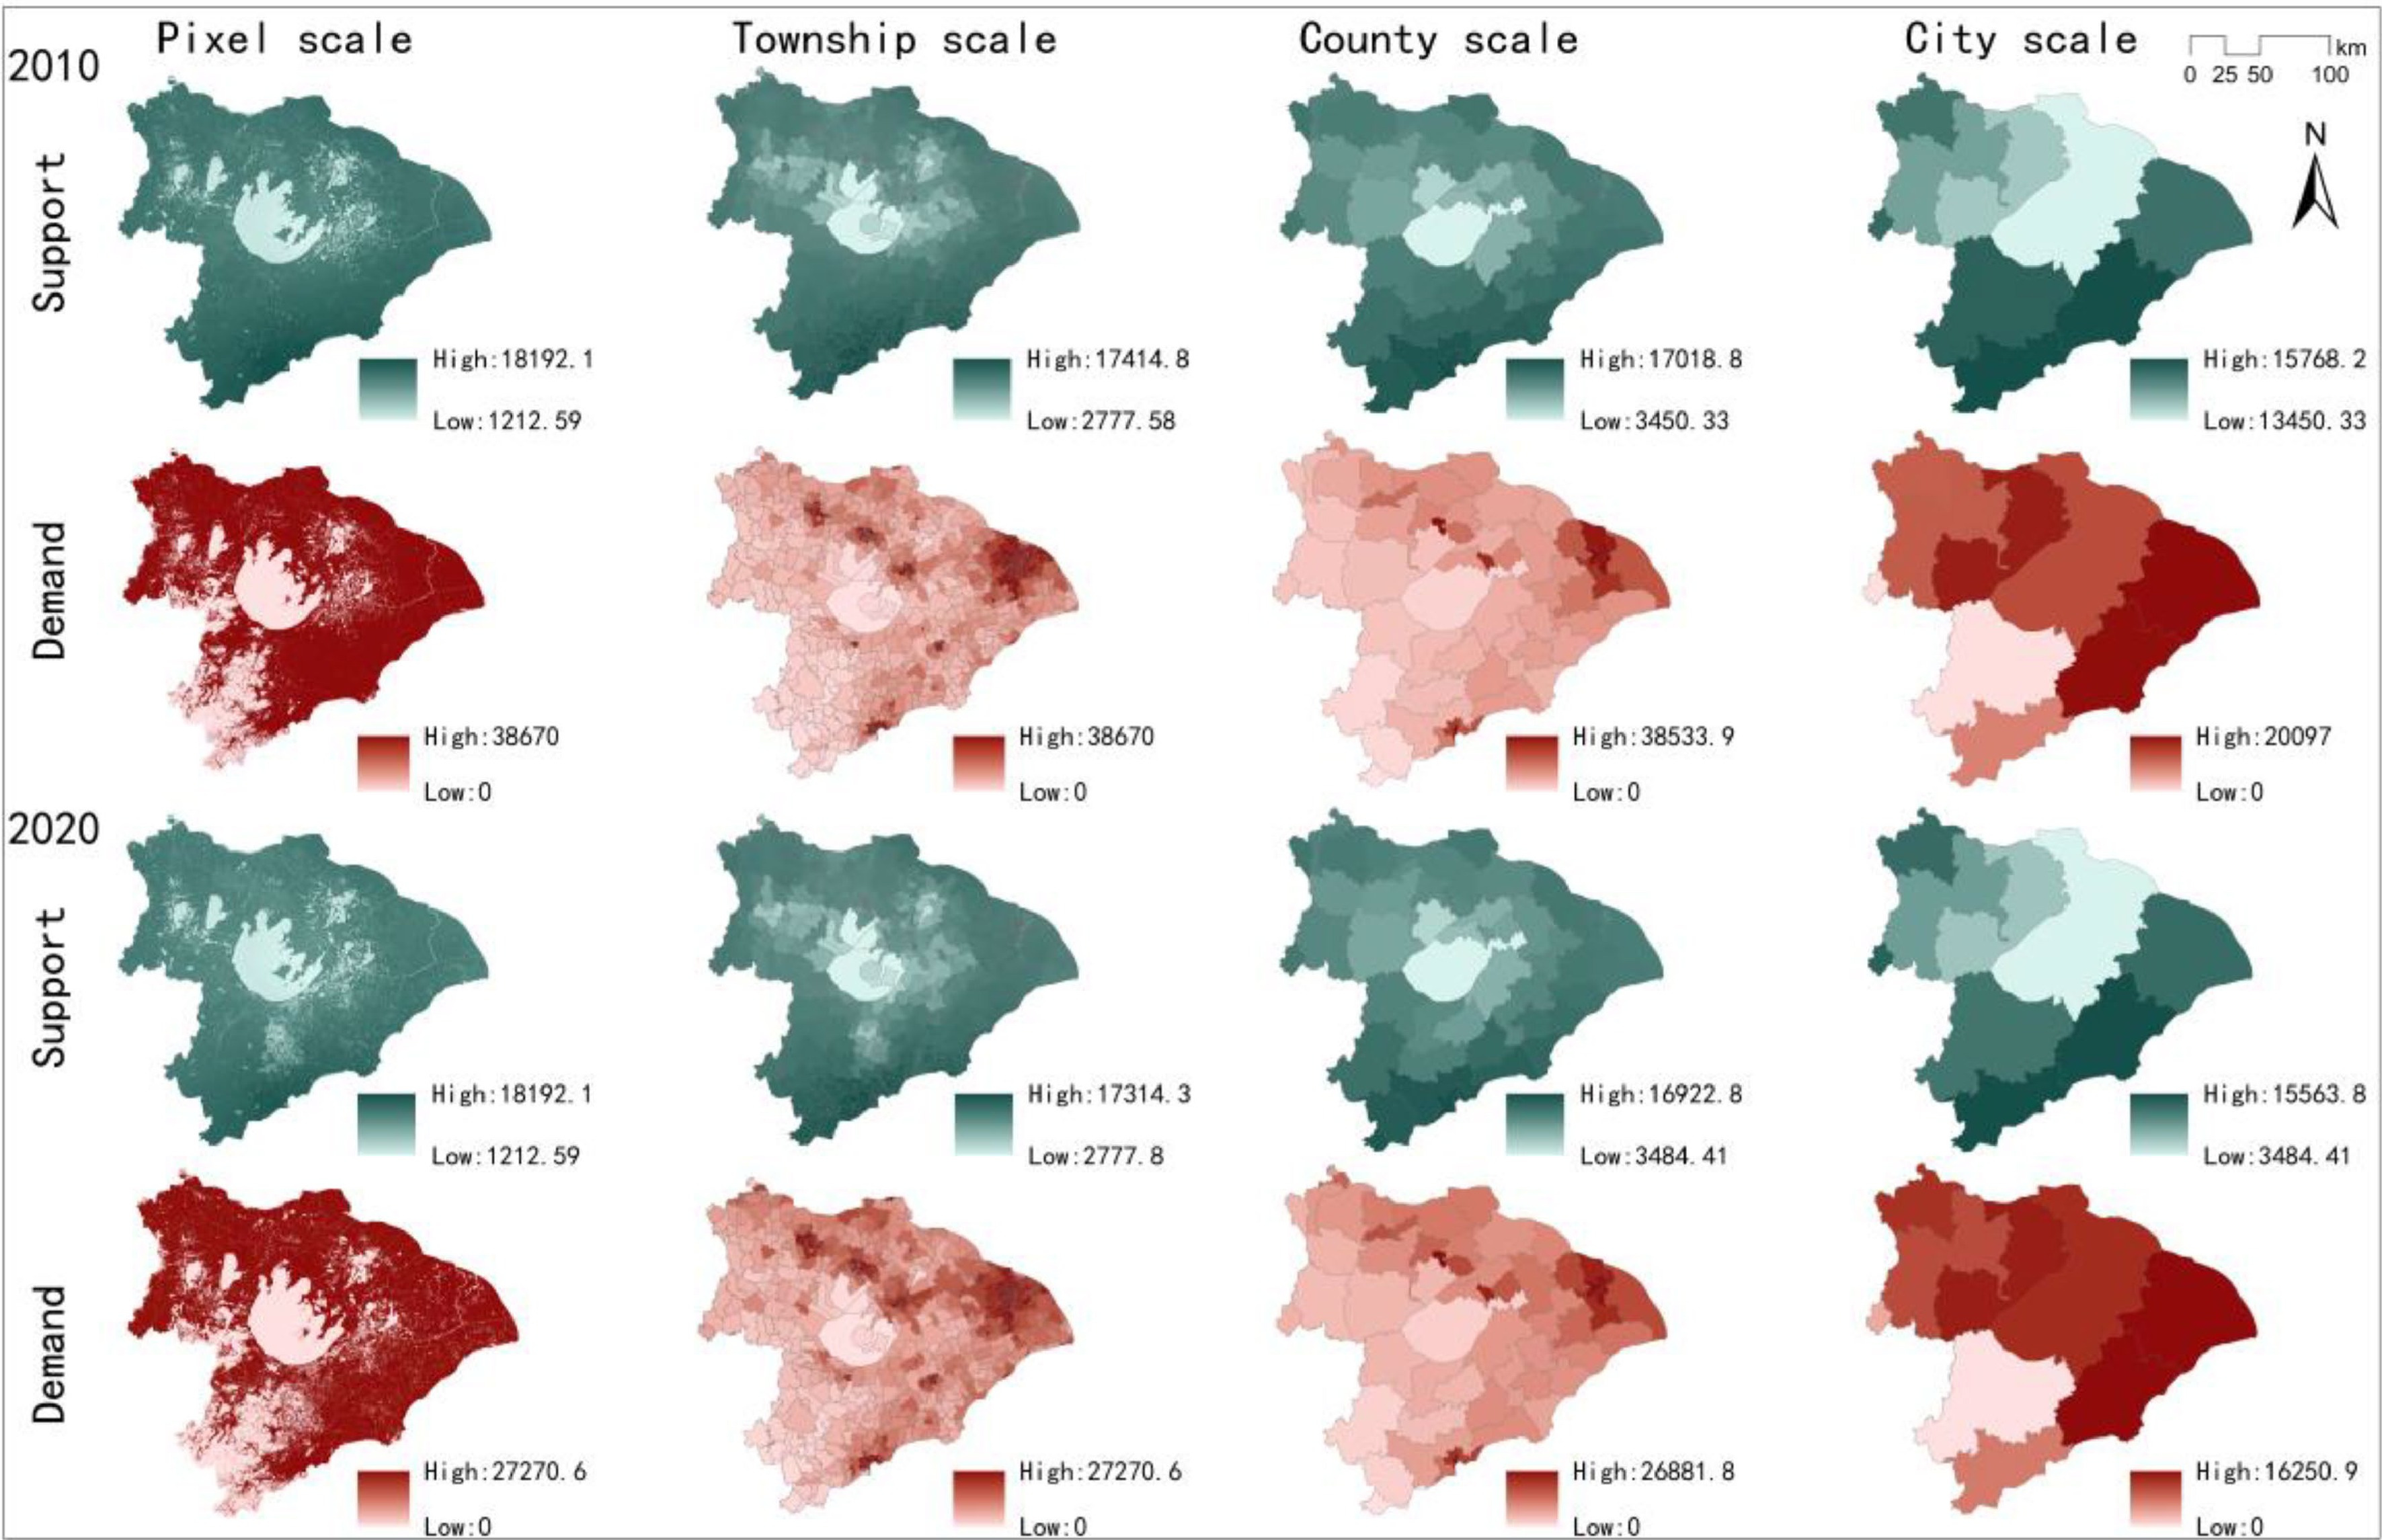
Figure 2.
Spatial distribution of supply and demand of water yield service.
-
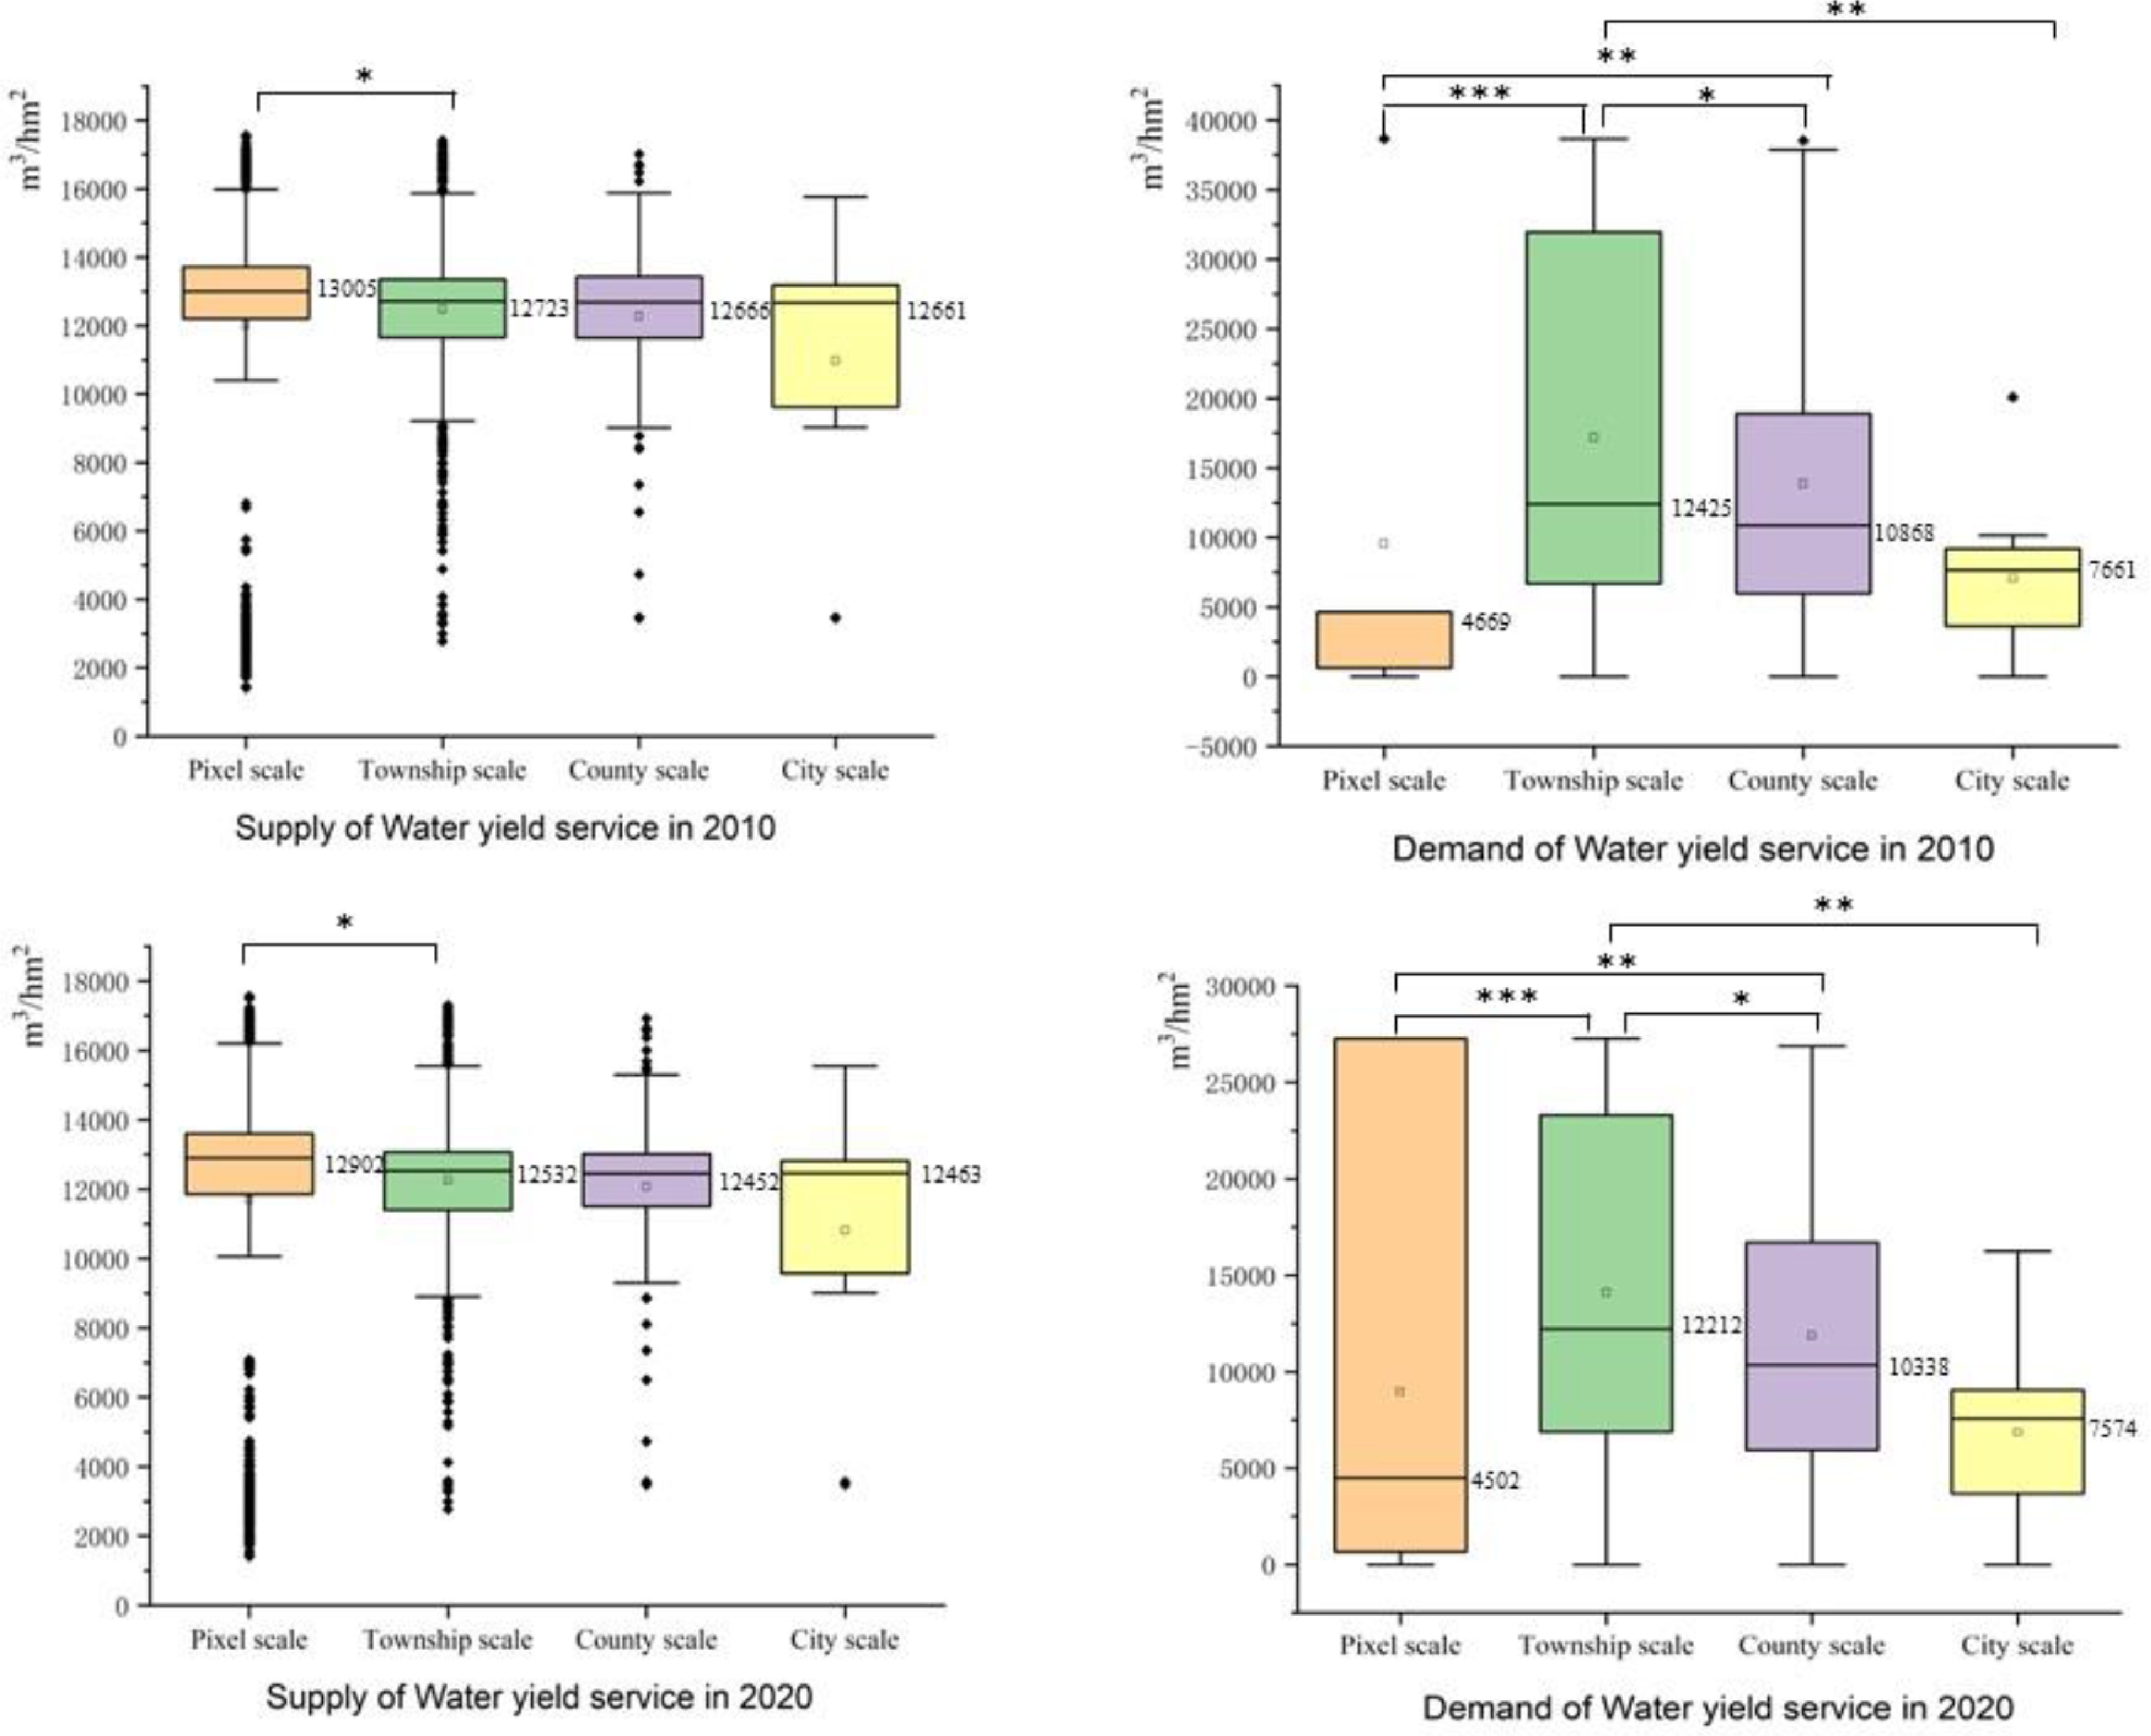
Figure 3.
Maps showing water yield supply, demand, and correlation analysis. (When p < 0.05, it is marked with '*'. When p < 0.01, it is marked with '**'. When p < 0.001, it is marked with '***') in TLB in 2010 and 2020.
-
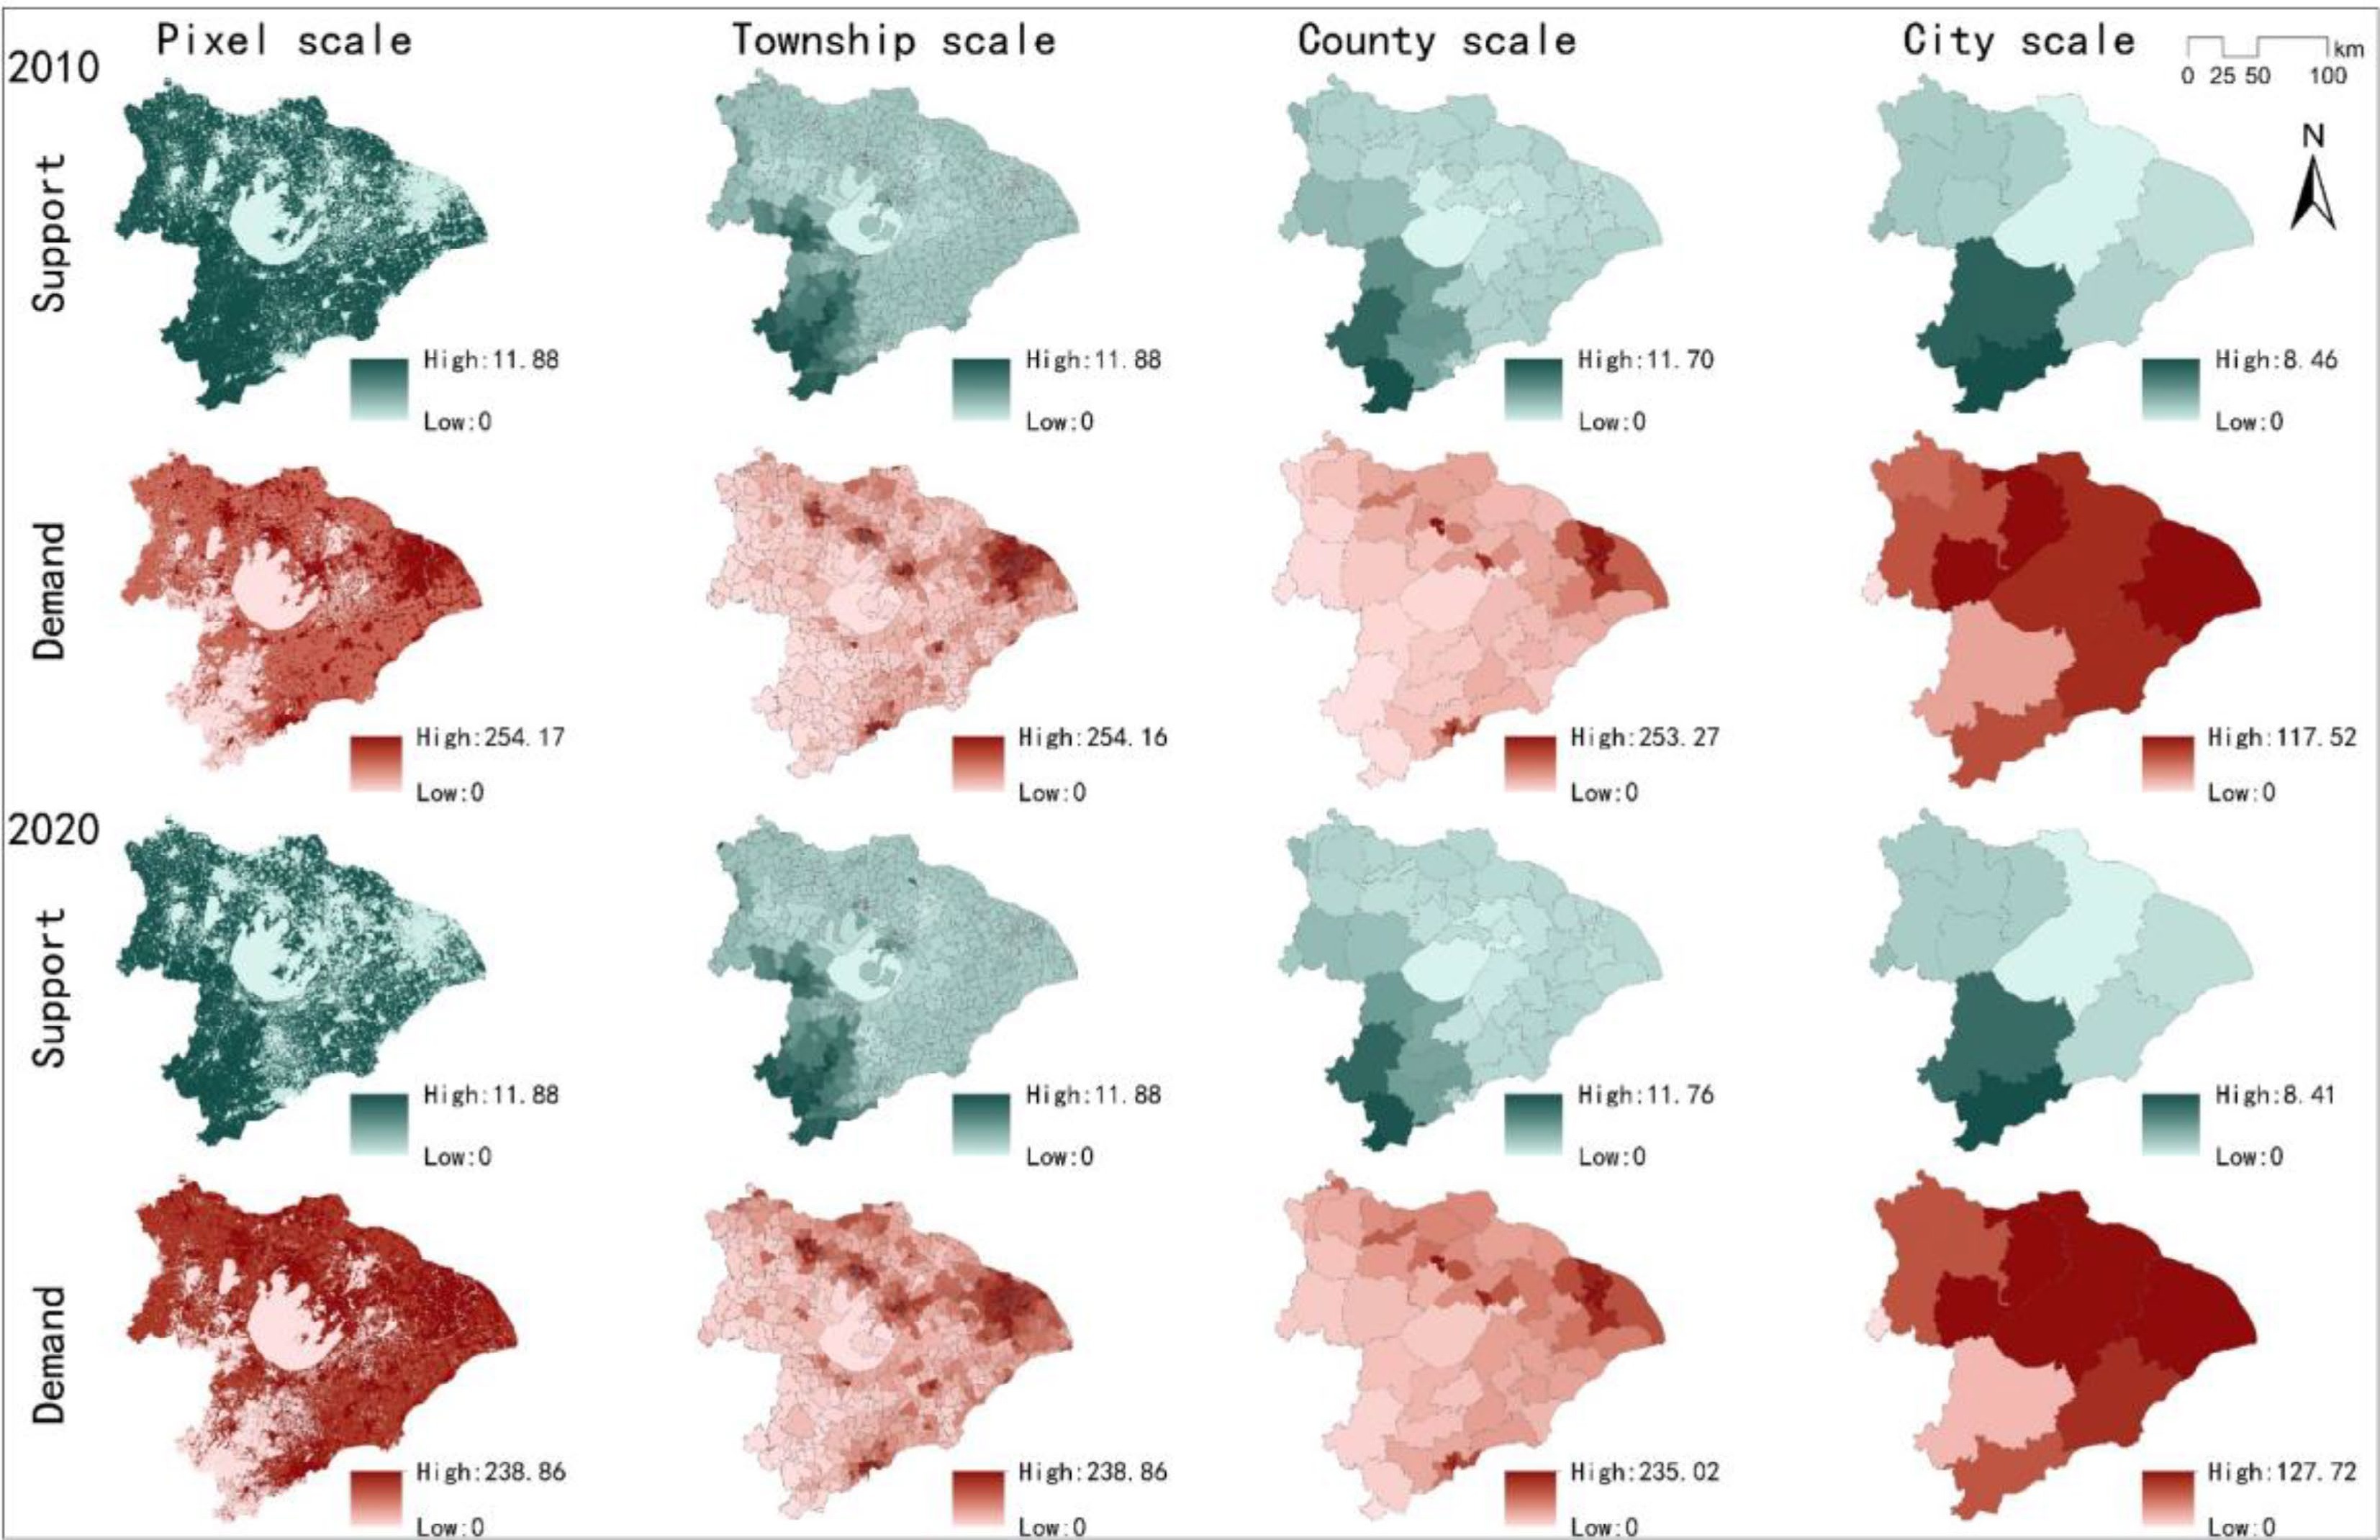
Figure 4.
Spatial distribution of supply and demand of carbon sequestration service.
-
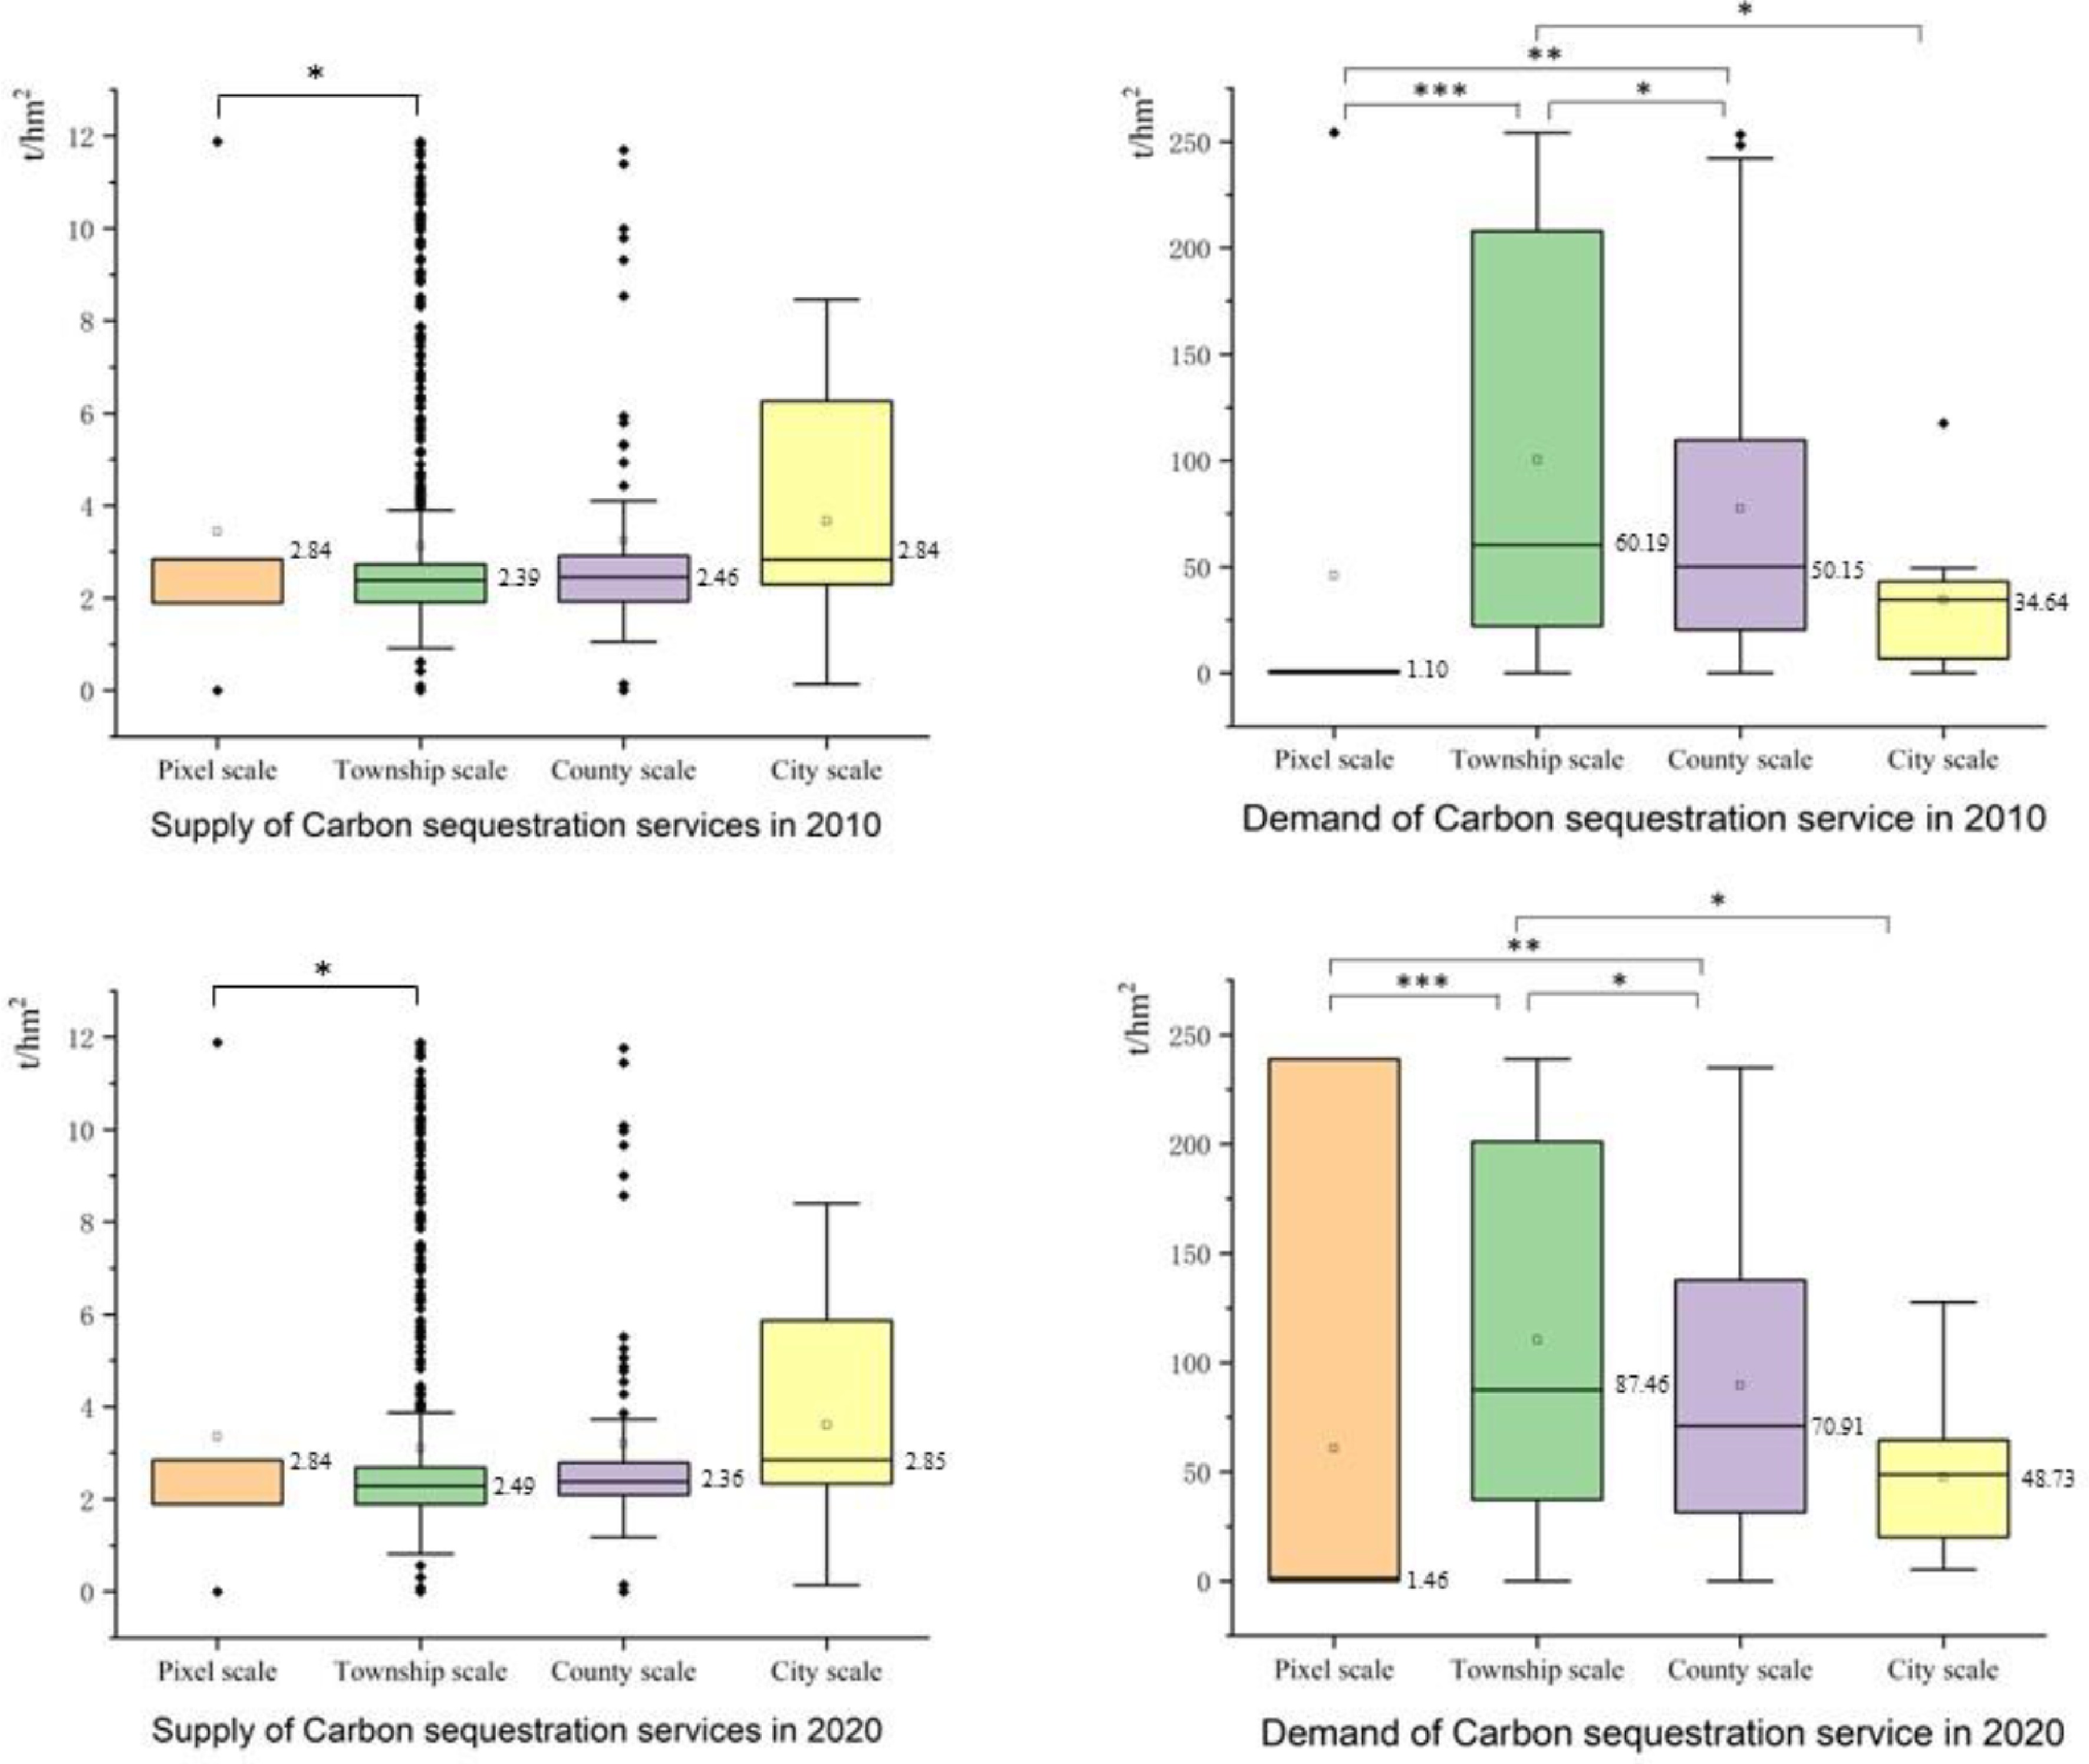
Figure 5.
Maps showing carbon sequestration supply, demand, and correlation analysis. (When p < 0.05, it is marked with '*'. When p < 0.01, it is marked with '**'. When p < 0.001, and it is marked with '***') in TLB in 2010 and 2020.
-
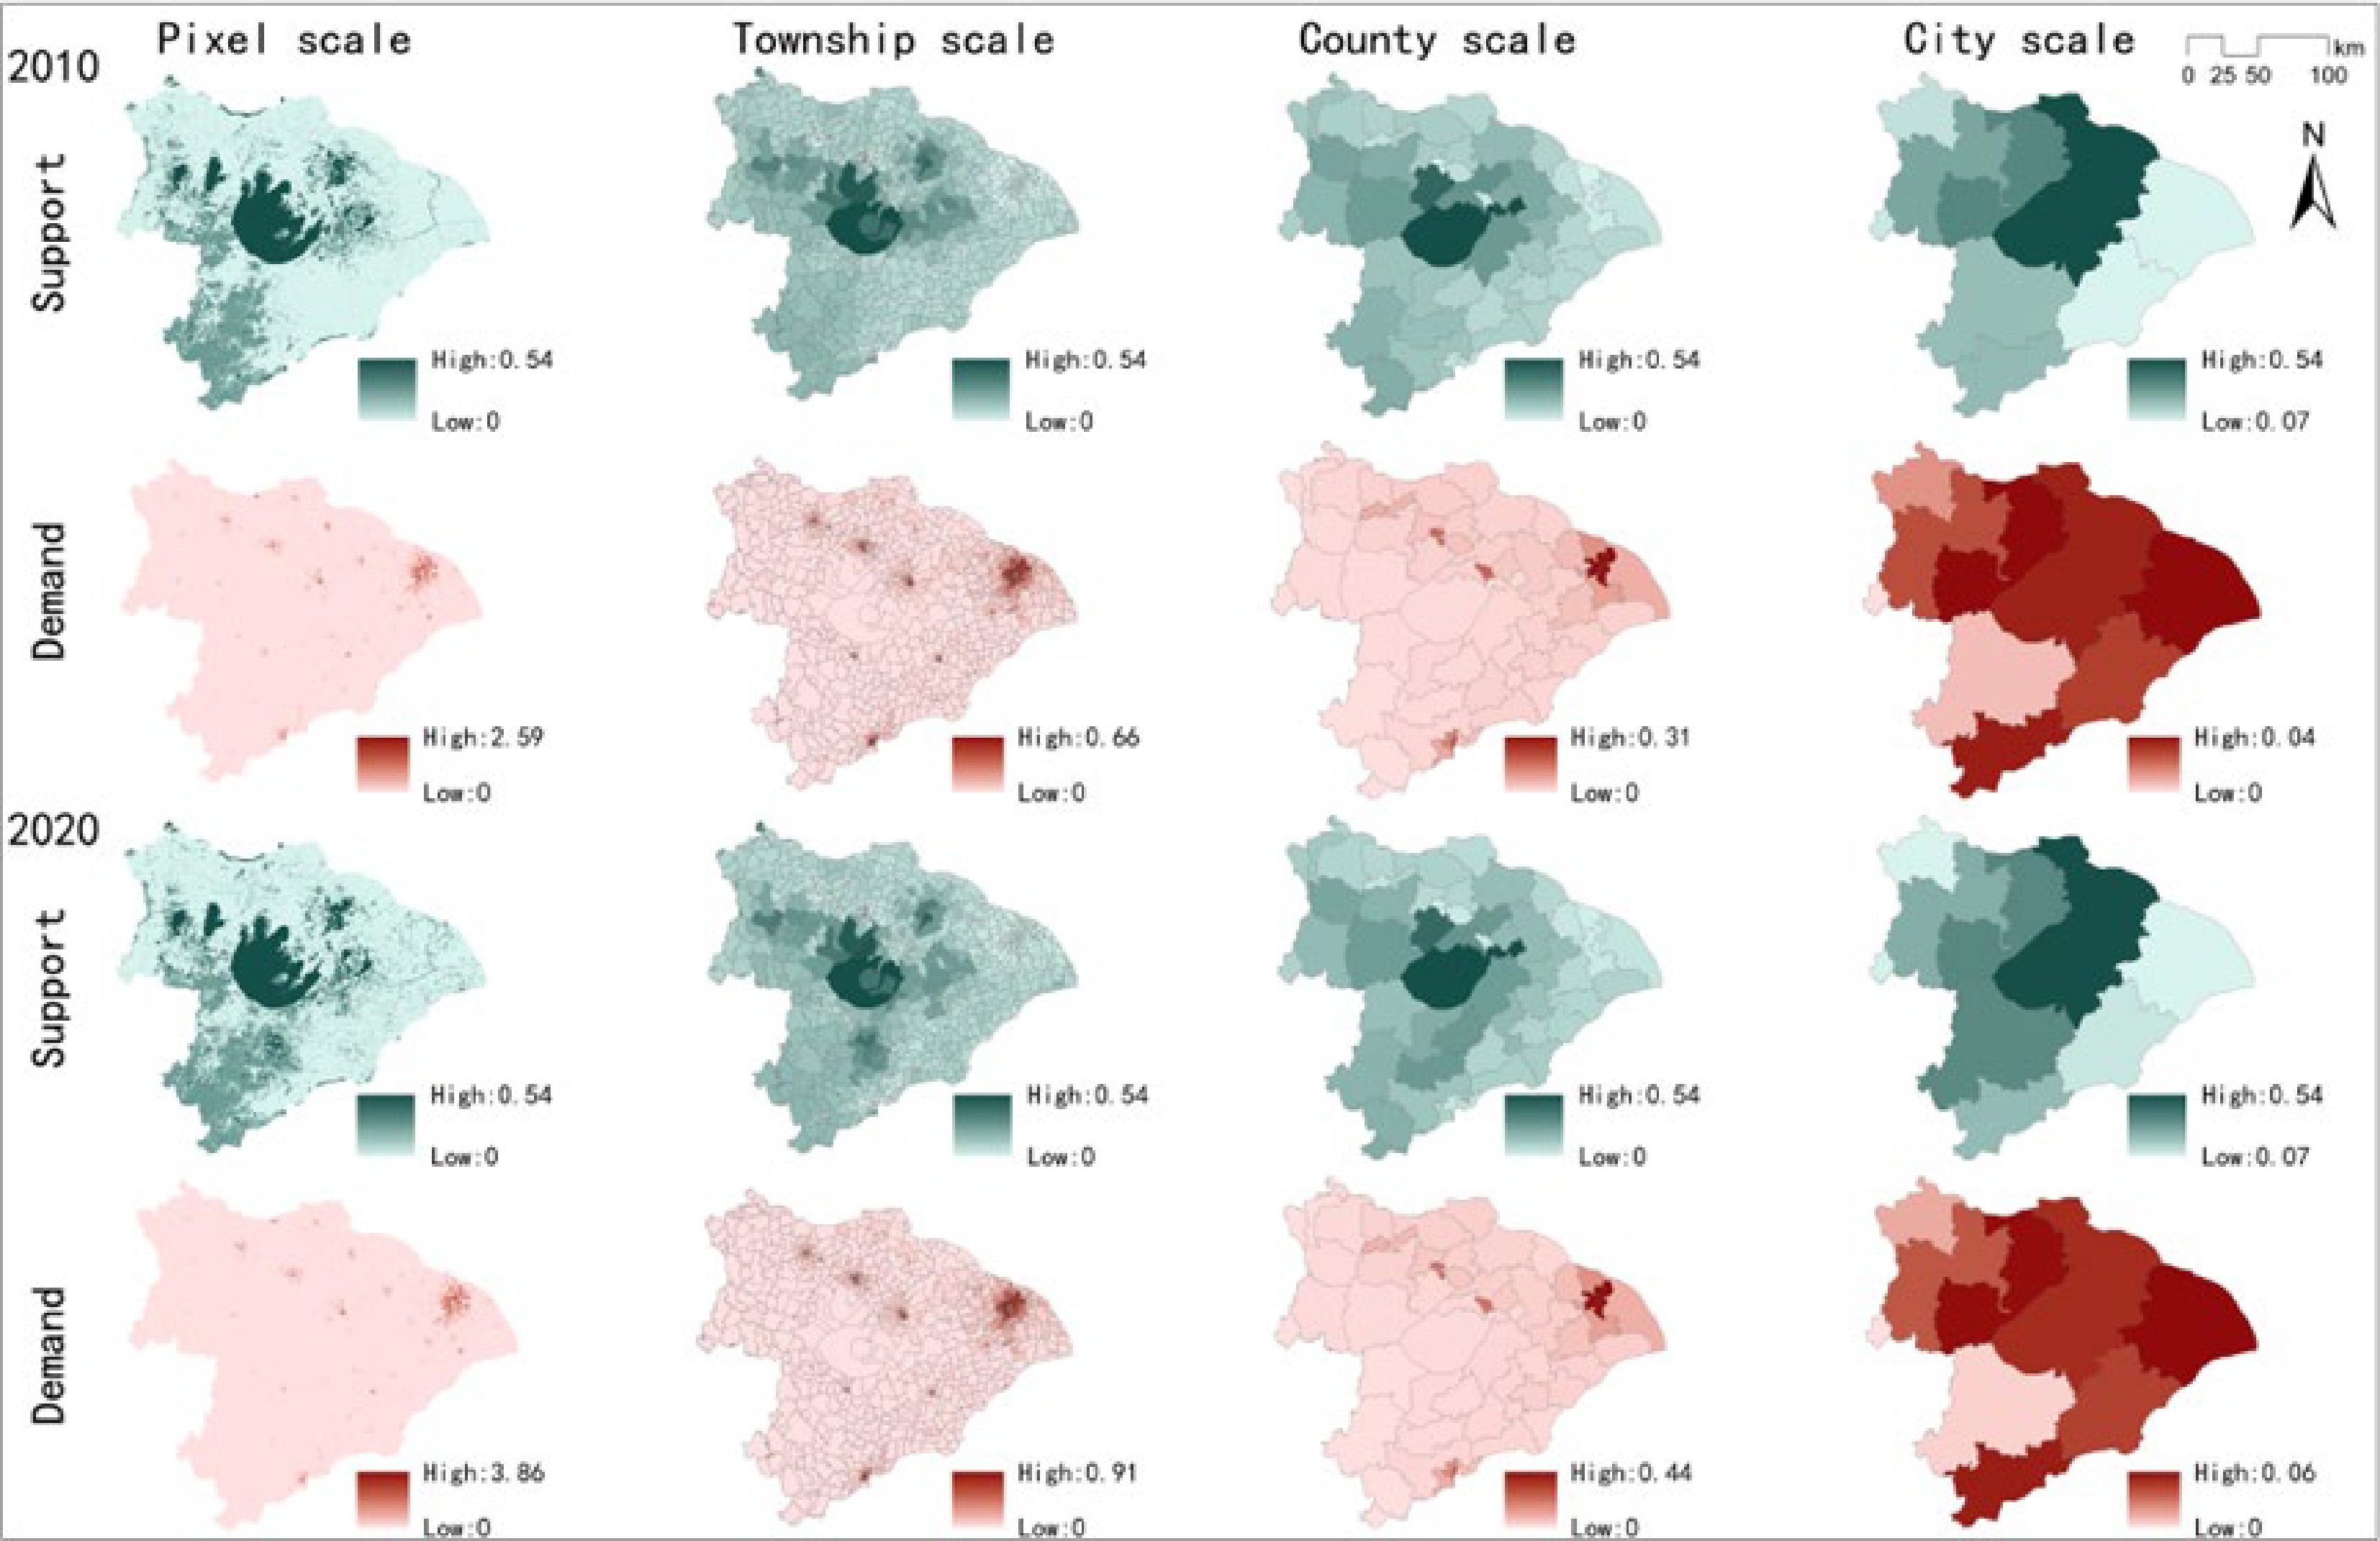
Figure 6.
Spatial distribution of supply and demand of recreation service.
-
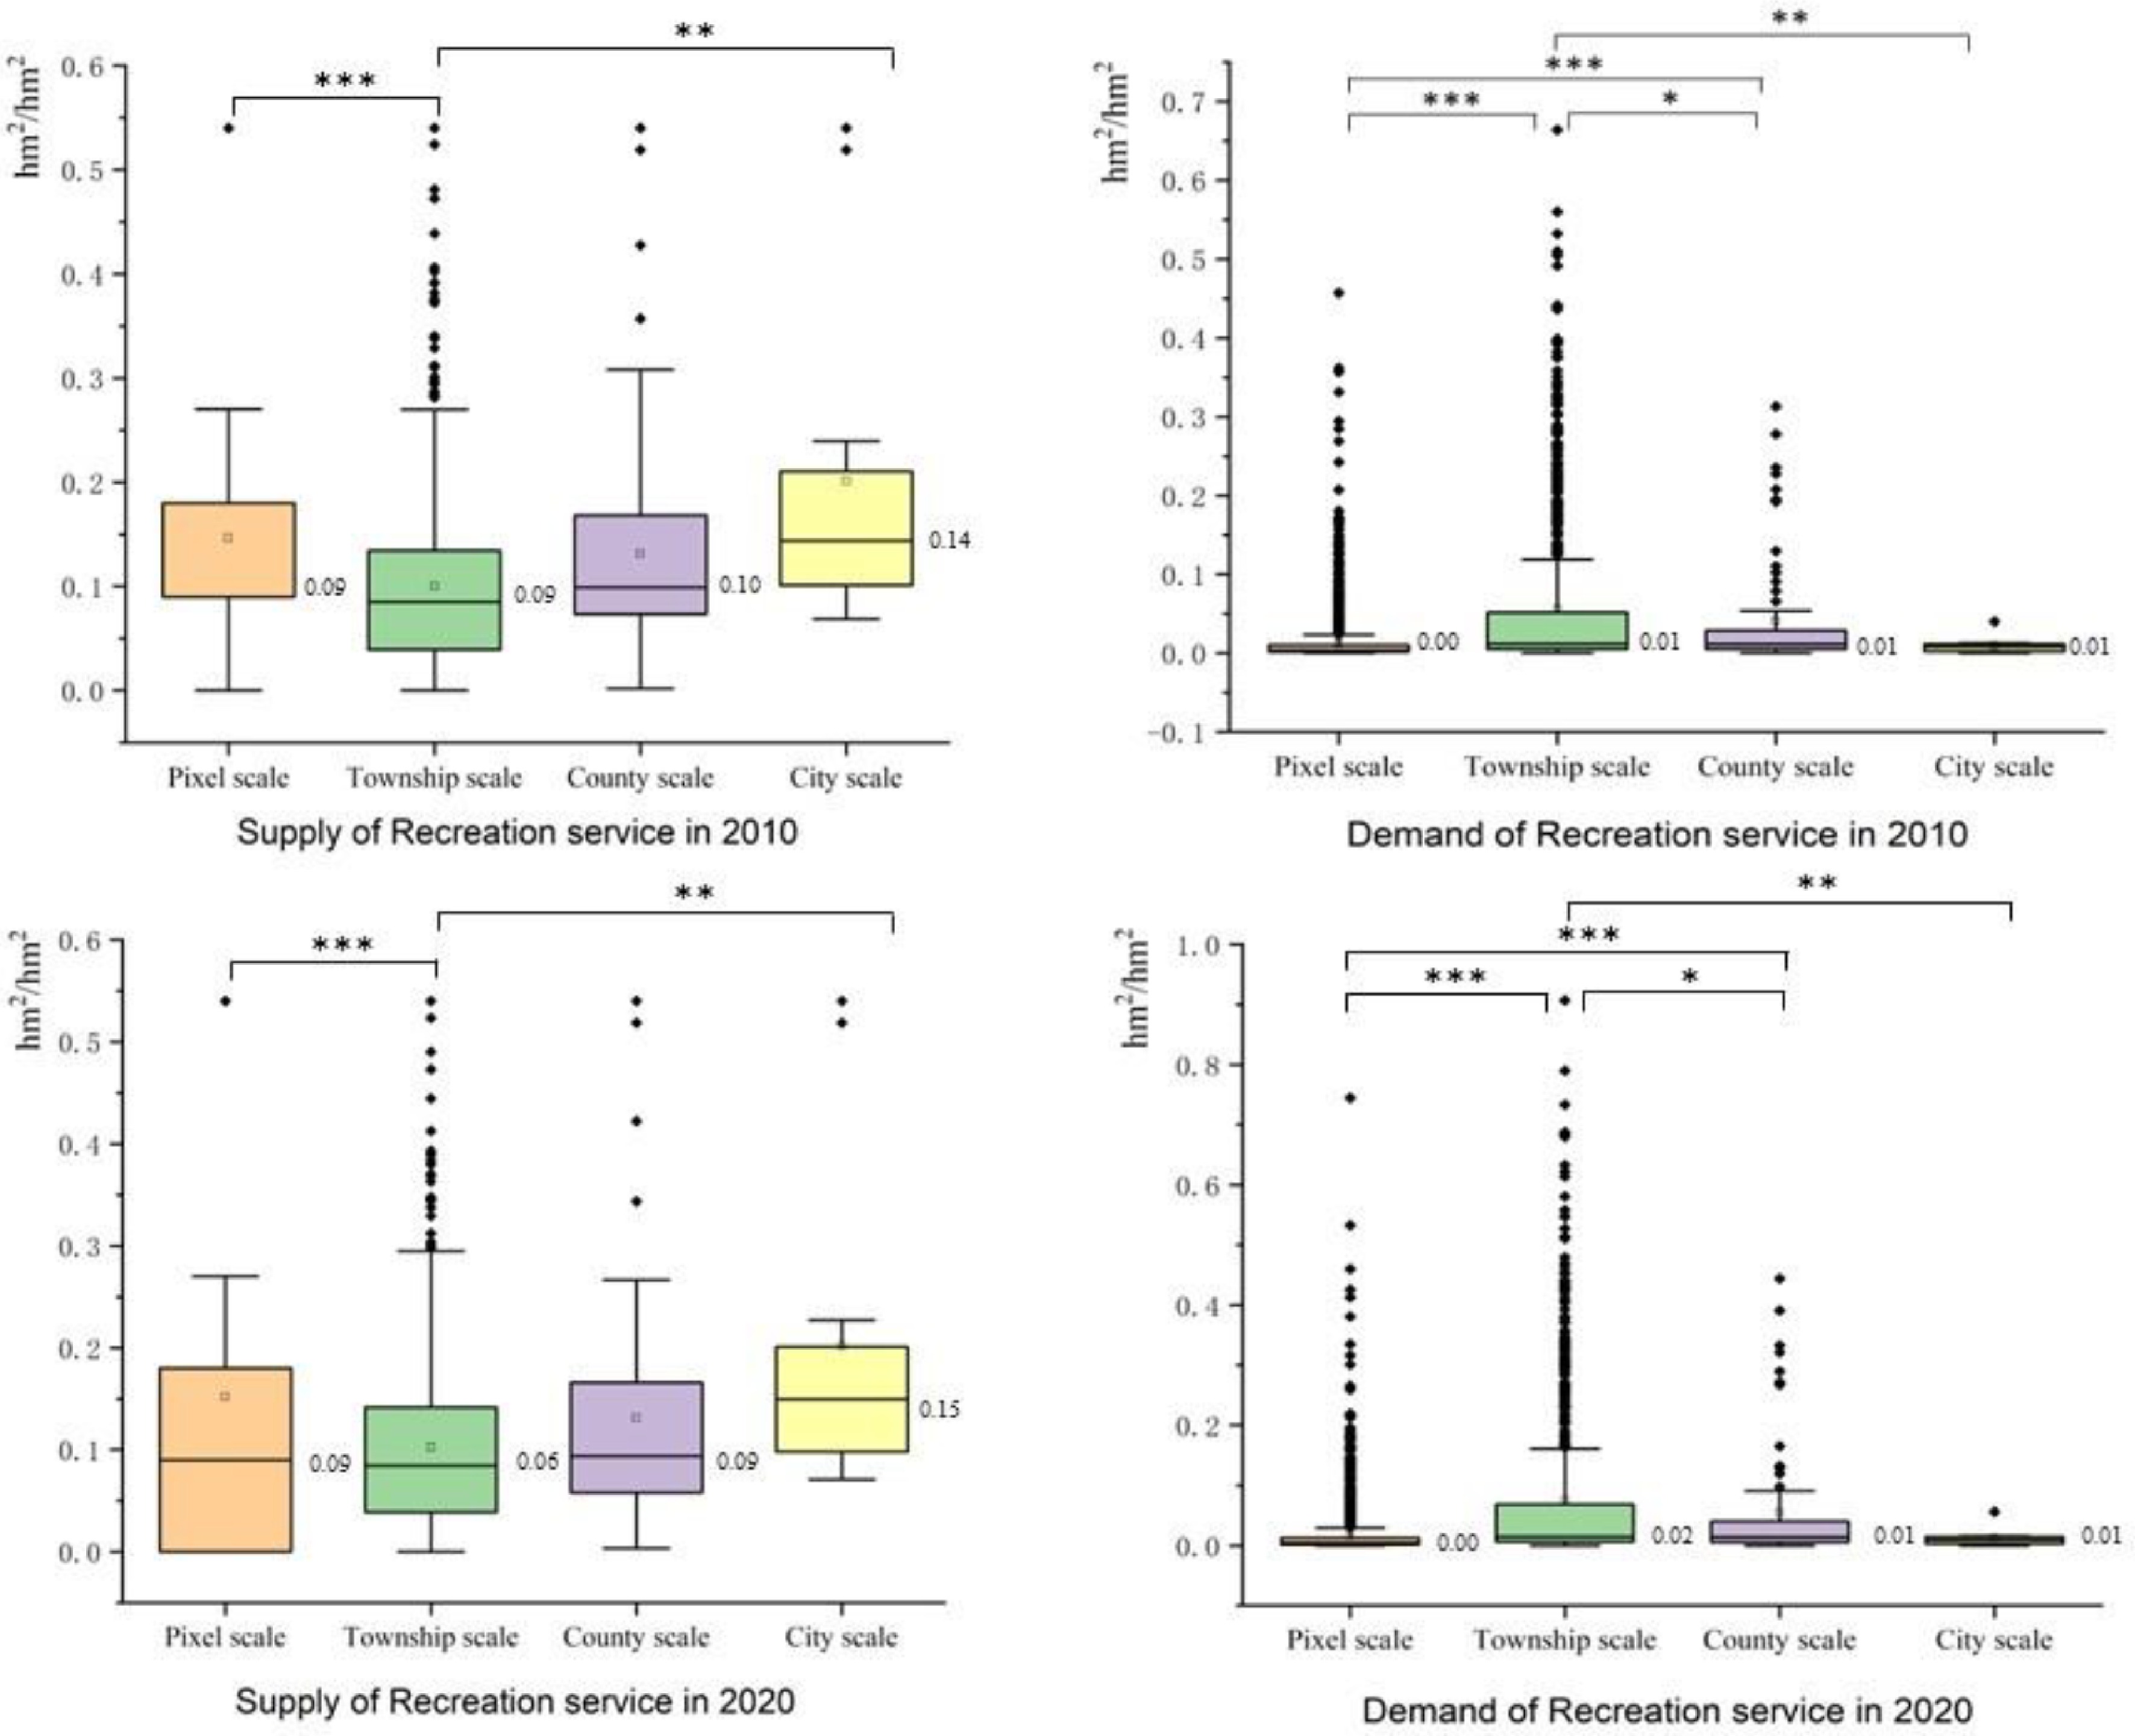
Figure 7.
Maps showing recreation supply, demand, and correlation analysis. (When p < 0.05, it is marked with '*'. When p < 0.01, it is marked with '**'. When p < 0.001, it is marked with '***') in TLB in 2010 and 2020.
-
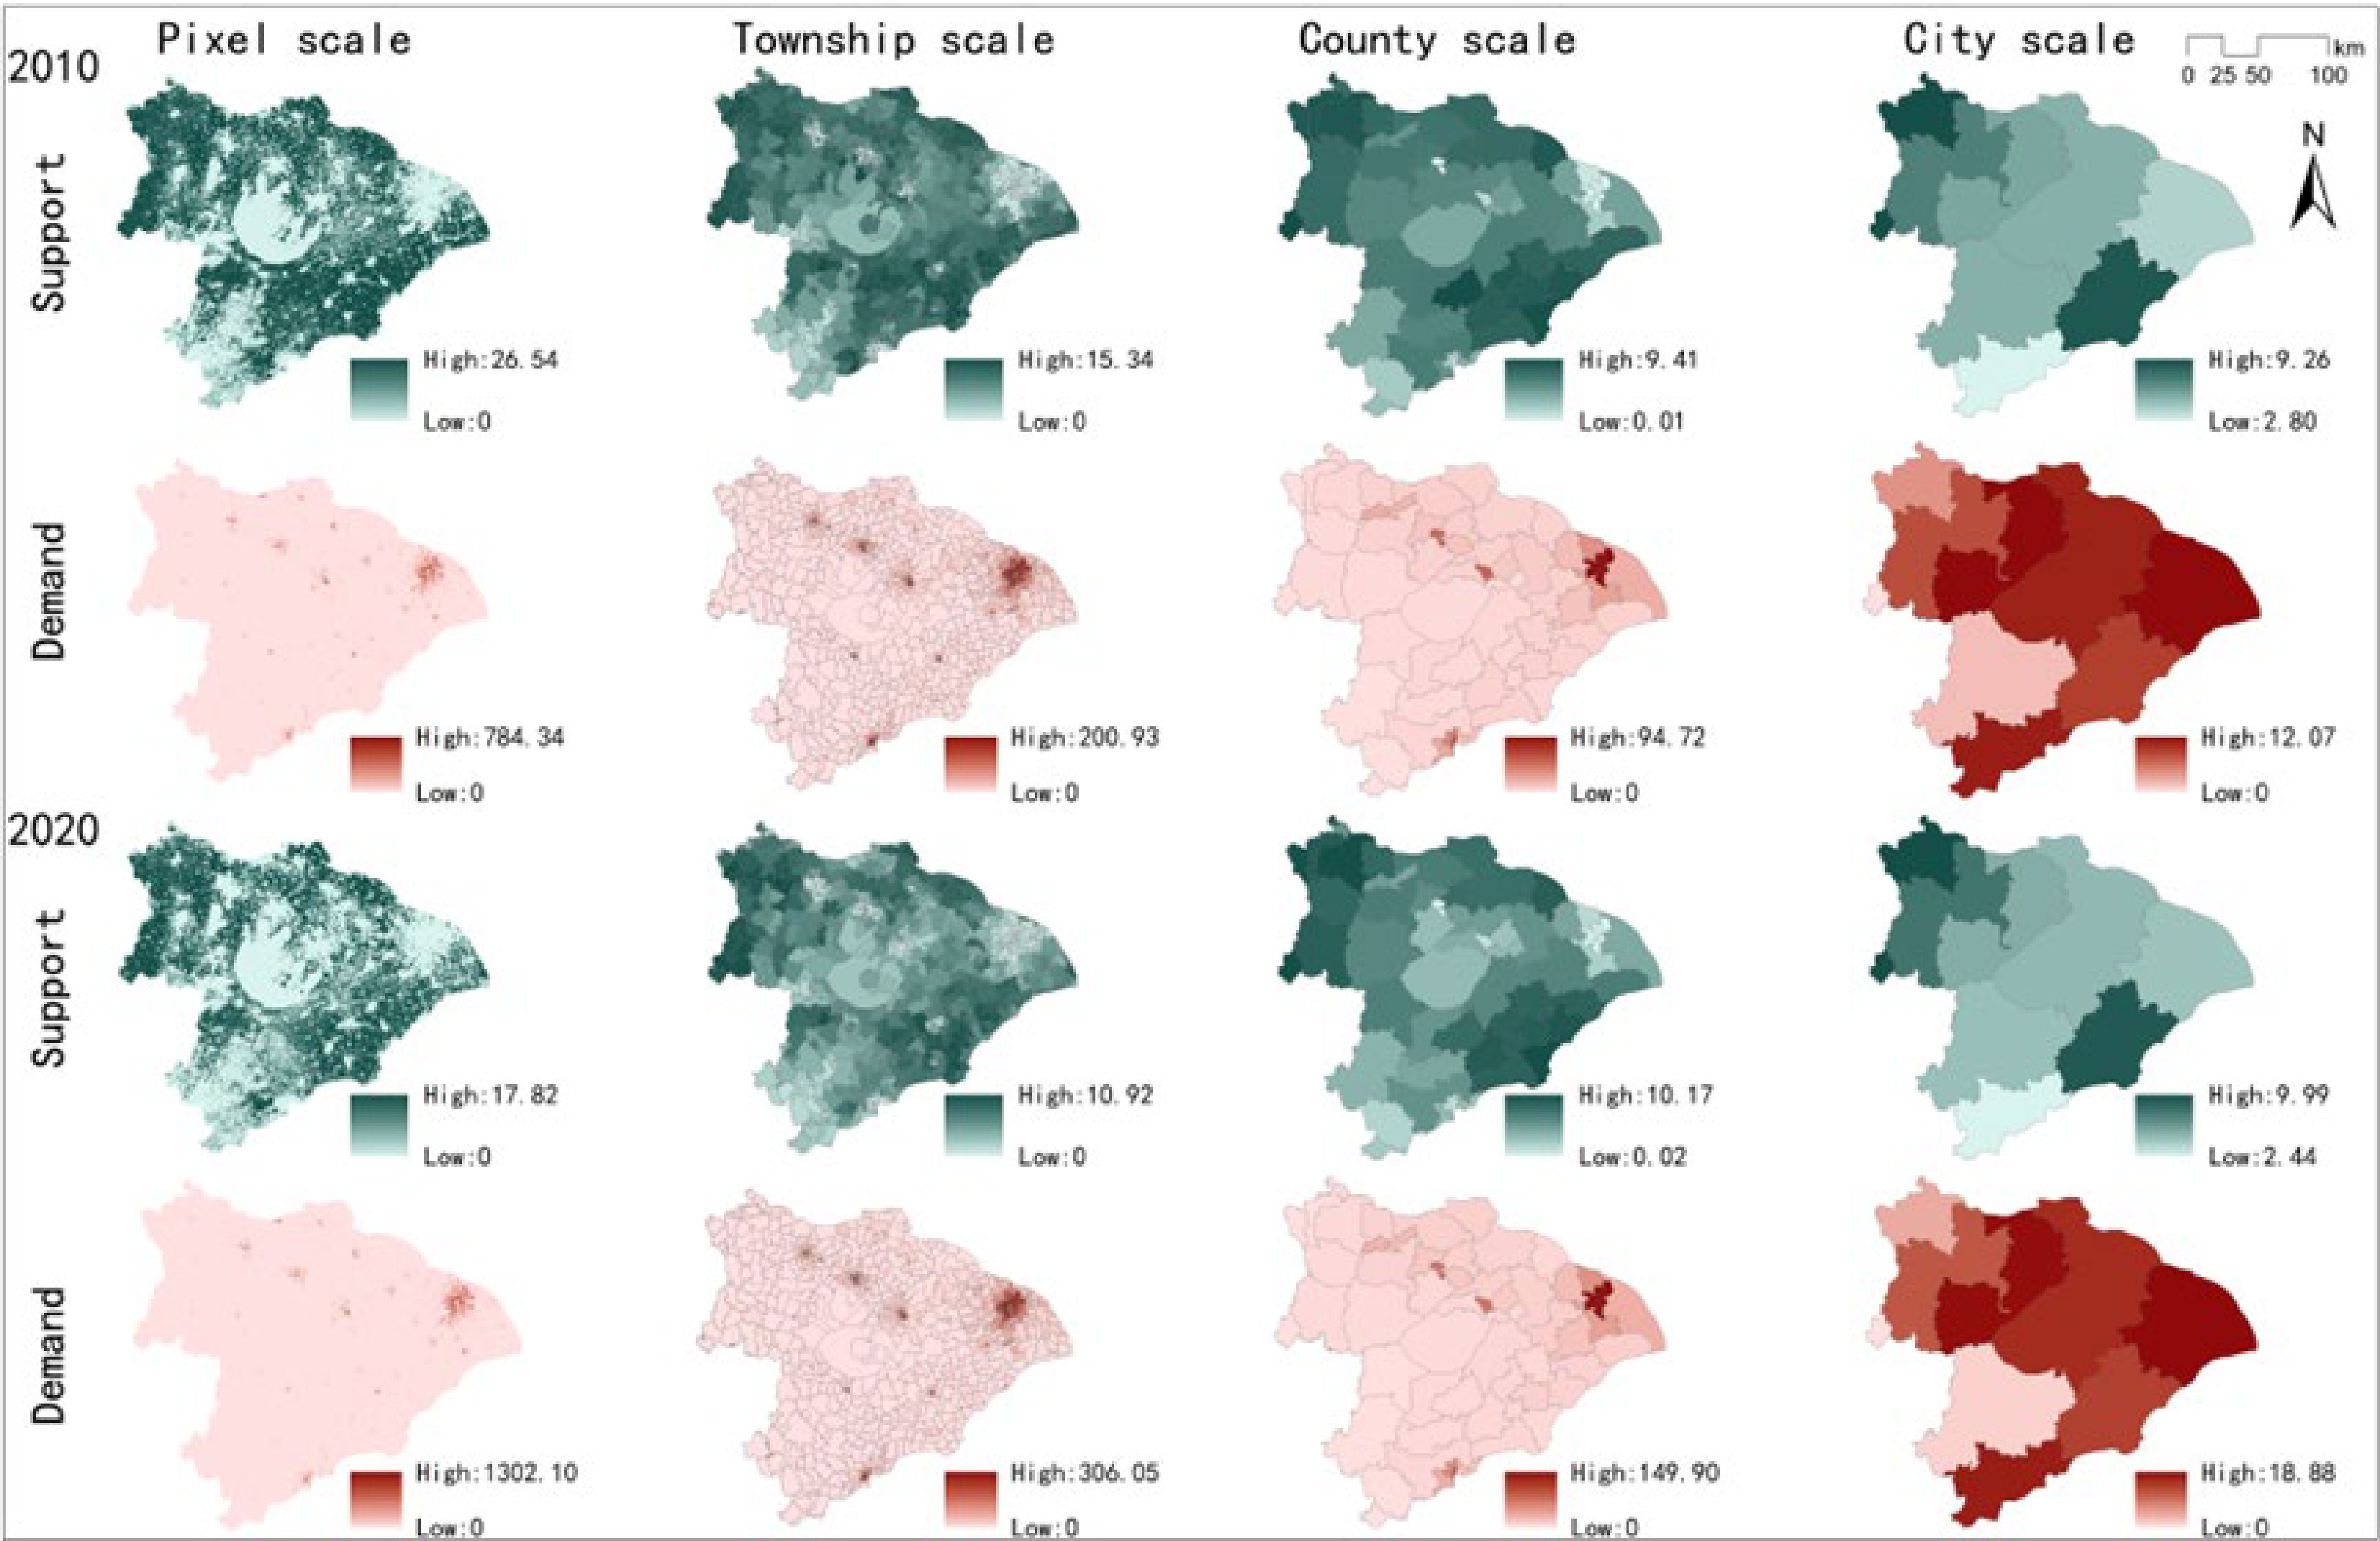
Figure 8.
Spatial distribution of supply and demand of food production service.
-
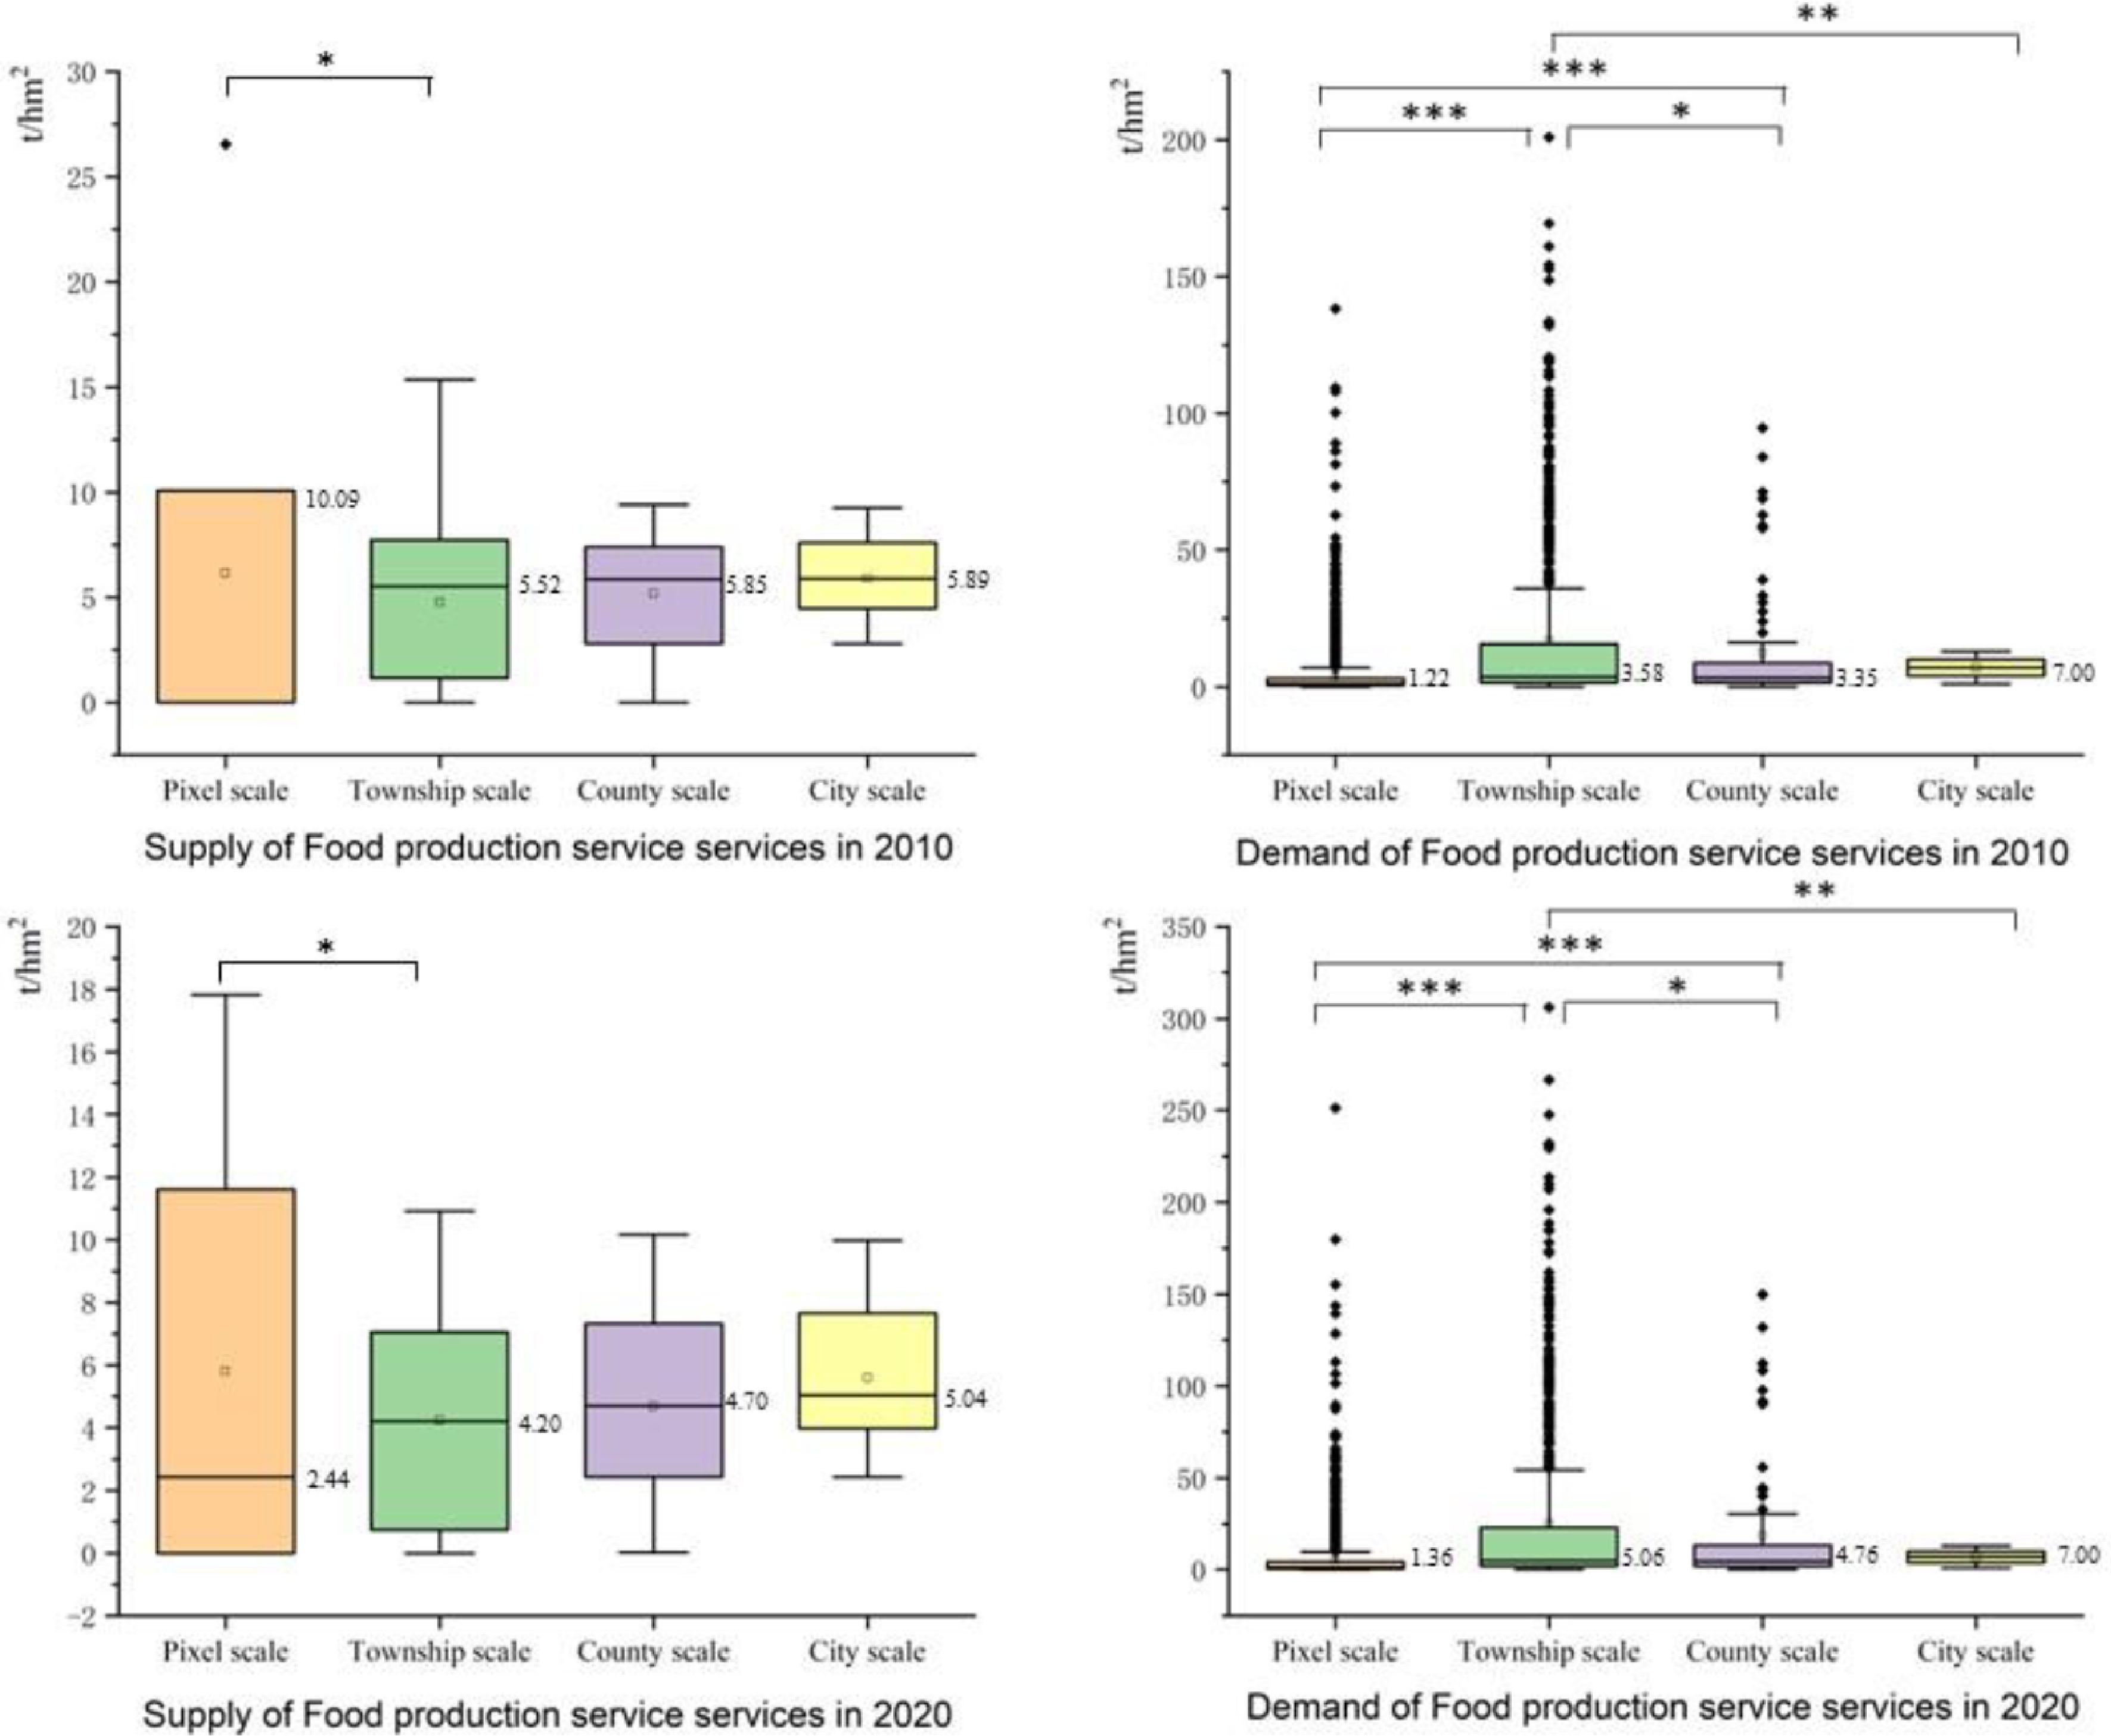
Figure 9.
Maps showing food production supply, demand, and correlation analysis. (When p < 0.05, it is marked with '*'. When p < 0.01, it is marked with '**'. When p < 0.001, it is marked with '***') in TLB in 2010 and 2020.
-
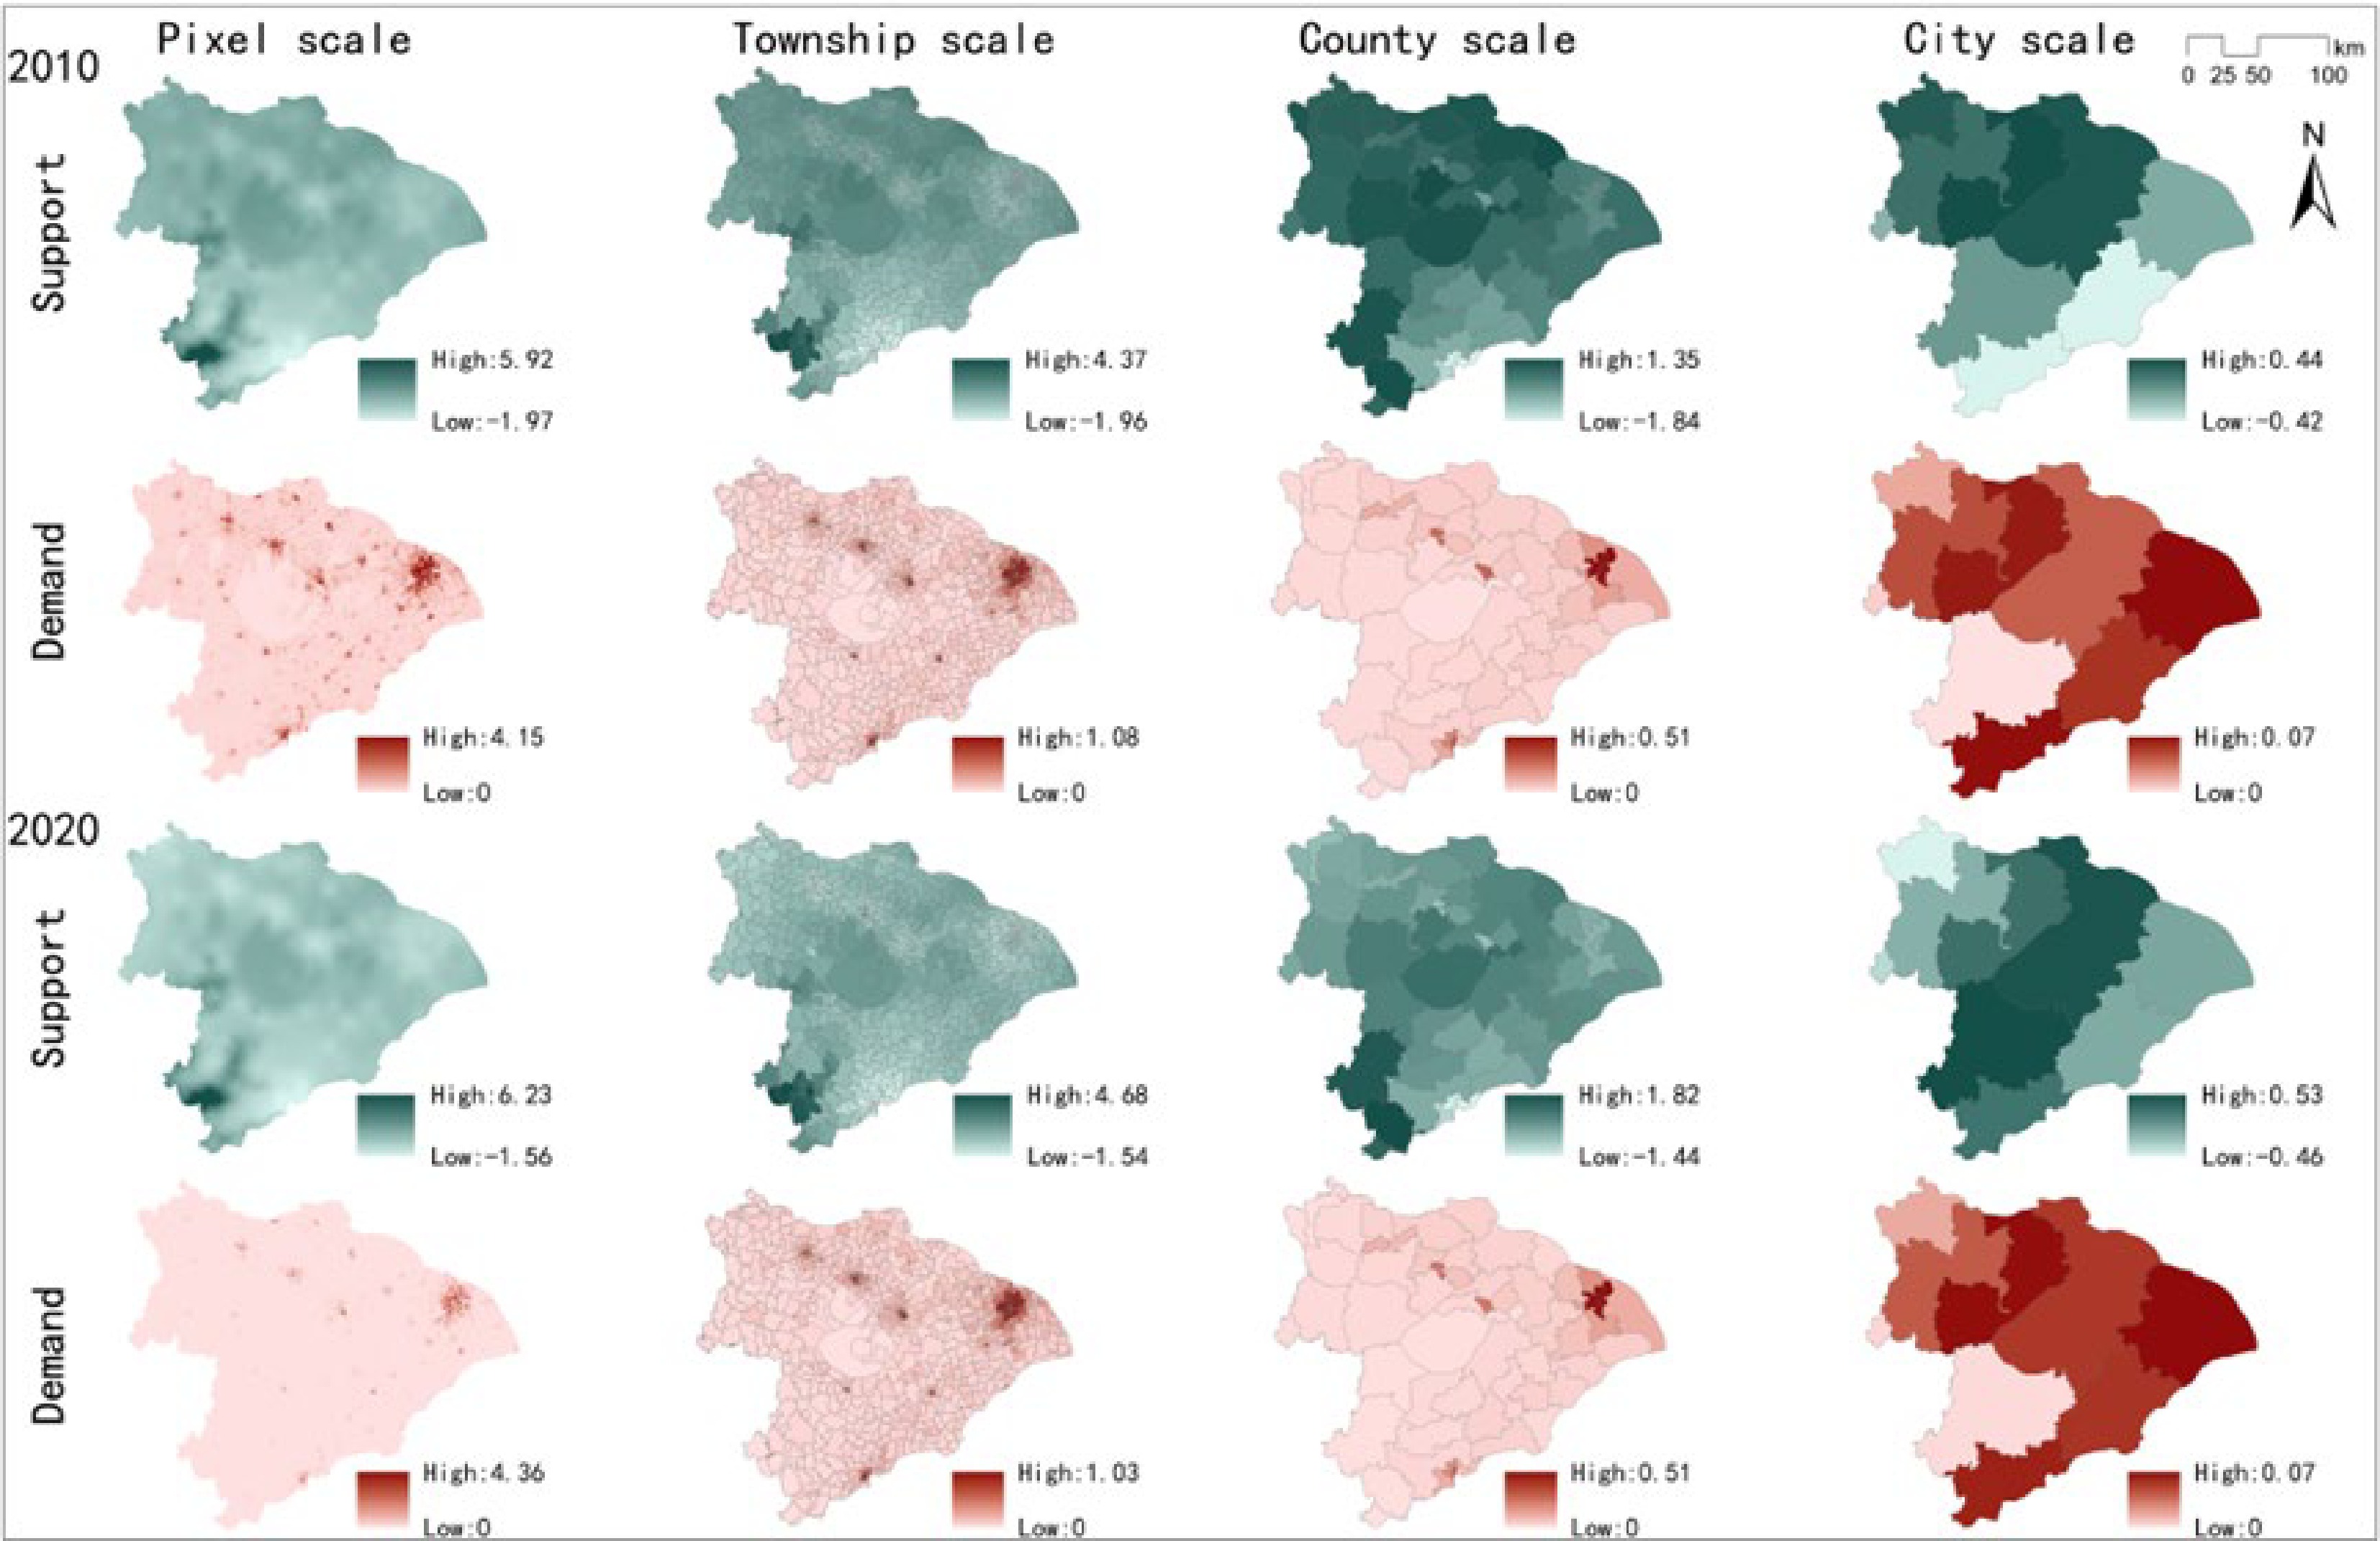
Figure 10.
Spatial distribution of supply and demand of heat regulation service.
-
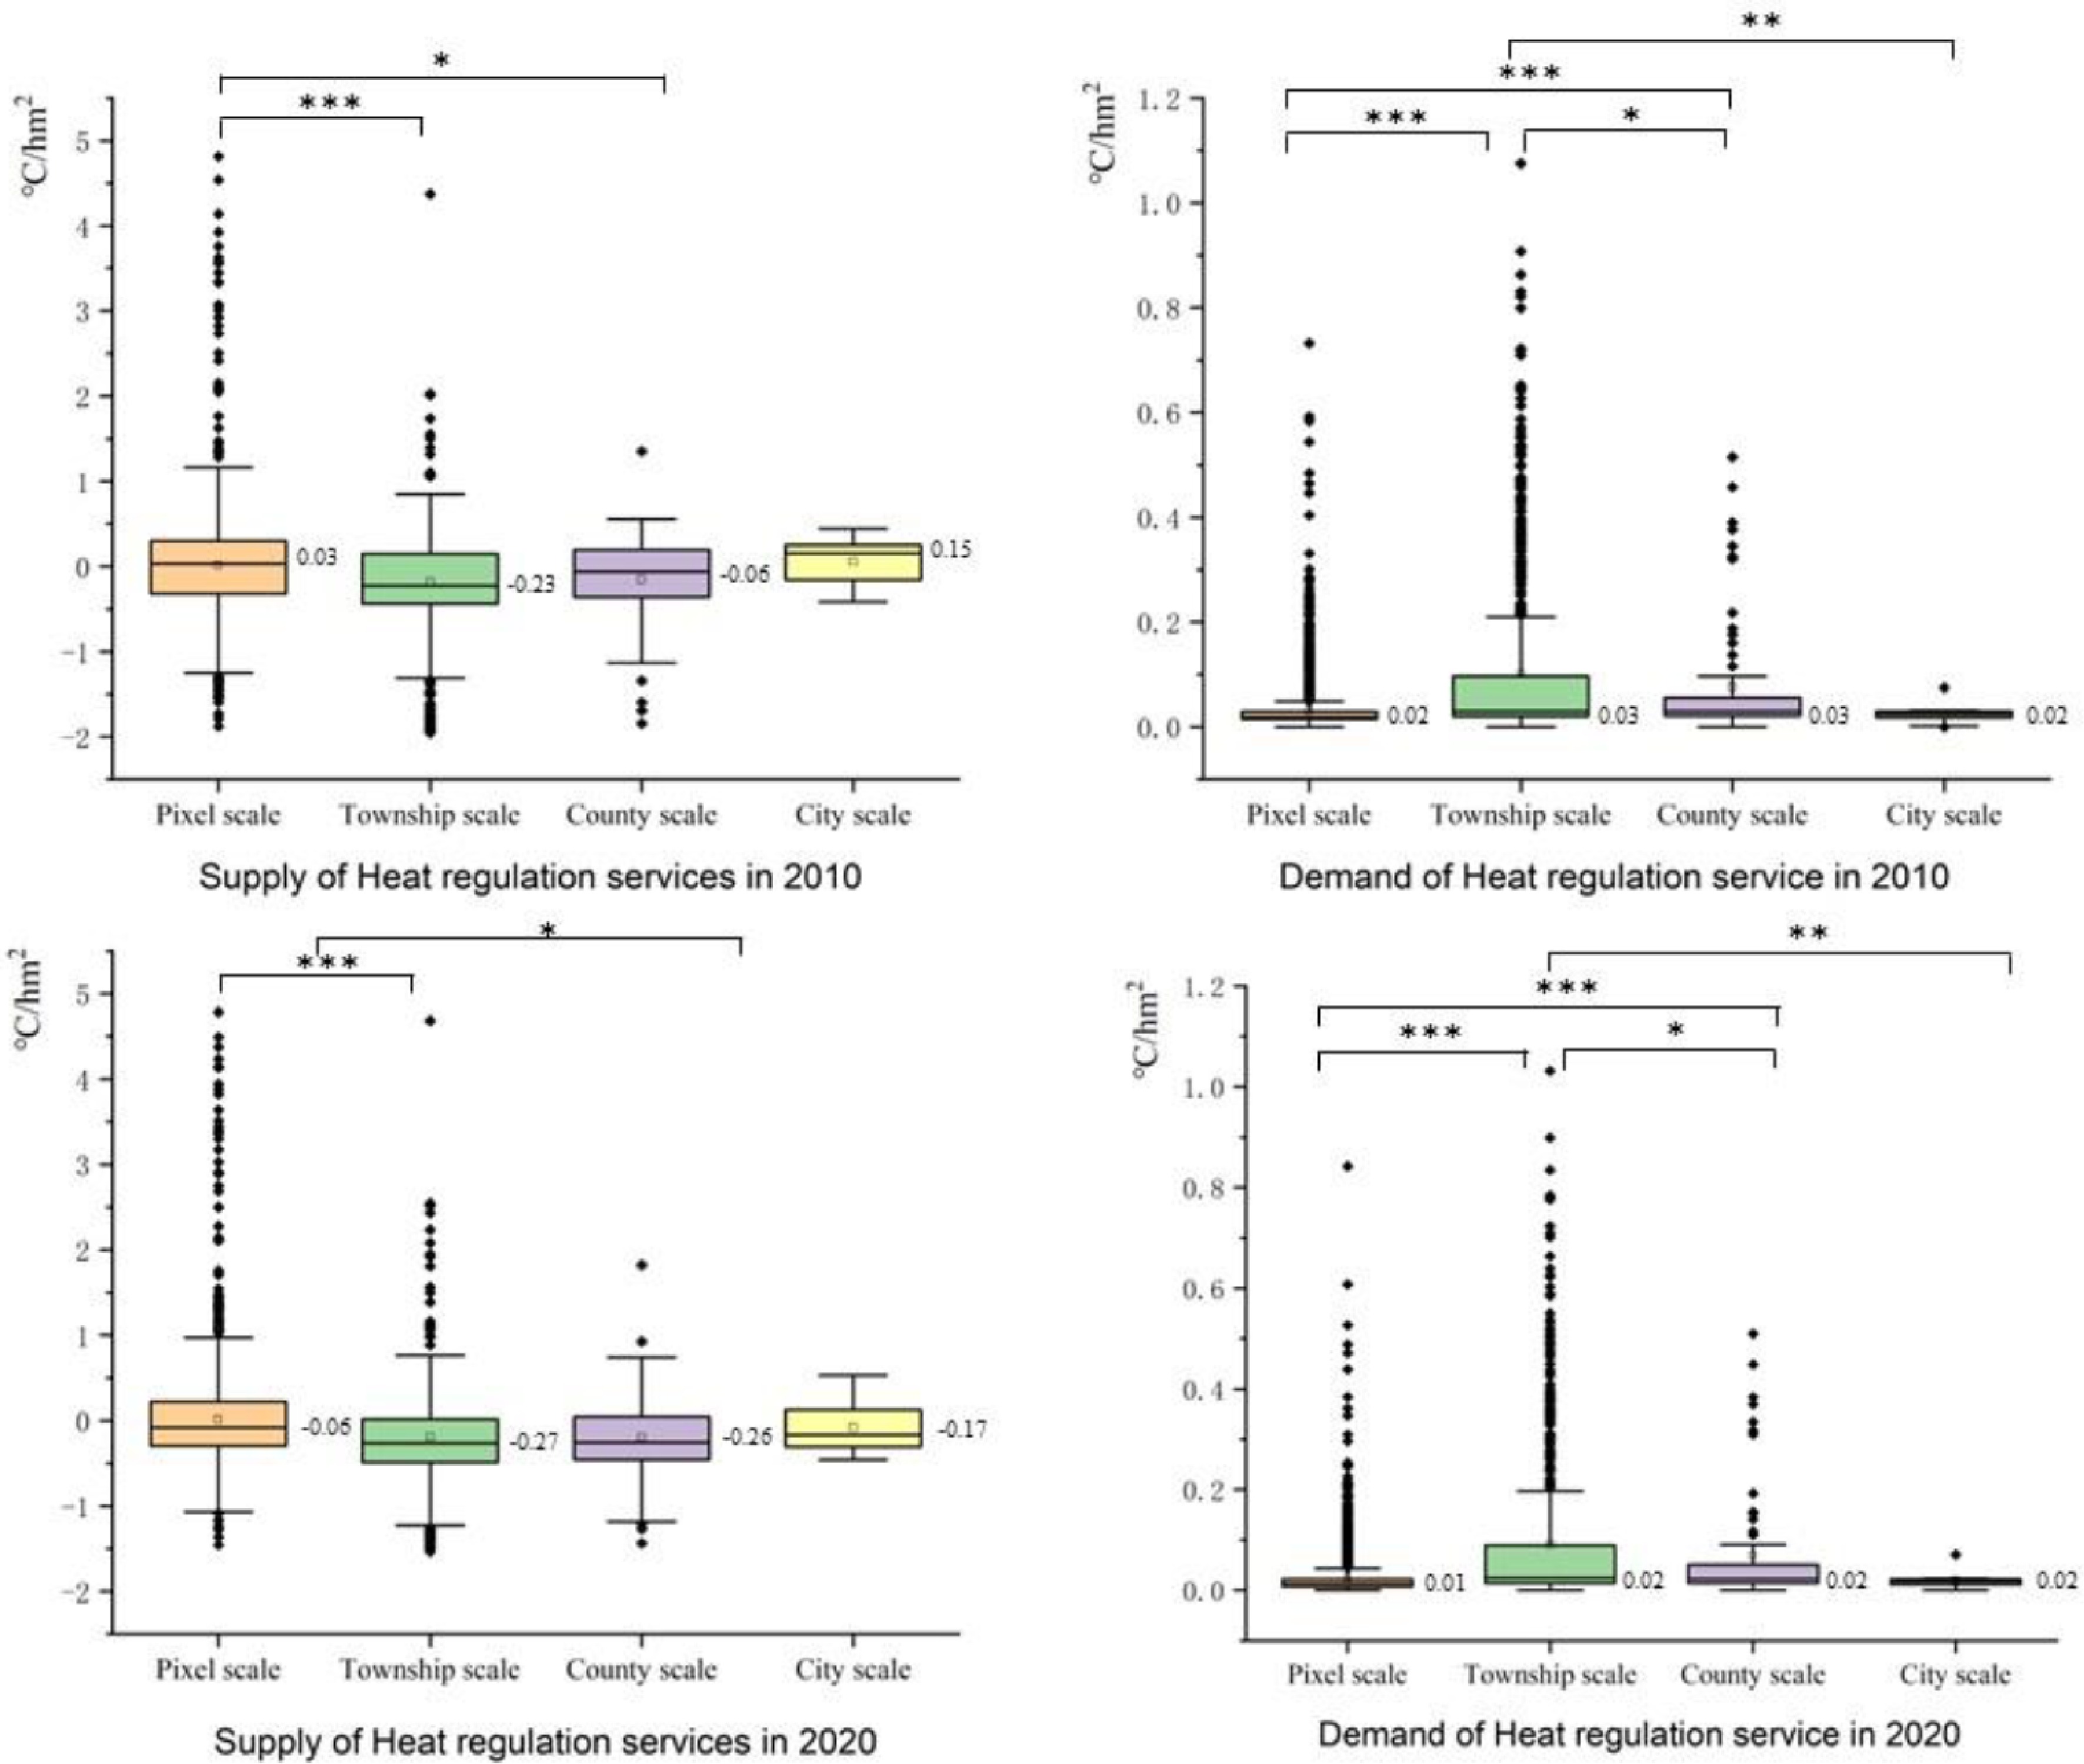
Figure 11.
Maps showing heat regulation supply, demand, and correlation analysis. (When p < 0.05, it is marked with '*'. When p < 0.01, it is marked with '**'. When p < 0.001, and it is marked with '***') in TLB in 2010 and 2020.
-
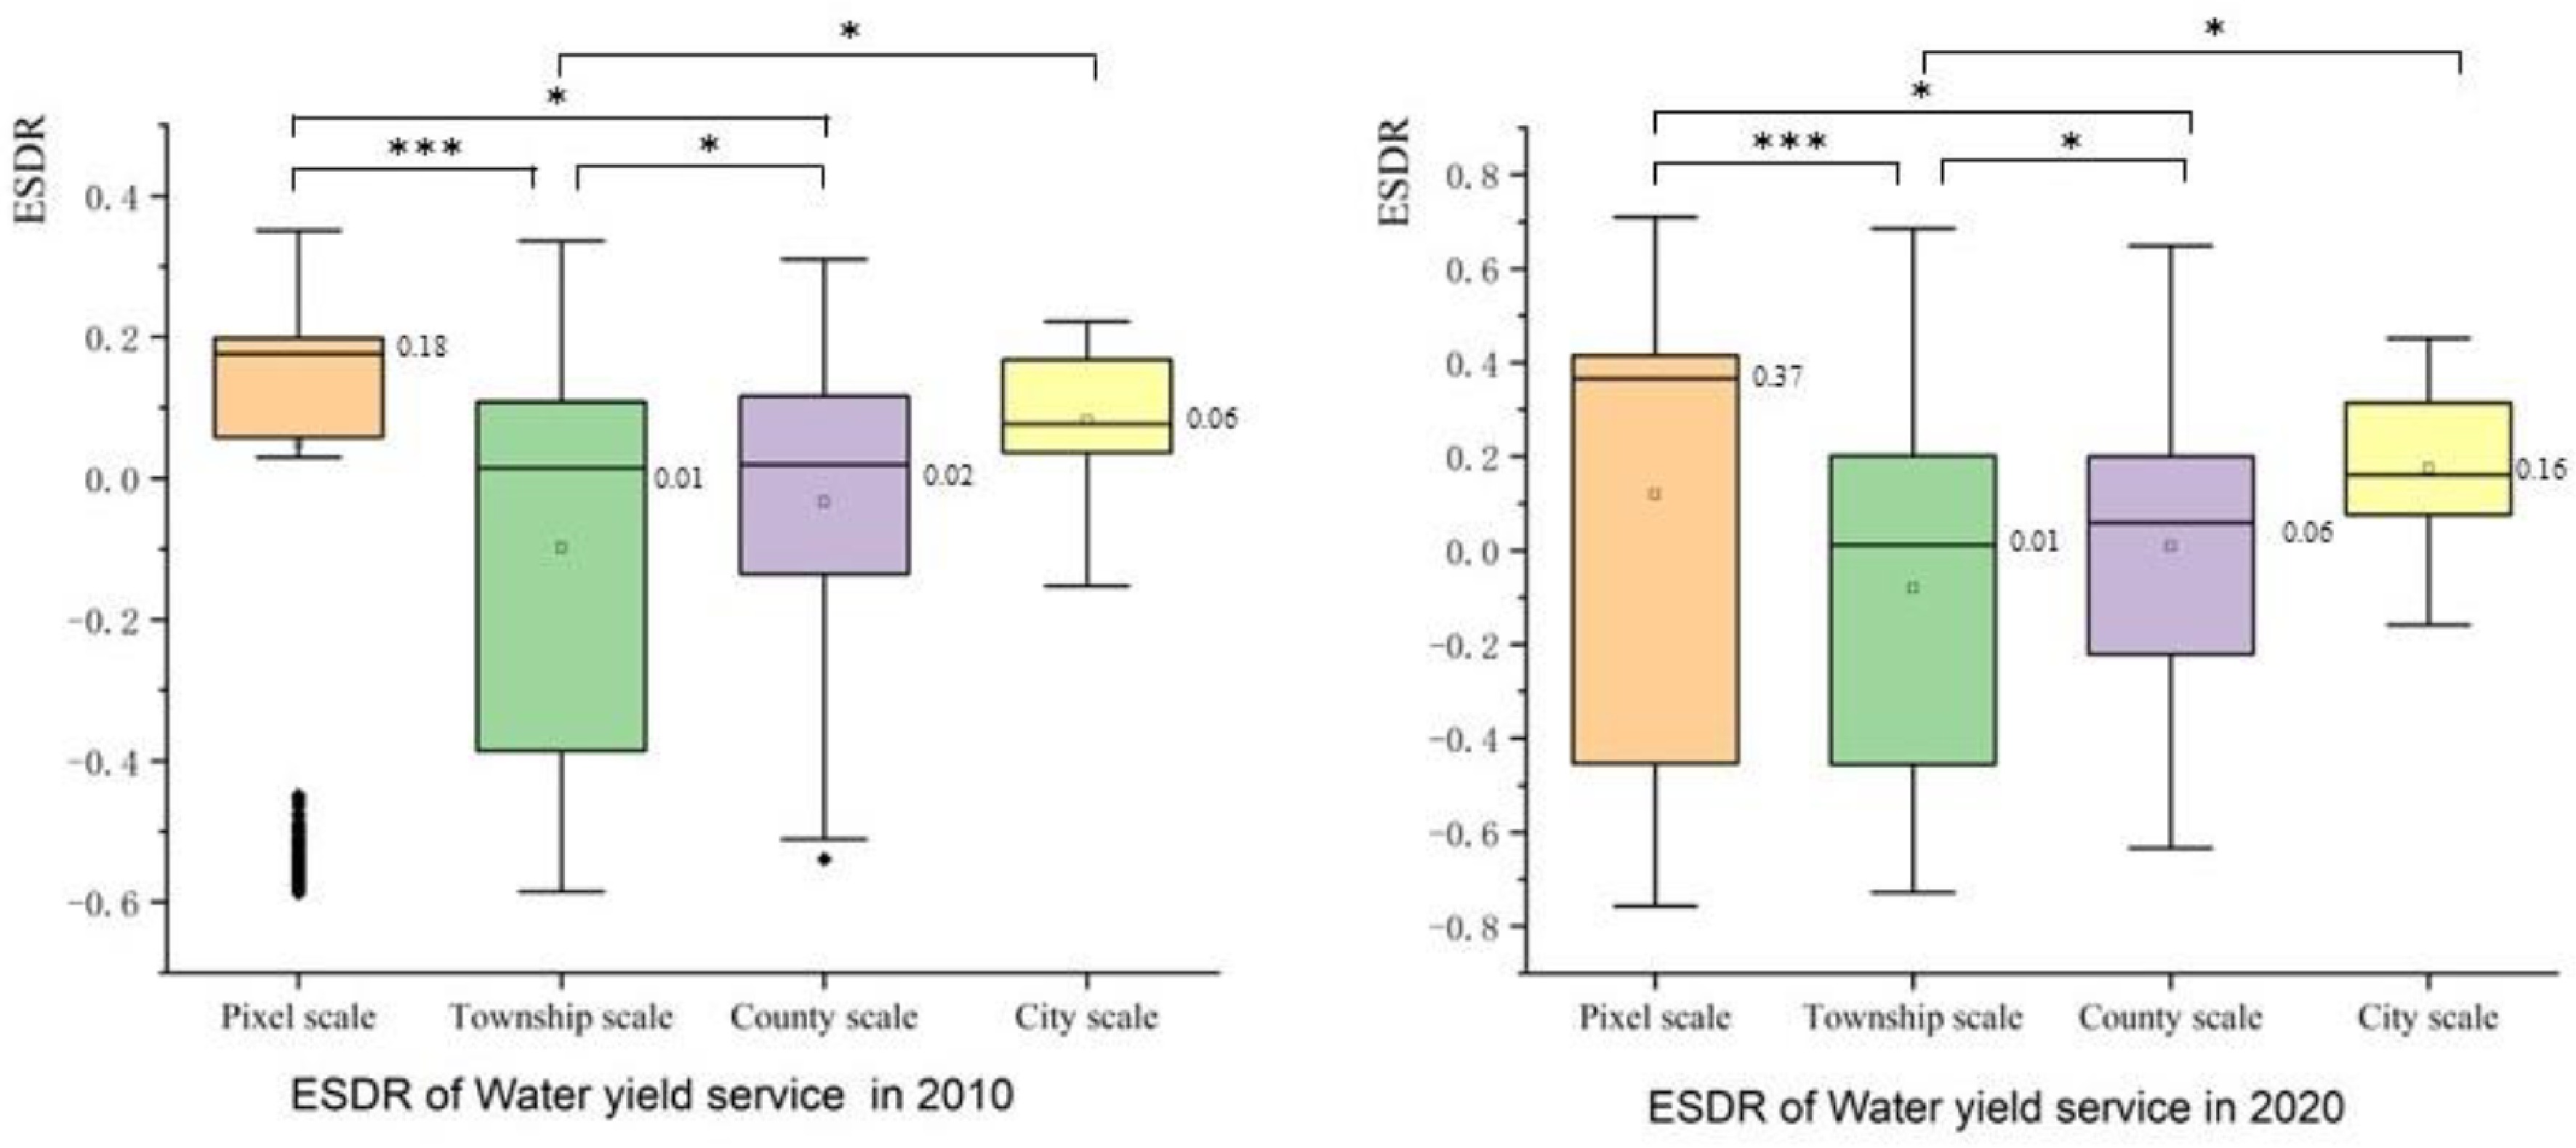
Figure 12.
ESDR of water yield service under different scales and correlation analysis. (When p < 0.05, it is marked with '*'. When p < 0.01, it is marked with '**'. When p < 0.001, and it is marked with '***') in TLB in 2010 and 2020.
-
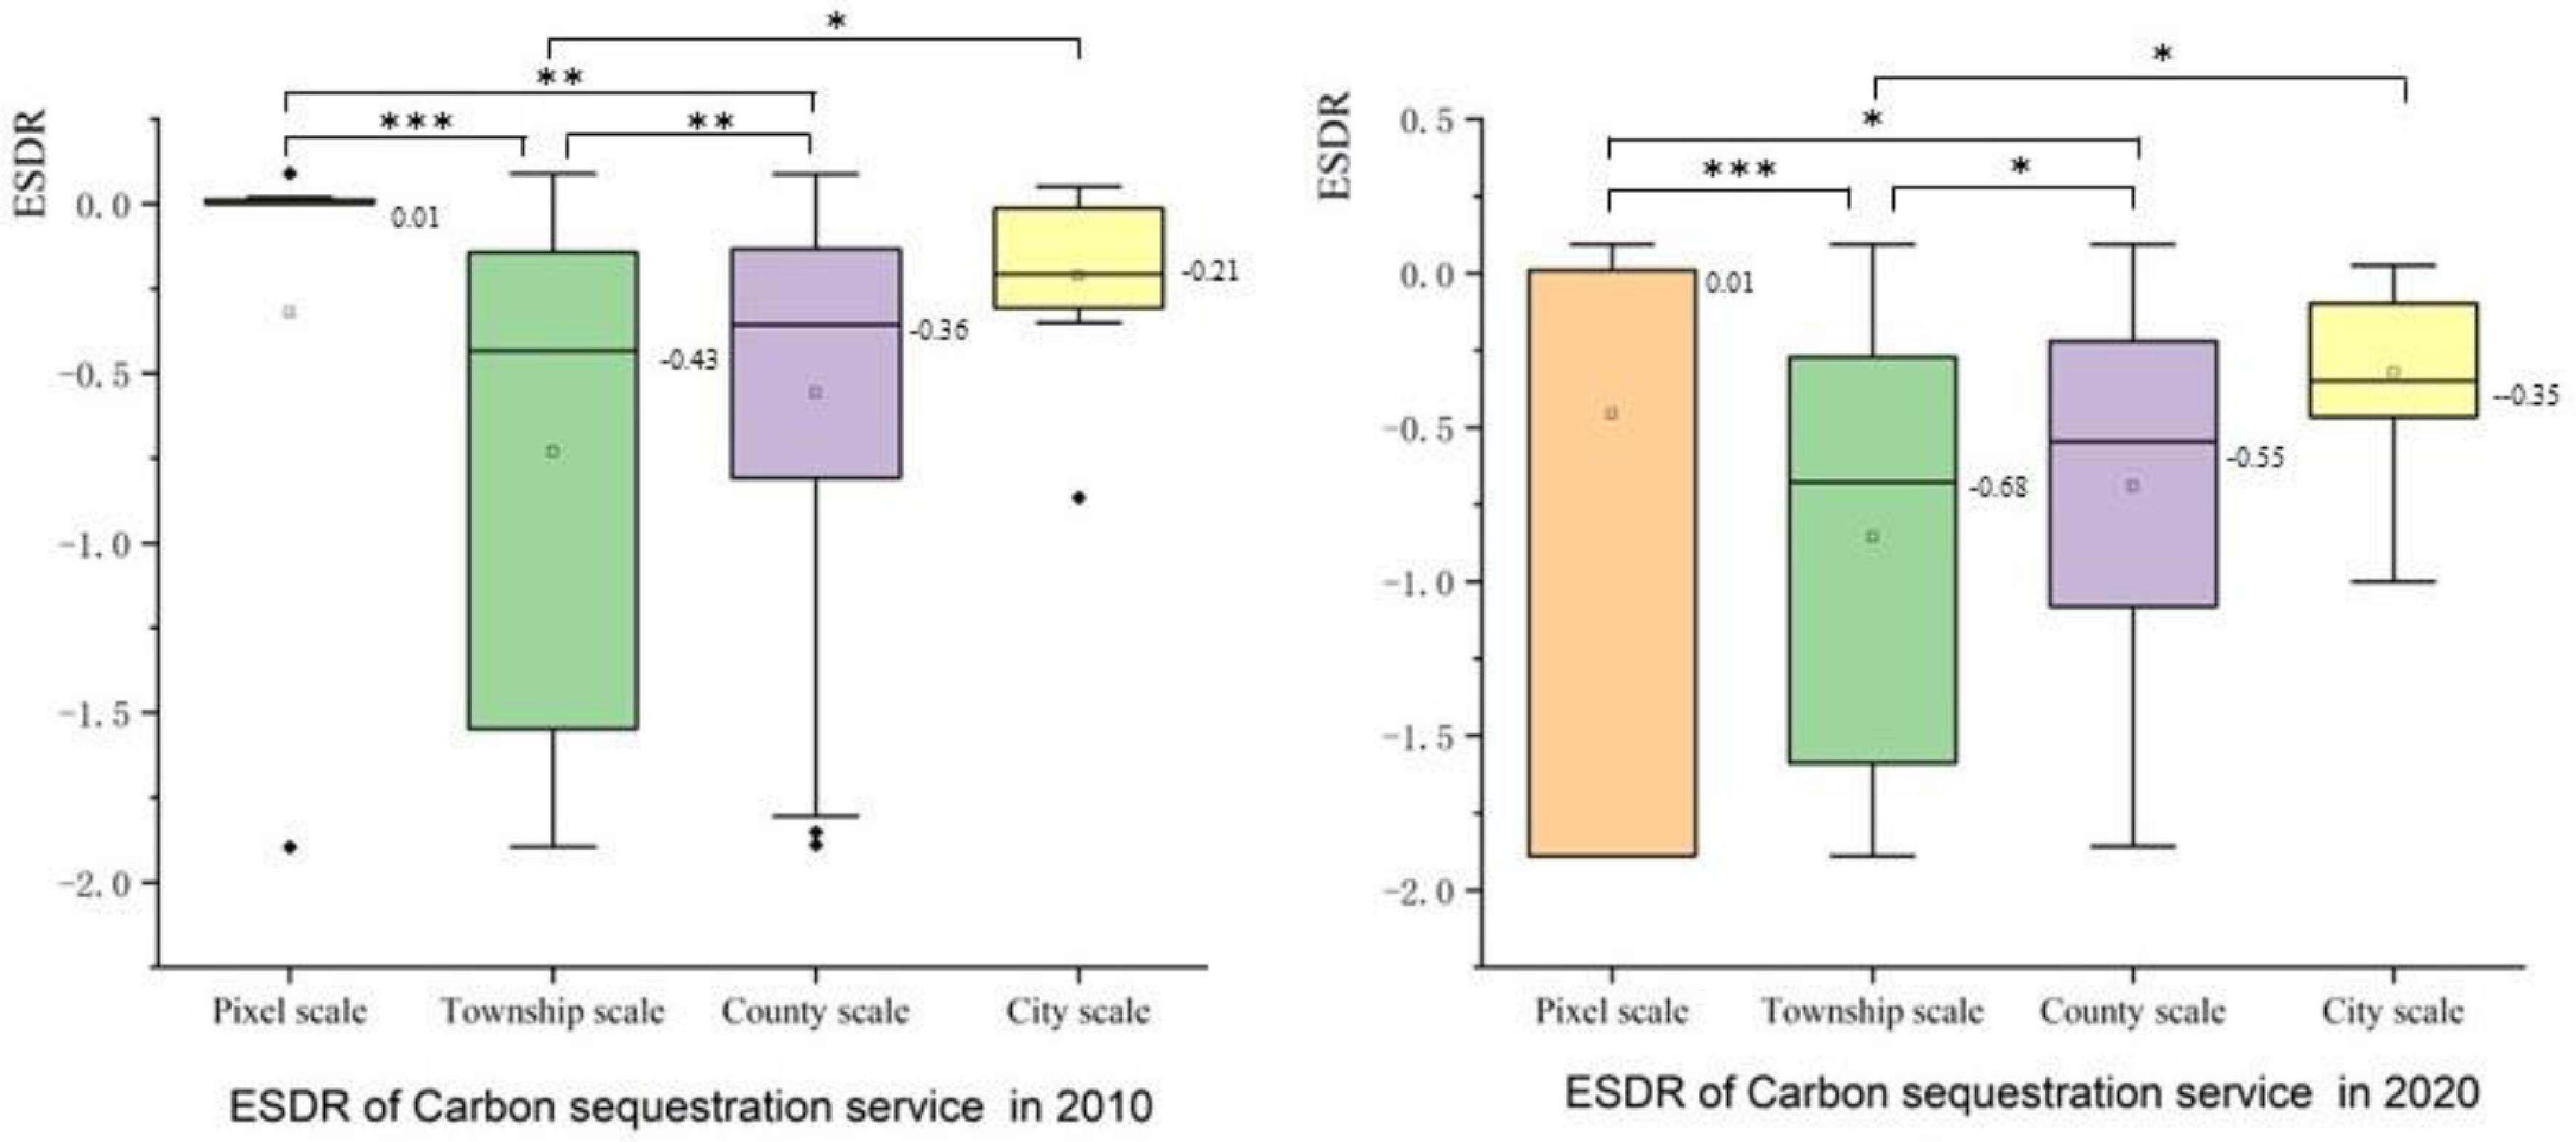
Figure 13.
ESDR of carbon sequestration service under different scales and correlation analysis. (When p < 0.05, it is marked with '*'. When p < 0.01, it is marked with '**'. When p < 0.001, it is marked with '***') in TLB in 2010 and 2020.
-
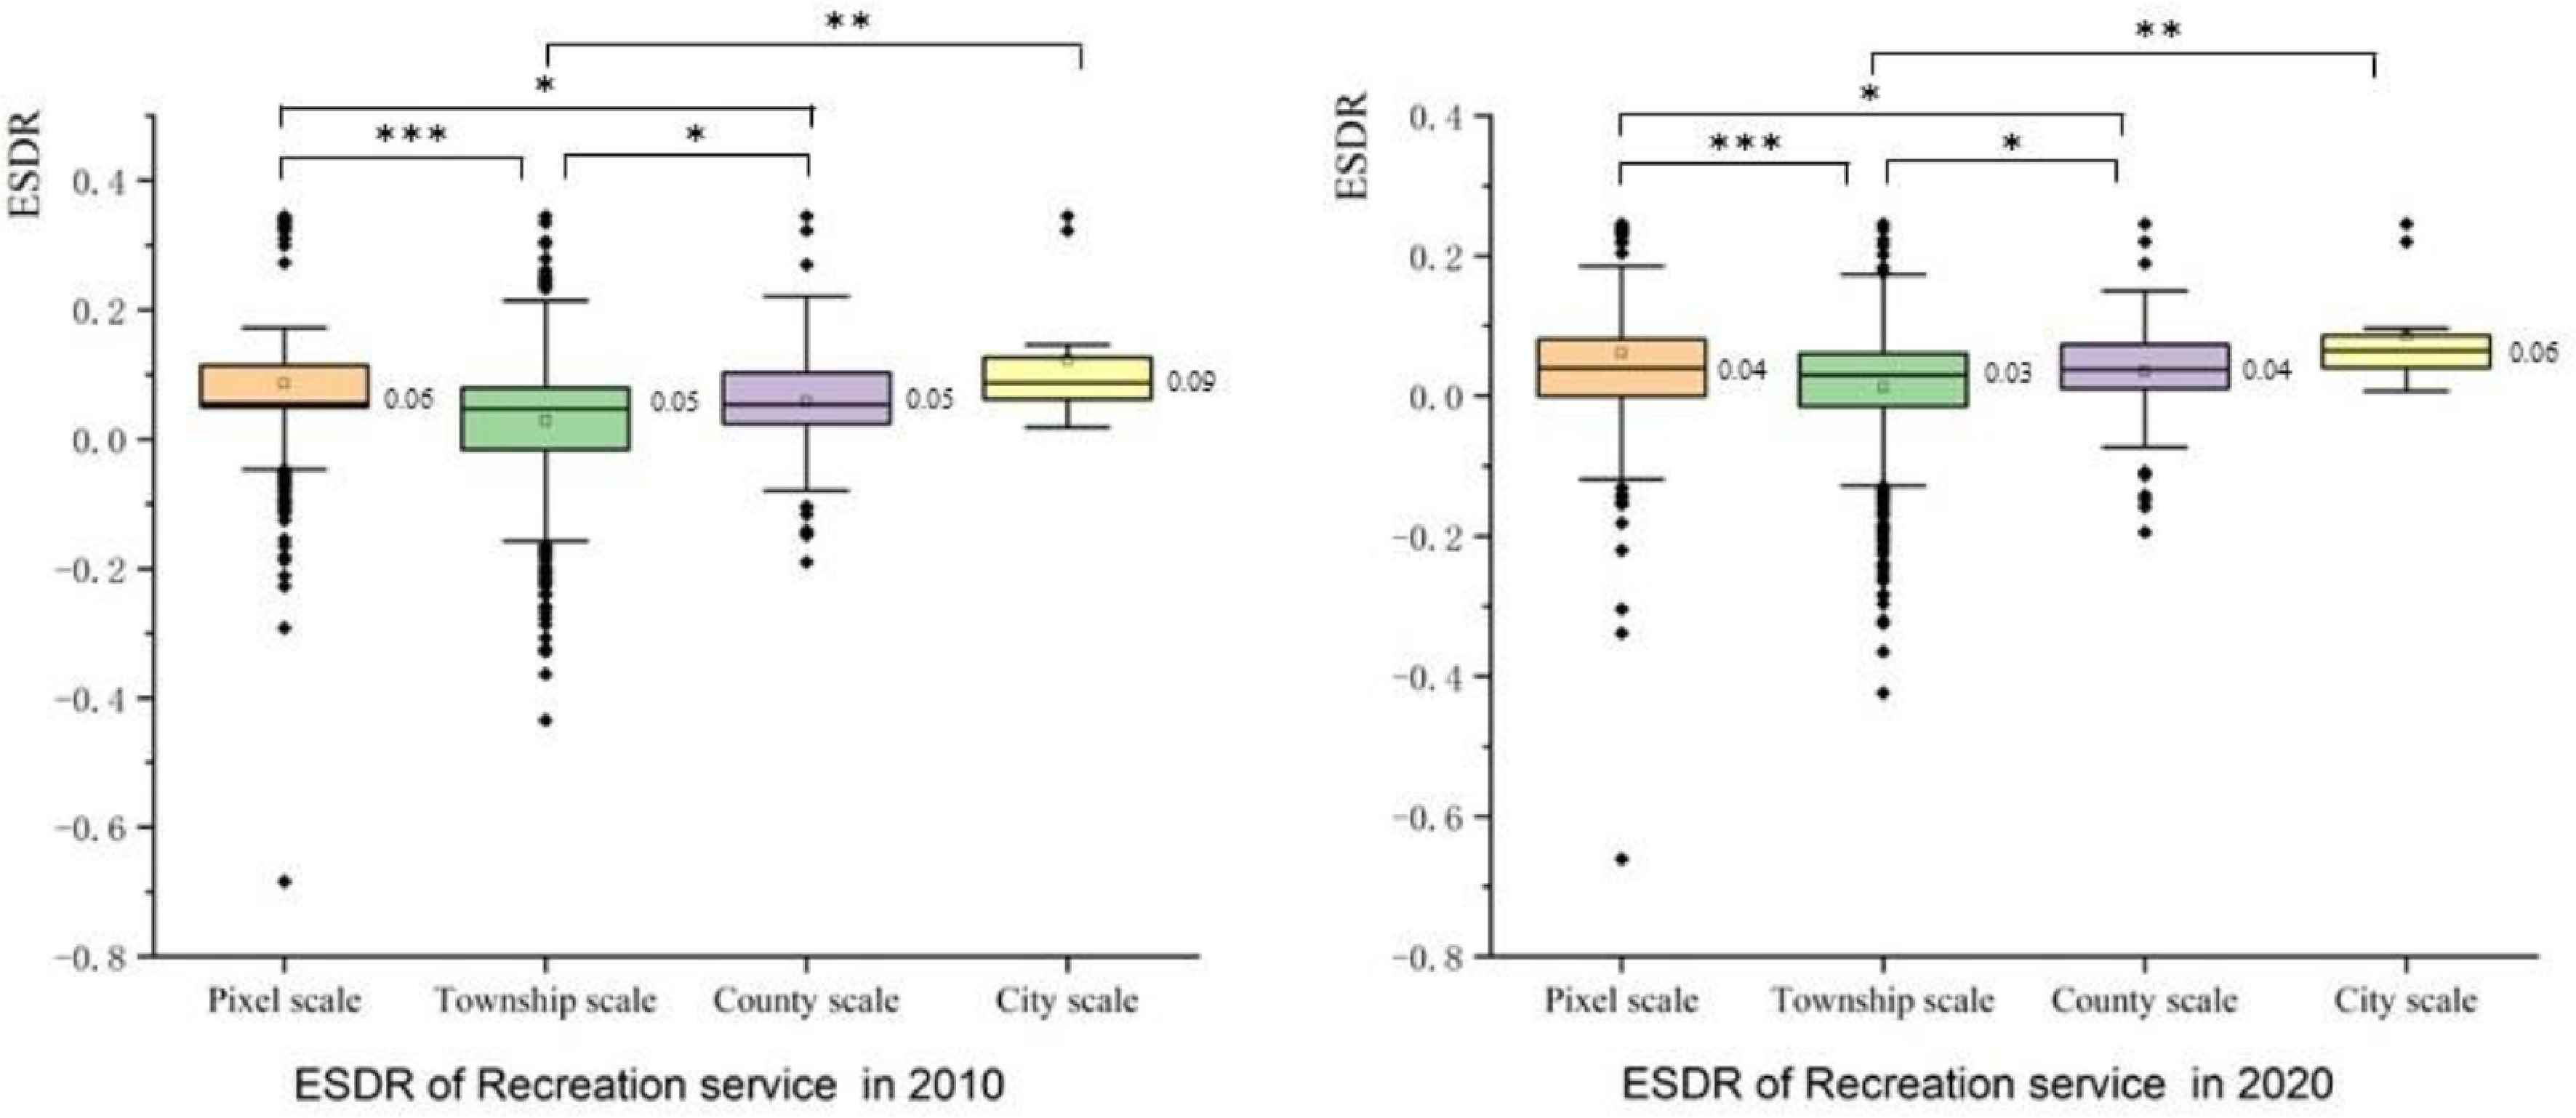
Figure 14.
ESDR of recreation service under different scales and correlation analysis. (When p < 0.05, it is marked with '*'. When p < 0.01, it is marked with '**'. When p < 0.001, and it is marked with '***') in TLB in 2010 and 2020.
-
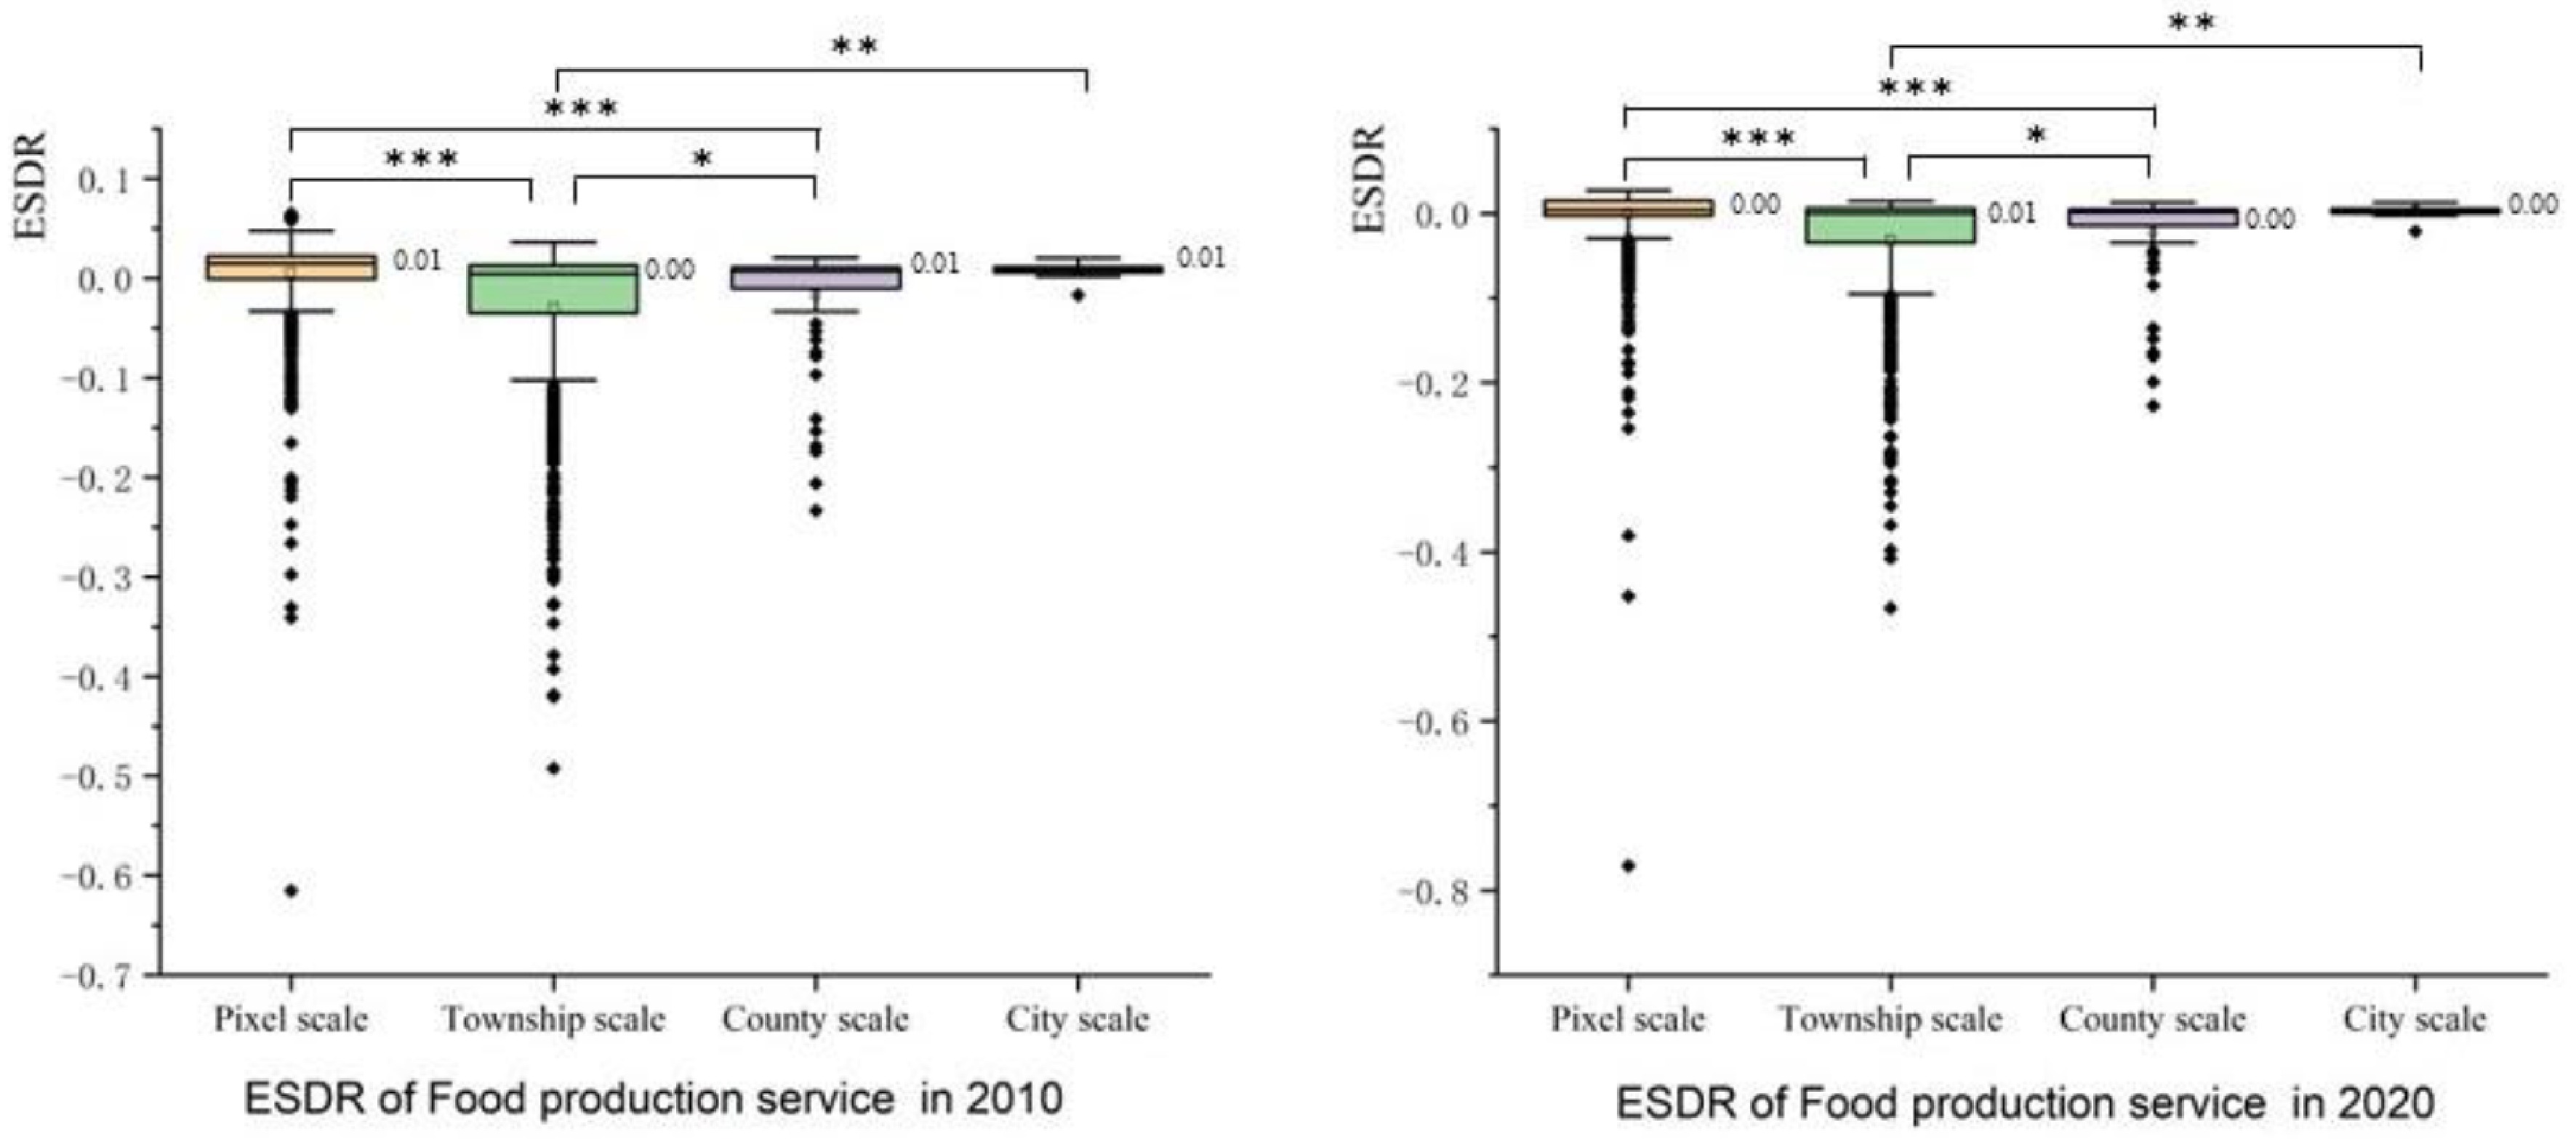
Figure 15.
ESDR of food production service under different scales and correlation analysis. (When p < 0.05, it is marked with '*'. When p < 0.01, it is marked with '**'. When p < 0.001, and it is marked with '***') in TLB in 2010 and 2020.
-
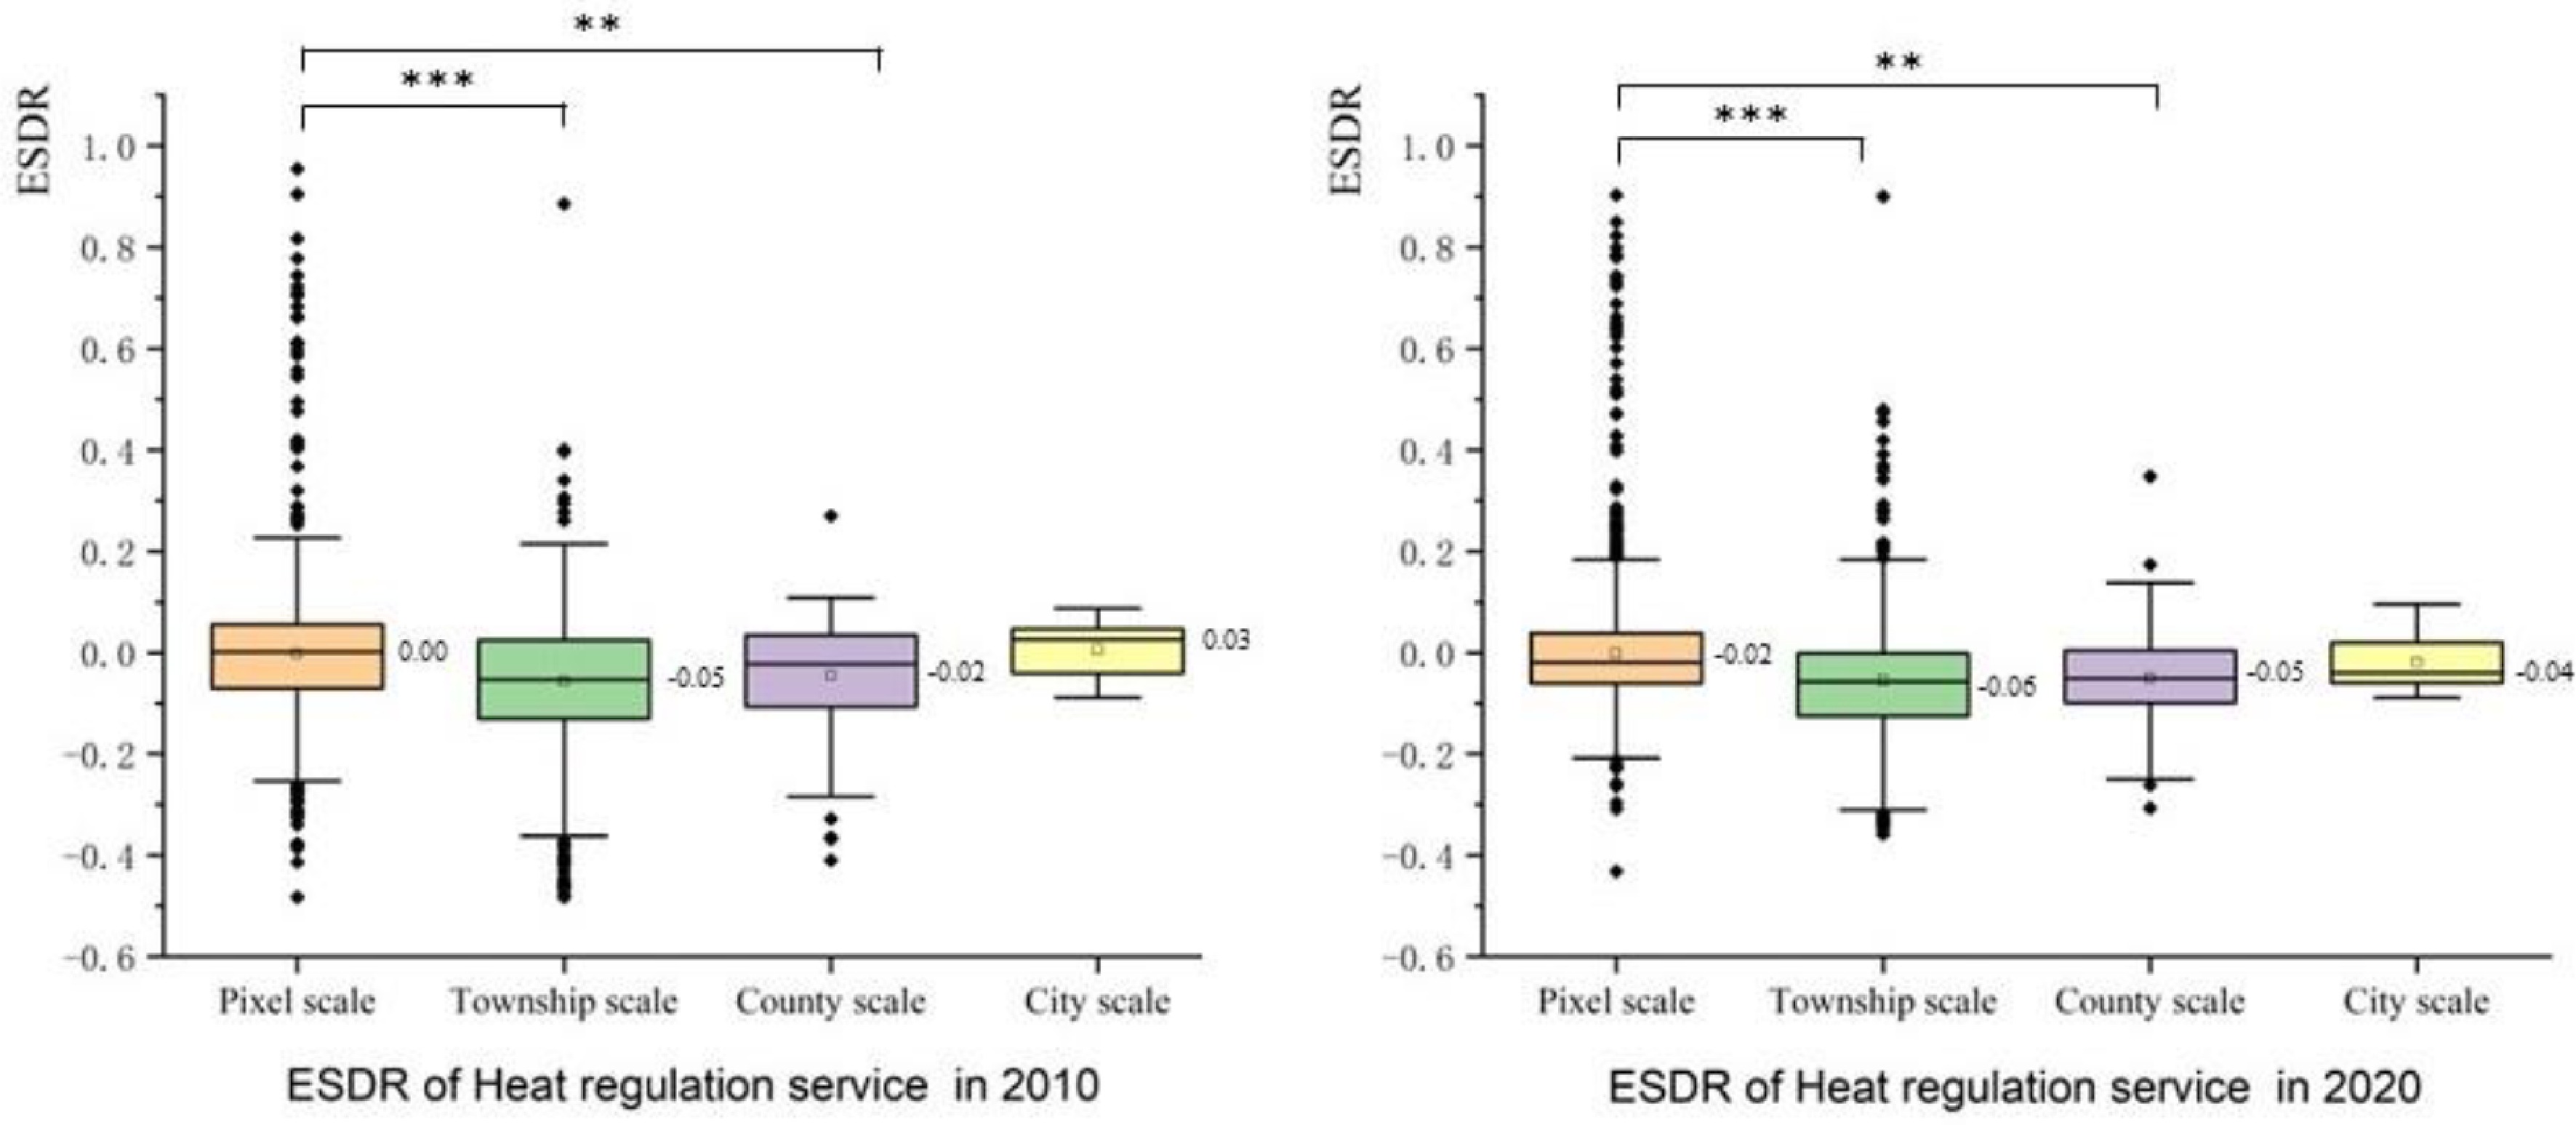
Figure 16.
ESDR of heat regulation service under different scales and correlation analysis. (When p < 0.05, it is marked with '*'. When p < 0.01, it is marked with '**'. When p < 0.001, and it is marked with '***') in TLB in 2010 and 2020.
-
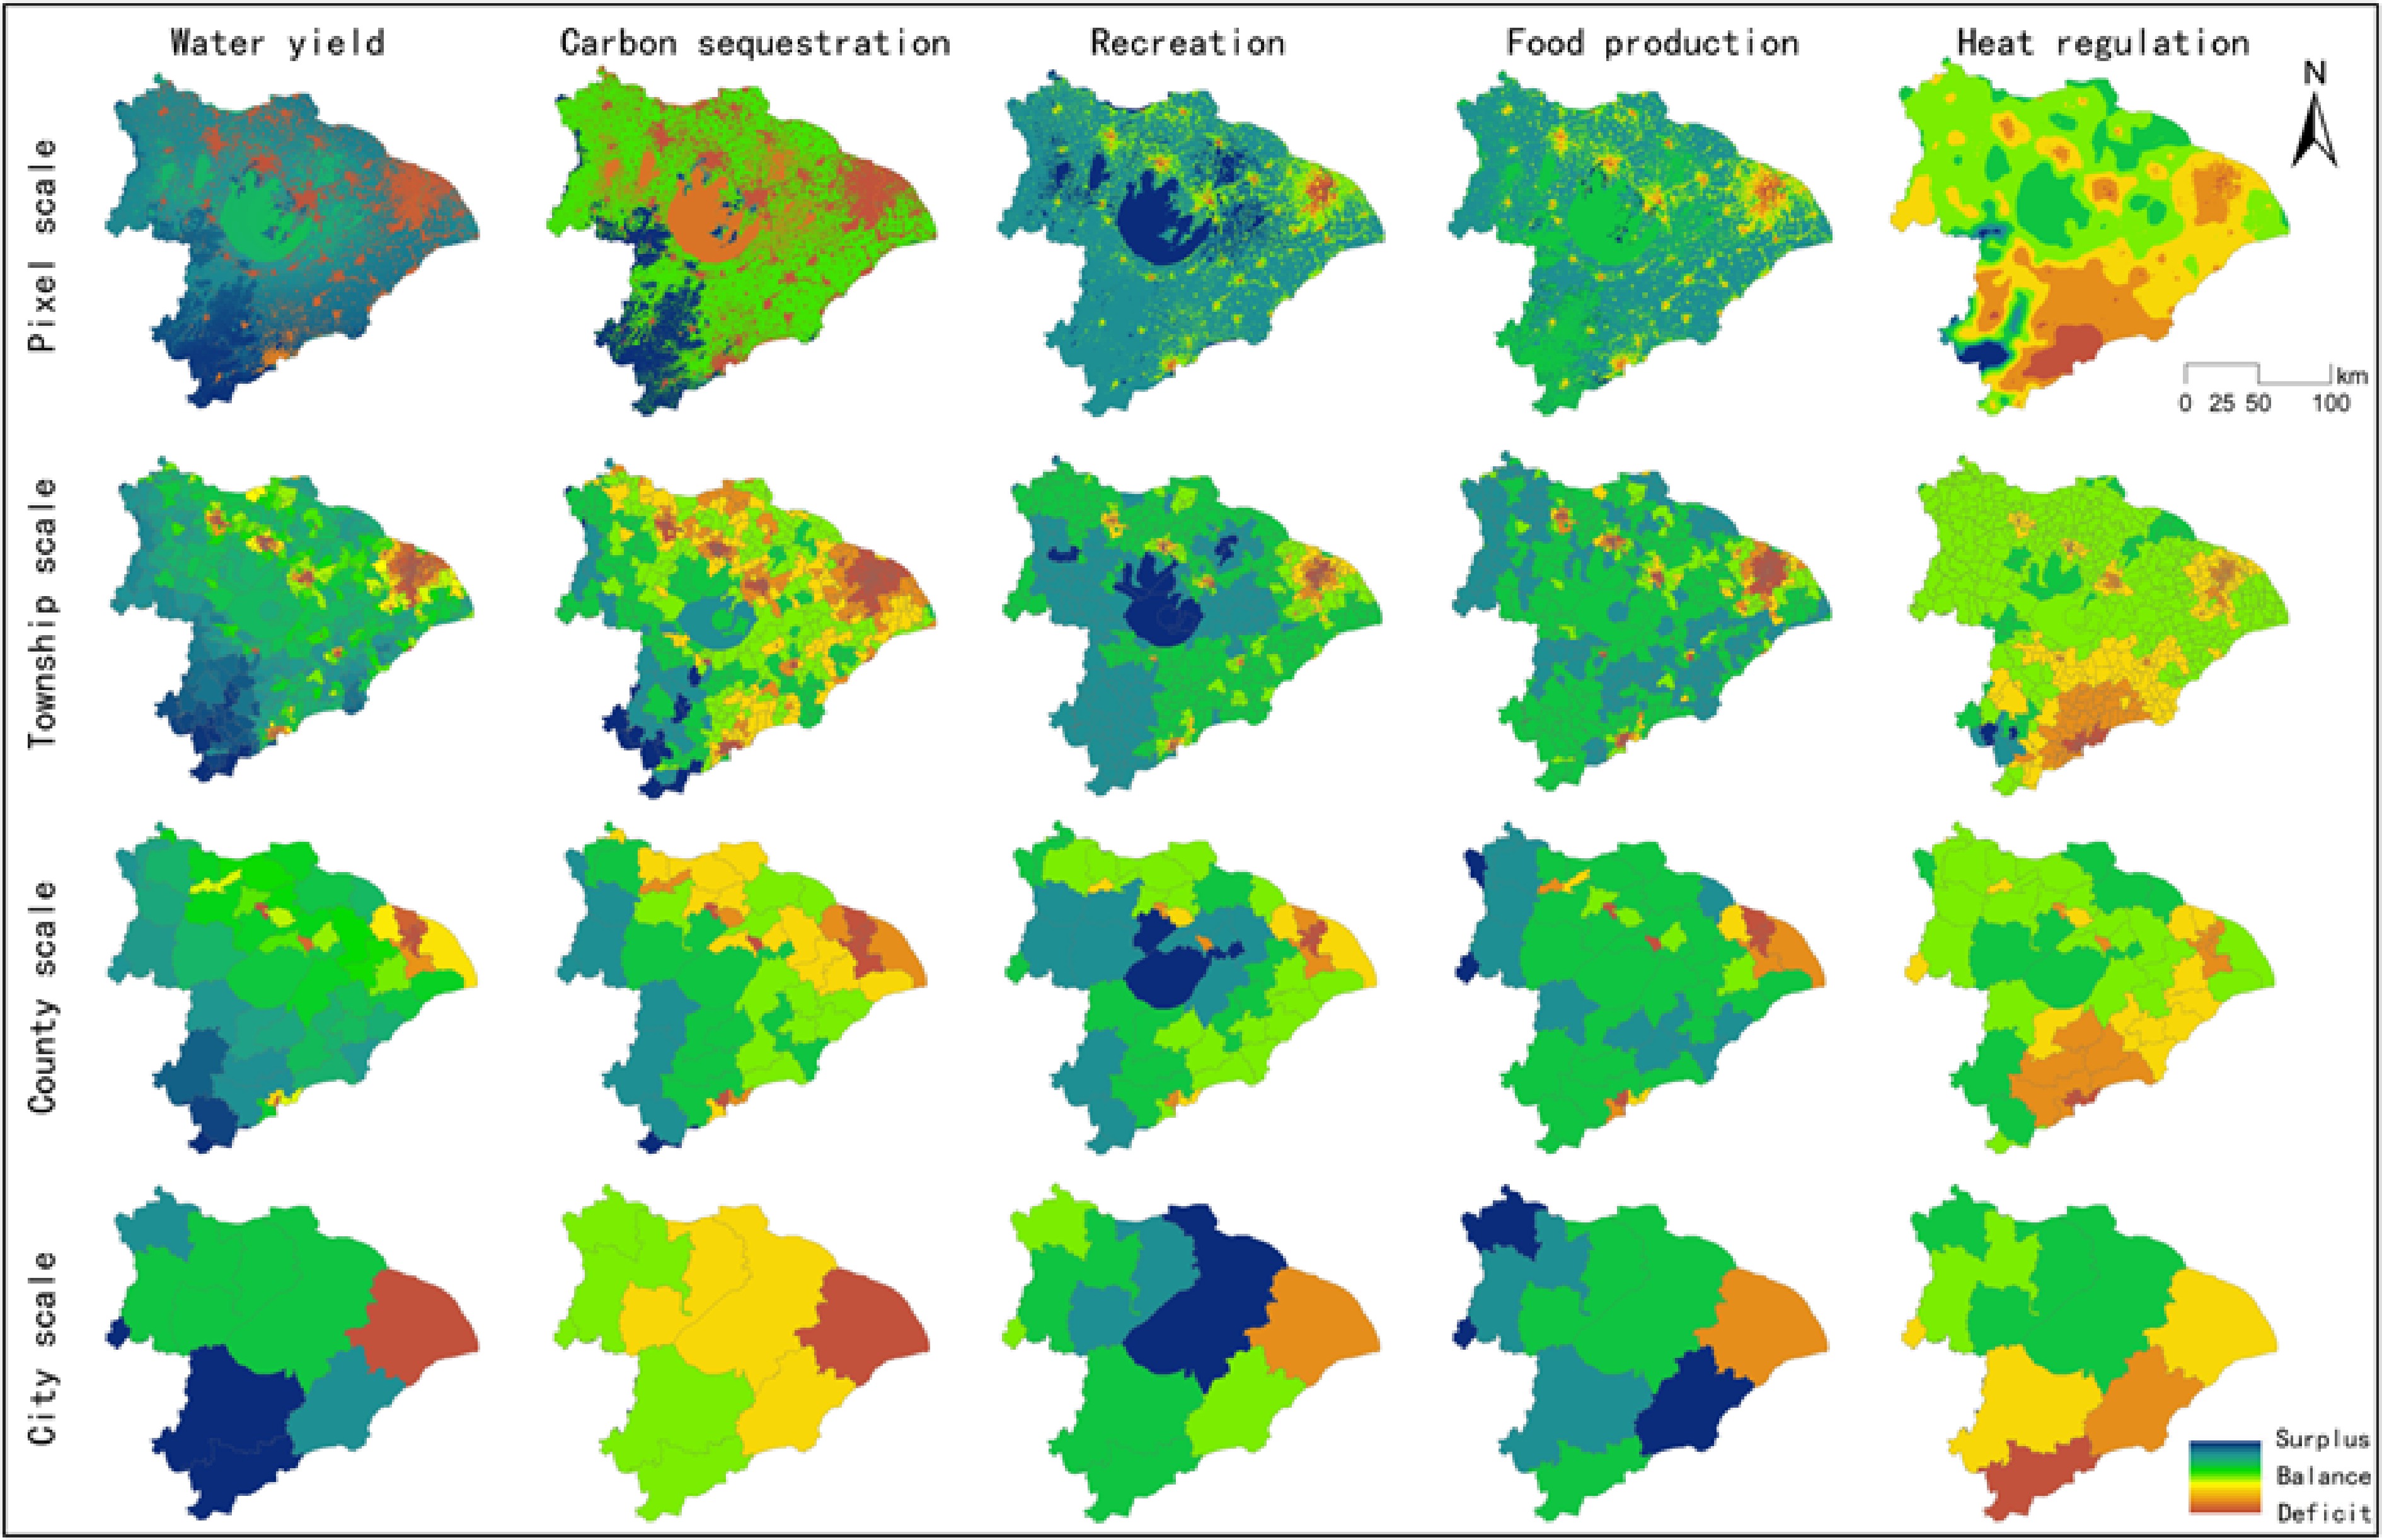
Figure 17.
Spatial distribution of ESDR at different scales in 2010.
-
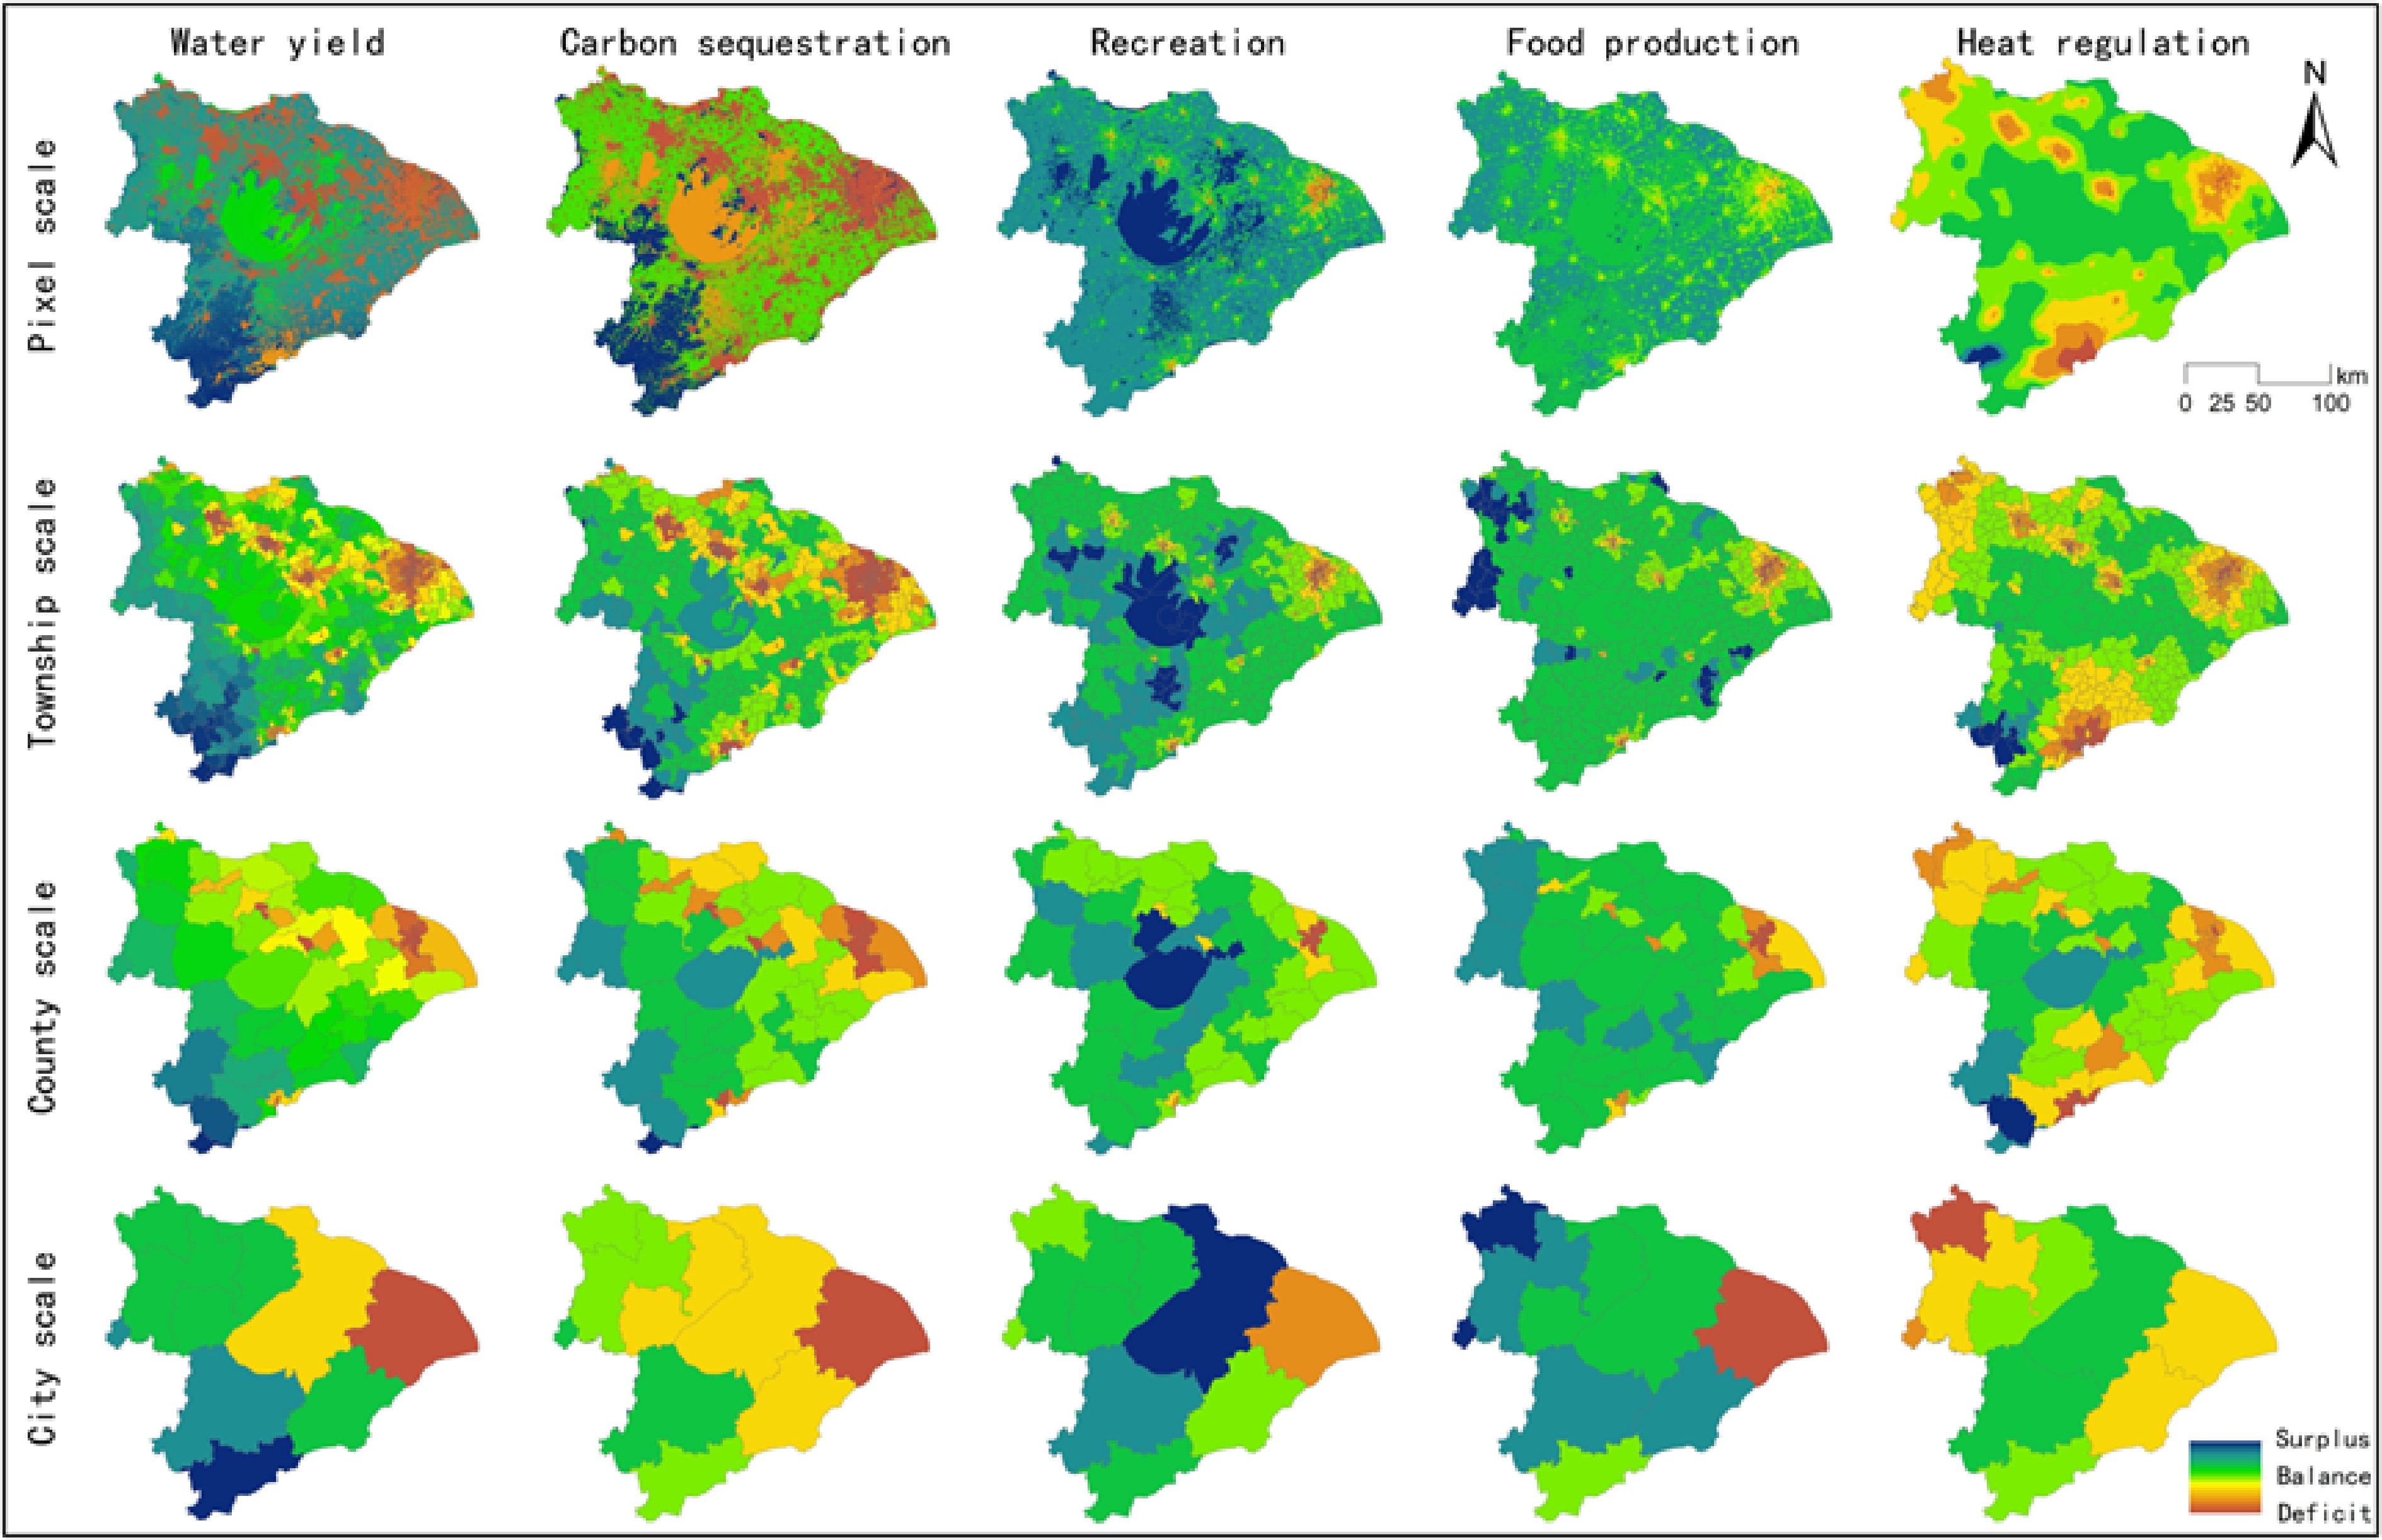
Figure 18.
Spatial distribution of ESDR at different scales in 2020.
-
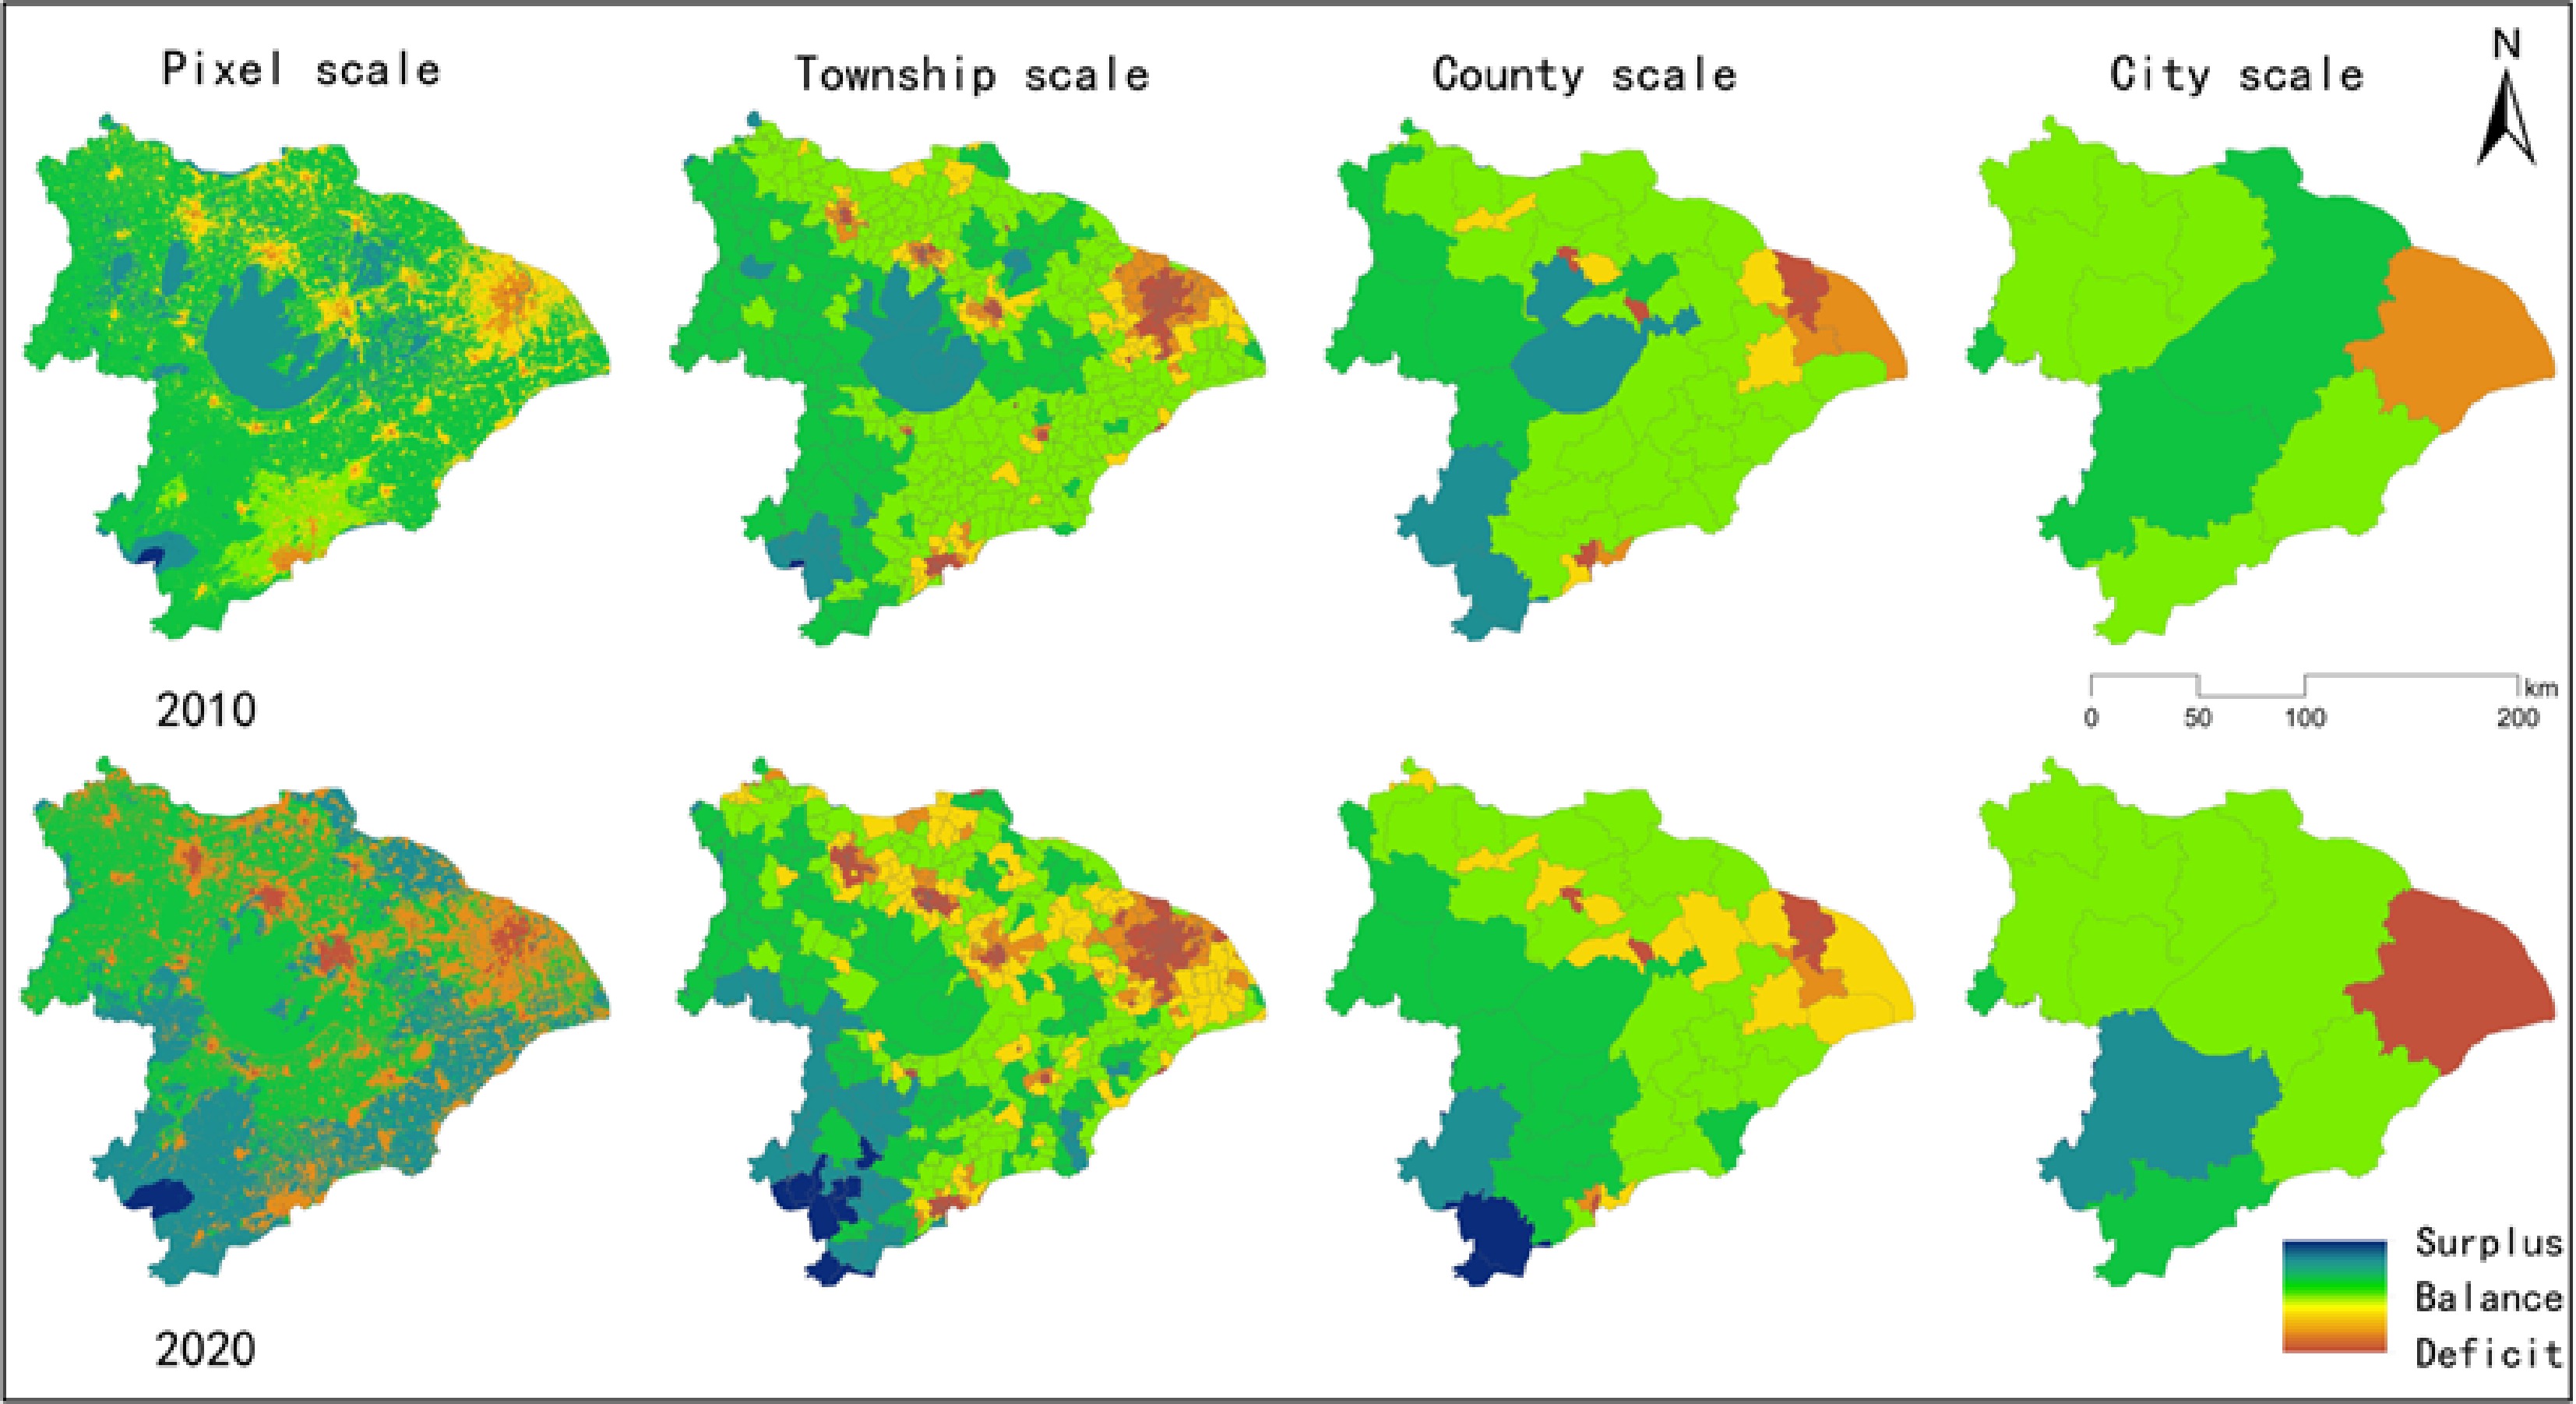
Figure 19.
Spatial distribution of CESDR at different scales.
-
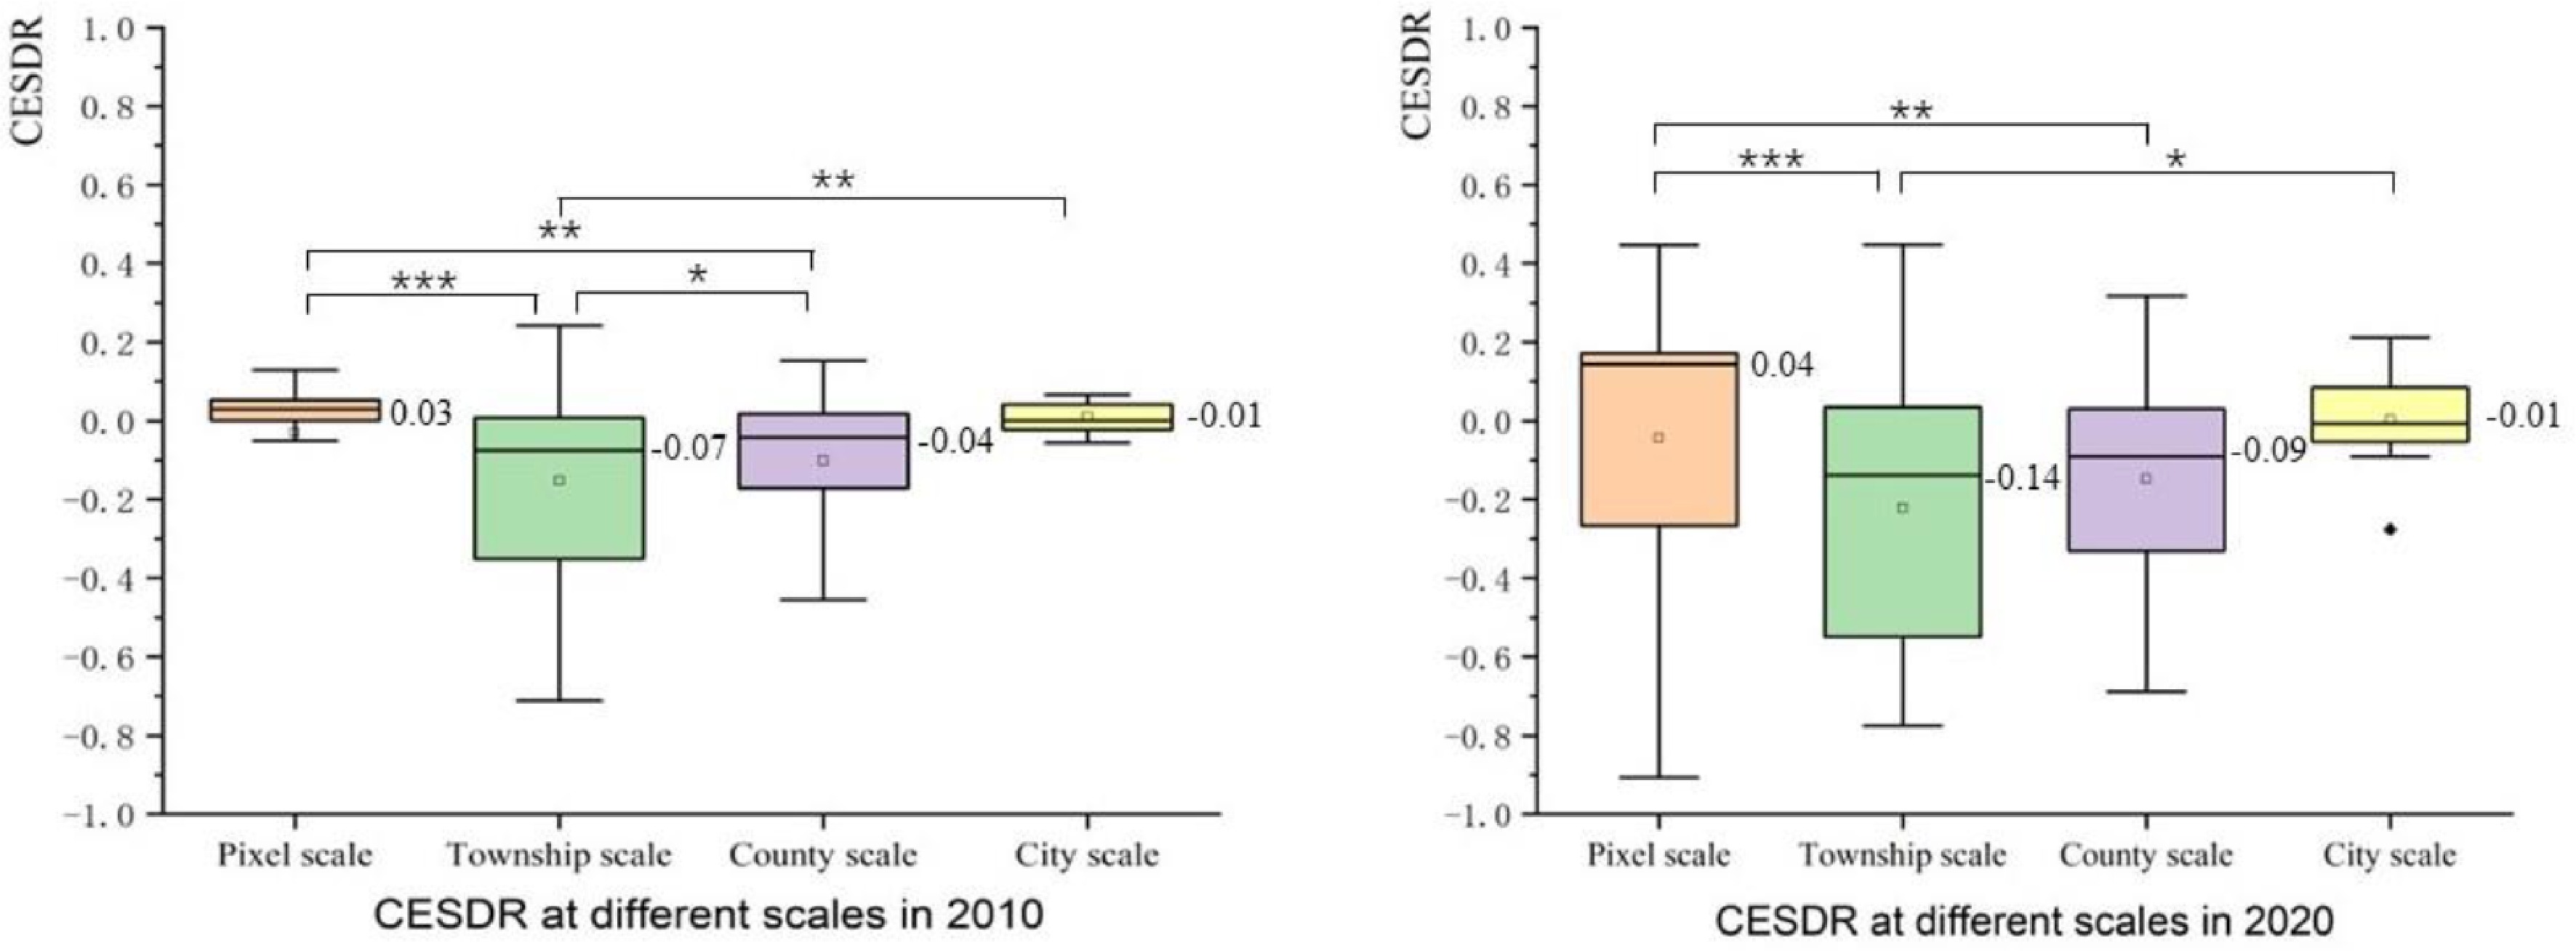
Figure 20.
CESDR under different scales and correlation analysis. (When p < 0.05, it is marked with '*'. When p < 0.01, it is marked with '**'. When p < 0.001, it is marked with '***') in TLB in 2010 and 2020.
-
Data Data description Source Scale Administrative boundaries Administrative boundaries of cities, counties, and townships www.resdc.cn Cities, counties, and townships DEM www.gscloud.cn 30 m resolution Climate data Temperature, Average maximum temperature, precipitation www.worldclim.org 30 m resolution Soil data https://data.tpdc.ac.cn 1,000 m resolution Land-use data www.geodata.cn 30 m resolution Population Distributed, age www.worldpop.org 100 m resolution Statistical data water requirement,
Carbon emissions,
Per capita green area,
Food production and consumptionProvincial, urban, and county statistical yearbooks, and the Water Resources Bulletin of the TLB 30 m resolution Table 1.
The data source.
-
(I) scales (J) scales p-value in 2010 95% confidence interval in 2010 p-value in 2020 95% confidence interval in 2020 Lower bound Upper bound lower bound Upper bound Pixel Township 0 0.1065 0.1378 0 0.1496 0.2059 County 0.002 0.0262 0.1152 0.01 0.0244 0.1843 City 0.47 −0.1479 0.0682 0.644 −0.2399 0.1484 Township Pixel 0 −0.1378 −0.1065 0 −0.2059 −0.1496 County 0.027 −0.0971 −0.0058 0.08 −0.1554 0.0087 City 0.003 −0.2705 −0.0534 0.025 −0.4185 −0.0285 County Pixel 0.002 −0.1152 −0.0262 0.01 −0.1843 −0.0244 Township 0.027 0.0058 0.0971 0.08 −0.0087 0.1554 City 0.062 −0.2268 0.0057 0.159 −0.3590 0.0587 City Pixel 0.47 −0.0682 0.1479 0.644 −0.1484 0.2399 Table 2.
Results of CESDR variance test in 2010 and 2020.
Figures
(20)
Tables
(2)