-
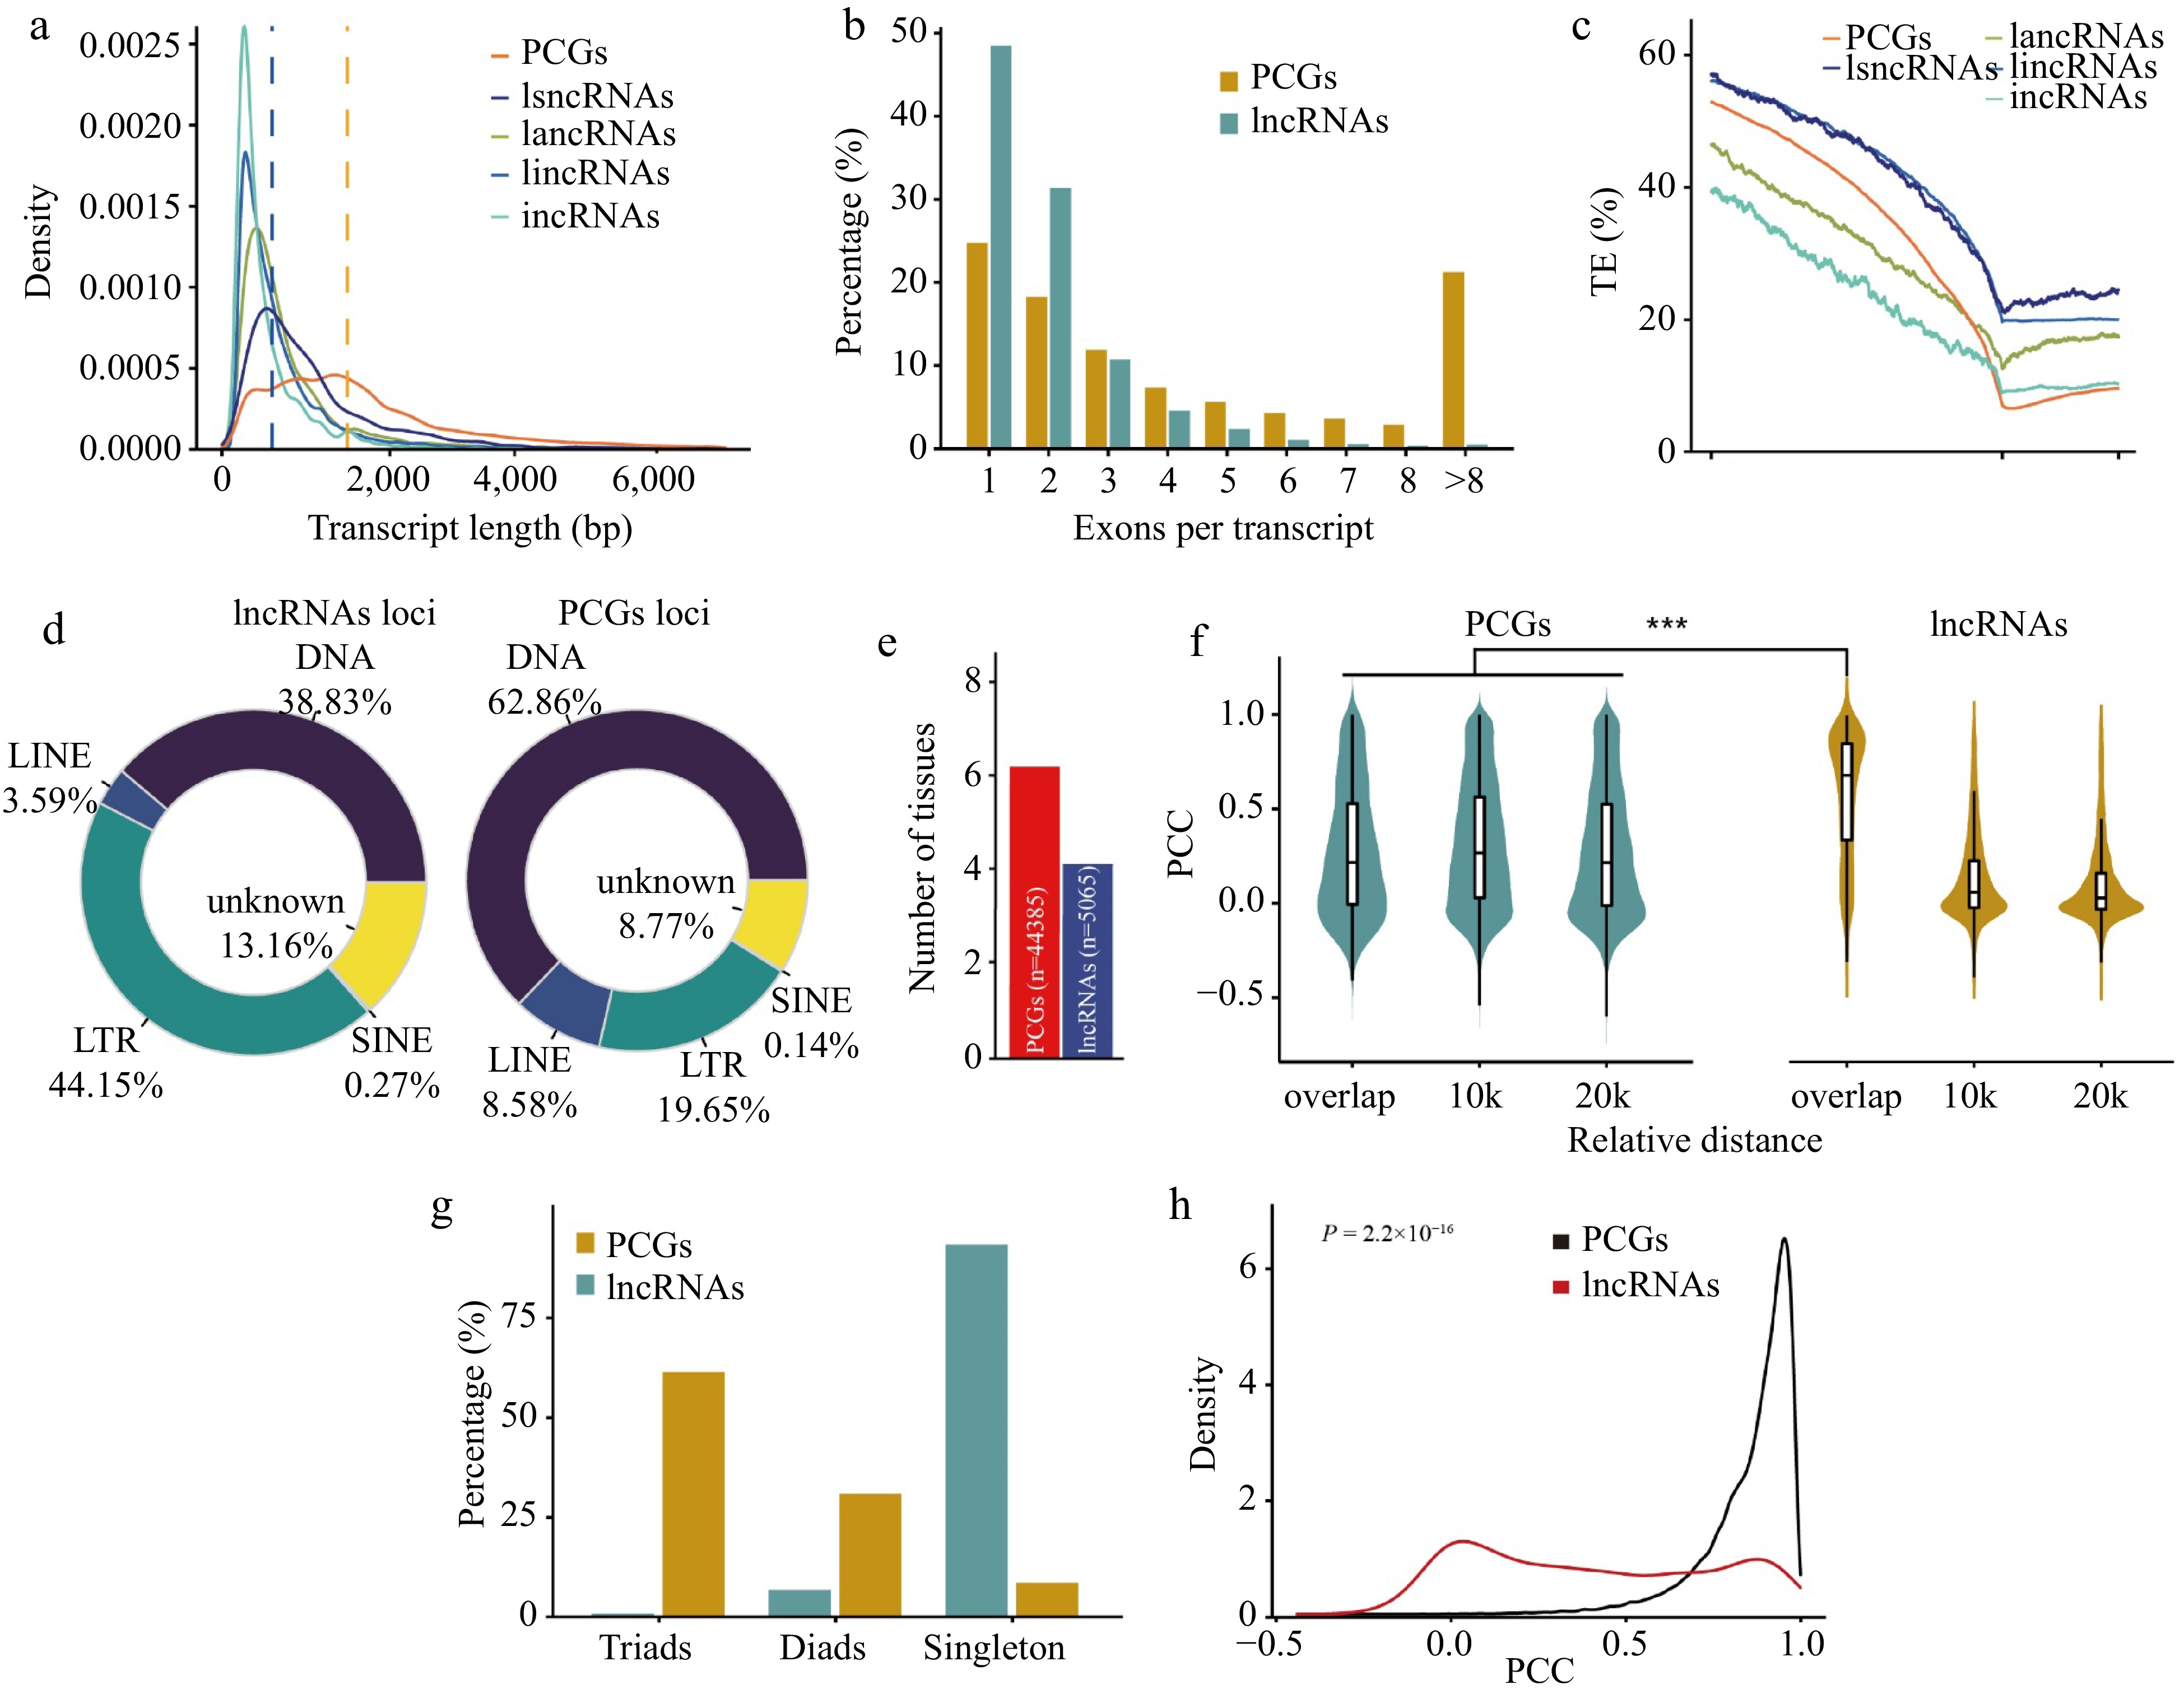
Figure 1.
Comparison of protein-coding genes and lncRNAs in wheat. (a) Distribution of transcript length of PCGs and lncRNAs. Each line represents a type of transcript, including transcripts from protein-coding genes (PCGs), long sense non-coding RNAs (lsncRNAs), long antisense non-coding RNAs (lancRNAs), long intergenic non-coding RNAs (lincRNAs), and intronic non-coding RNAs (incRNAs). The y-axis shows kernel density distribution values. (b) Number of exons in transcripts of PCGs and lncRNAs. (c) Transposable element (TE) density in PCGs, lsncRNAs, lancRNAs, lincRNAs, and incRNAs calculated using a sliding window approach over 100-bp intervals across the 5-kb promoter region and gene body. TSS: transcription start site; TTS: transcription termination site. The density of transposable elements from 5-kb upstream of the transcription termination site of each lncRNA and PCG was calculated in sliding windows of 100 bp. (d) Pie charts showing the distribution patterns of different classes of transposable elements overlapping with PCGs and lncRNAs. The classes of transposable elements include long interspersed nuclear elements (LINEs), short interspersed nuclear elements (SINEs), long terminal repeats (LTRs), and DNA transposons (DNA). (e) Number of tissues in which 50% of lncRNAs or PCGs are highly expressed. For lncRNAs and PCGs, the median expression level for each tissue was calculated and genes were binned as having high (above the median) or low expression levels in each tissue. Genes were ranked based on the number of tissues in which they were highly expressed, and the median was plotted for PCGs (blue) and lncRNA genes (red). (f) Violin chart showing the correlation of expression patterns between neighboring (overlap, 10 kb, 20 kb) gene pairs and lncRNA-PCGs gene pair. (g) Number of homoeologous alleles including singletons, dyads, and triads in PCGs and lncRNAs. The homoeologous lncRNA pairs between the A, B, and D subgenomes were identified using MCscan with default parameters. (h) Distribution of Pearson correlation coefficients (PCC) calculated for homoeologous lncRNAs (red) and PCGs (black) using gene expression values.
-
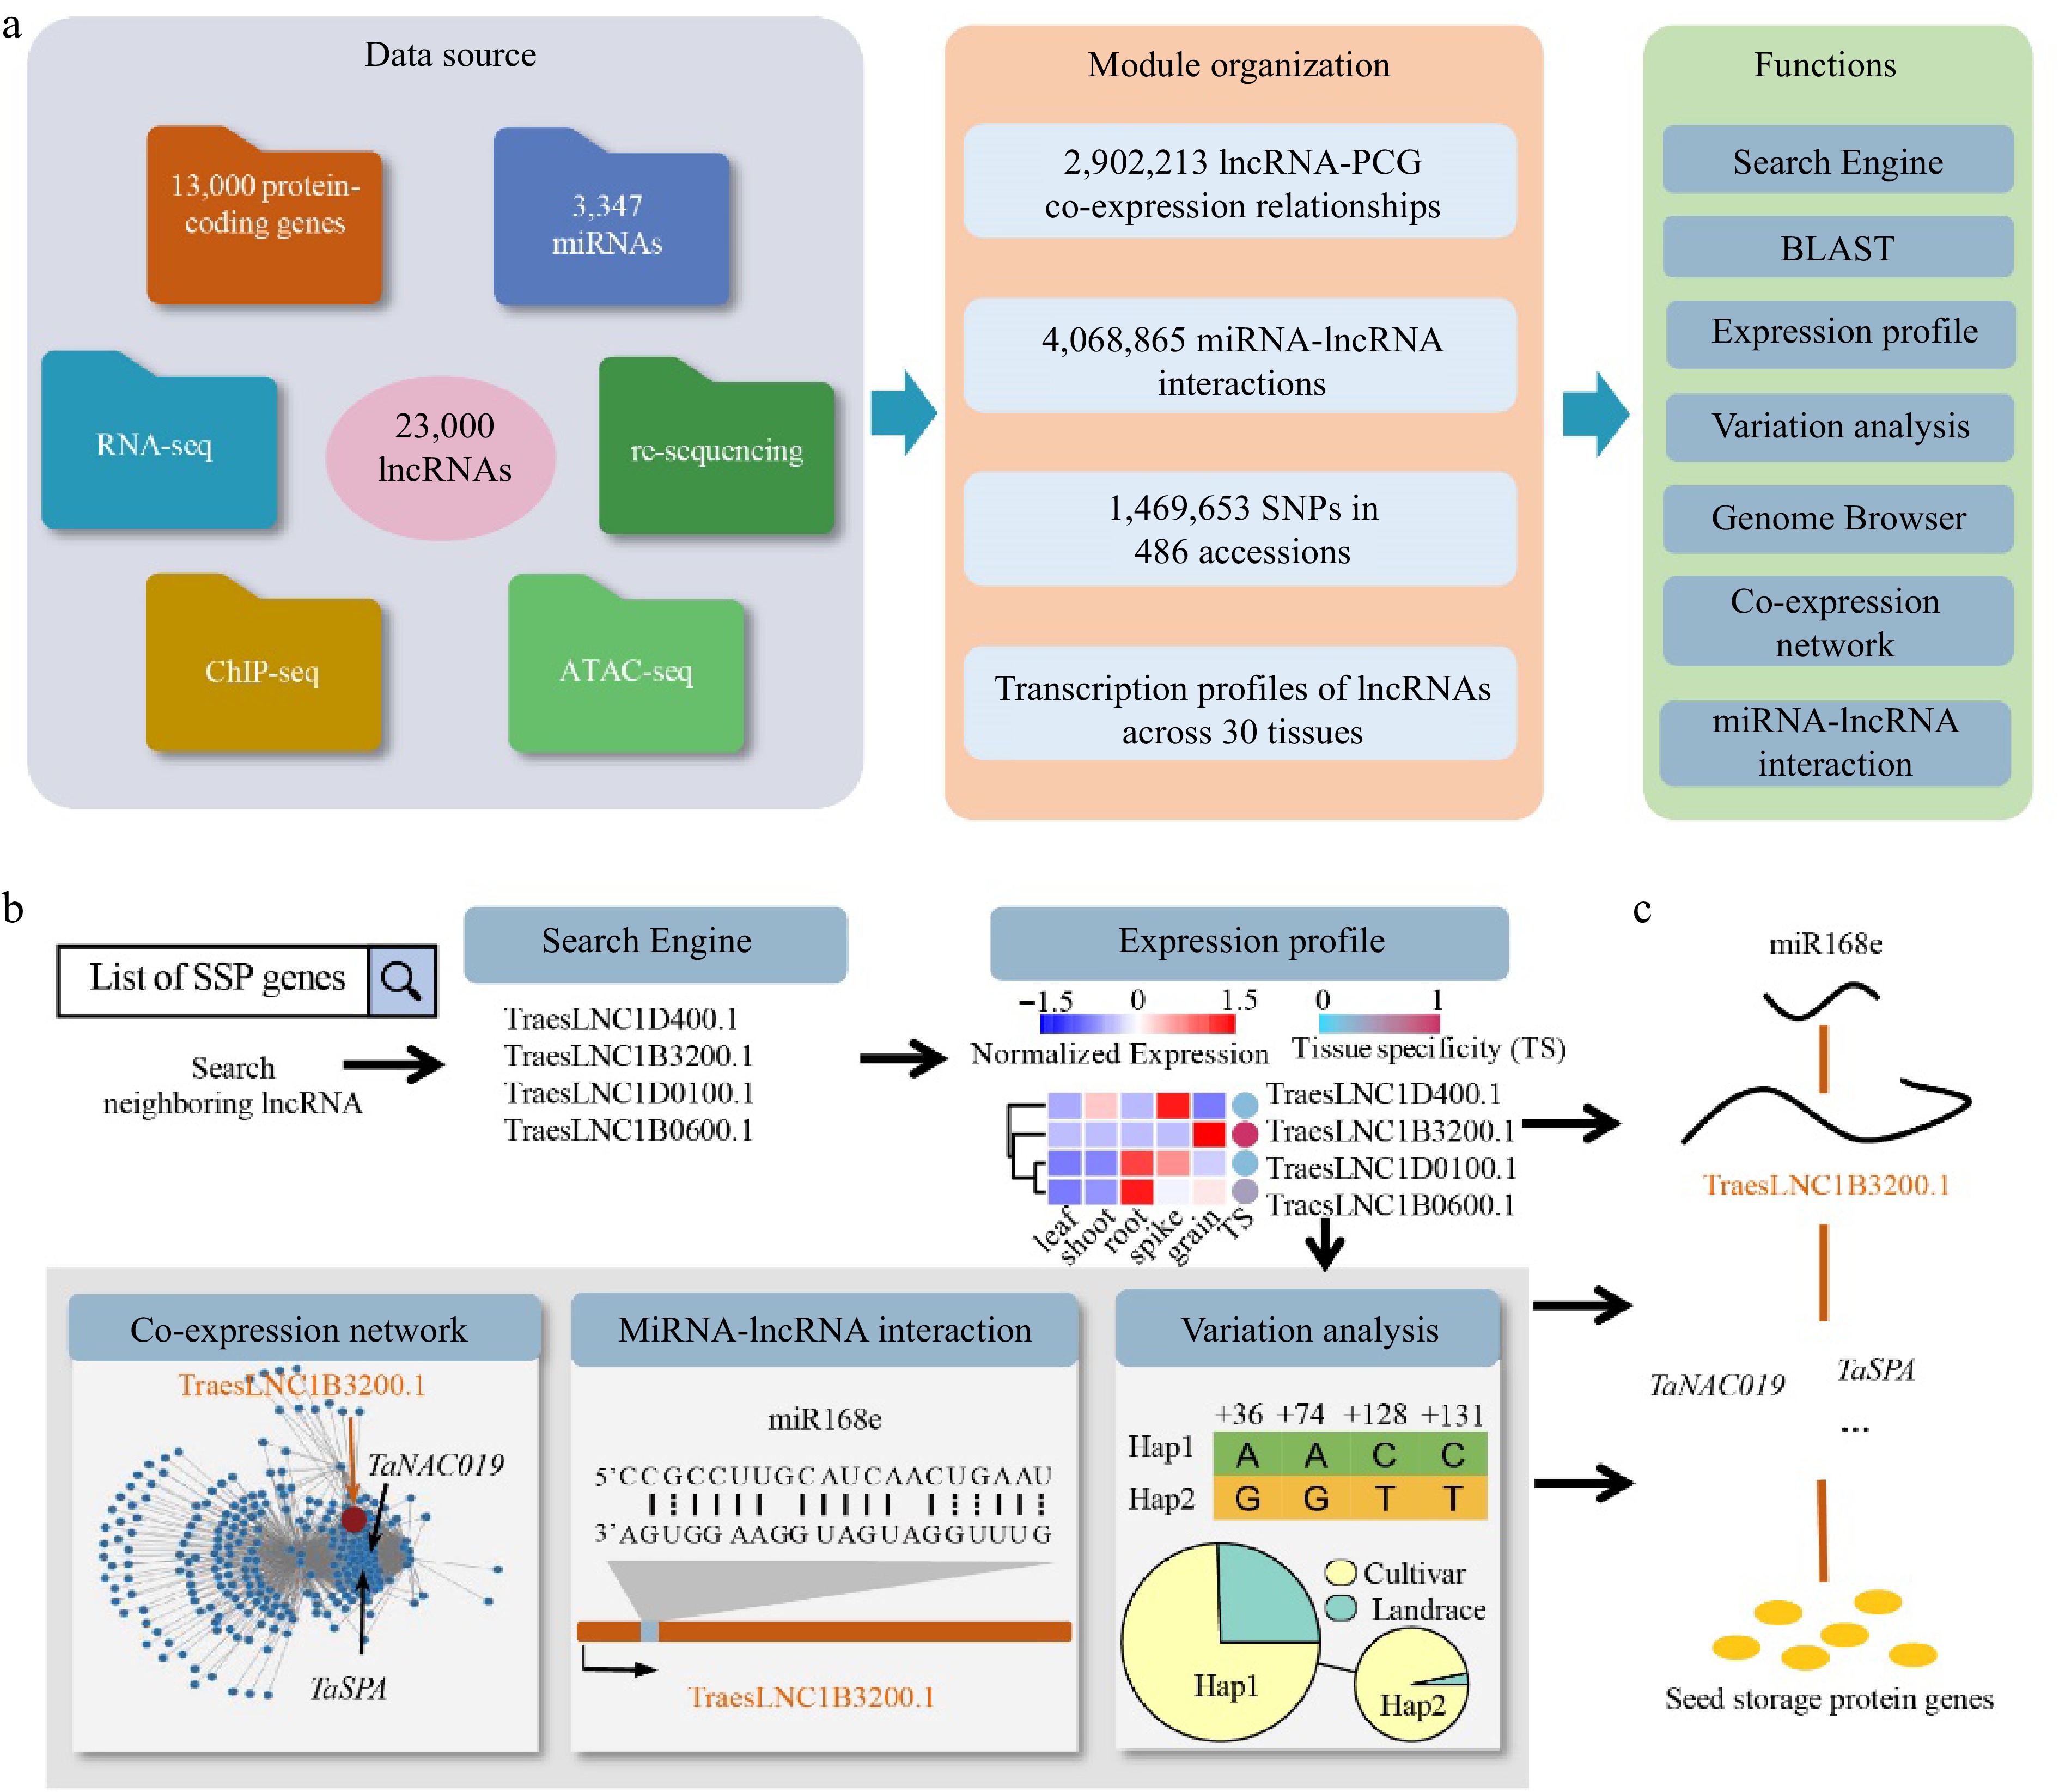
Figure 2.
Overview of wLNCdb and its application in exploring lncRNAs. (a) The framework of wLNCdb, including multi-omics datasets as a resource database for construction (left panel), module organization (middle panel), and interactive analysis and visualization tools (right panel). (b) A case study showing how wLNCdb can be used to explore functional lncRNAs. The 'Search Engine' module used a list of seed storage protein (SSP) genes as the input and identified SSP-associated lncRNAs. The 'Expression profile' module shows the normalized expression levels (Z-score) and tissue-specificity scores of the identified lncRNAs. For each gene or lncRNA, the tissue-specificity score was calculated by dividing the average TPM in a tissue by the sum of the average TPM values of all tissues. The 'Co-expression network' module shows protein-coding genes (blue nodes) co-expressed with TraesLNC1B3200 (orange node), together with their regulatory relationships (edges) acquired from wGRN[38]. The 'miRNA-lncRNA interaction' module shows the predicted interactions between miR168e and TraesLNC1B3200. The 'Variation analysis' module shows the variation profiles and haplotype distribution of TraesLNC1B3200 across 125 Chinese wheat accessions. (c) Proposed model of the role of TraesLNC1B3200 in regulating grain development and end-use quality, supported by wLNCdb.
-
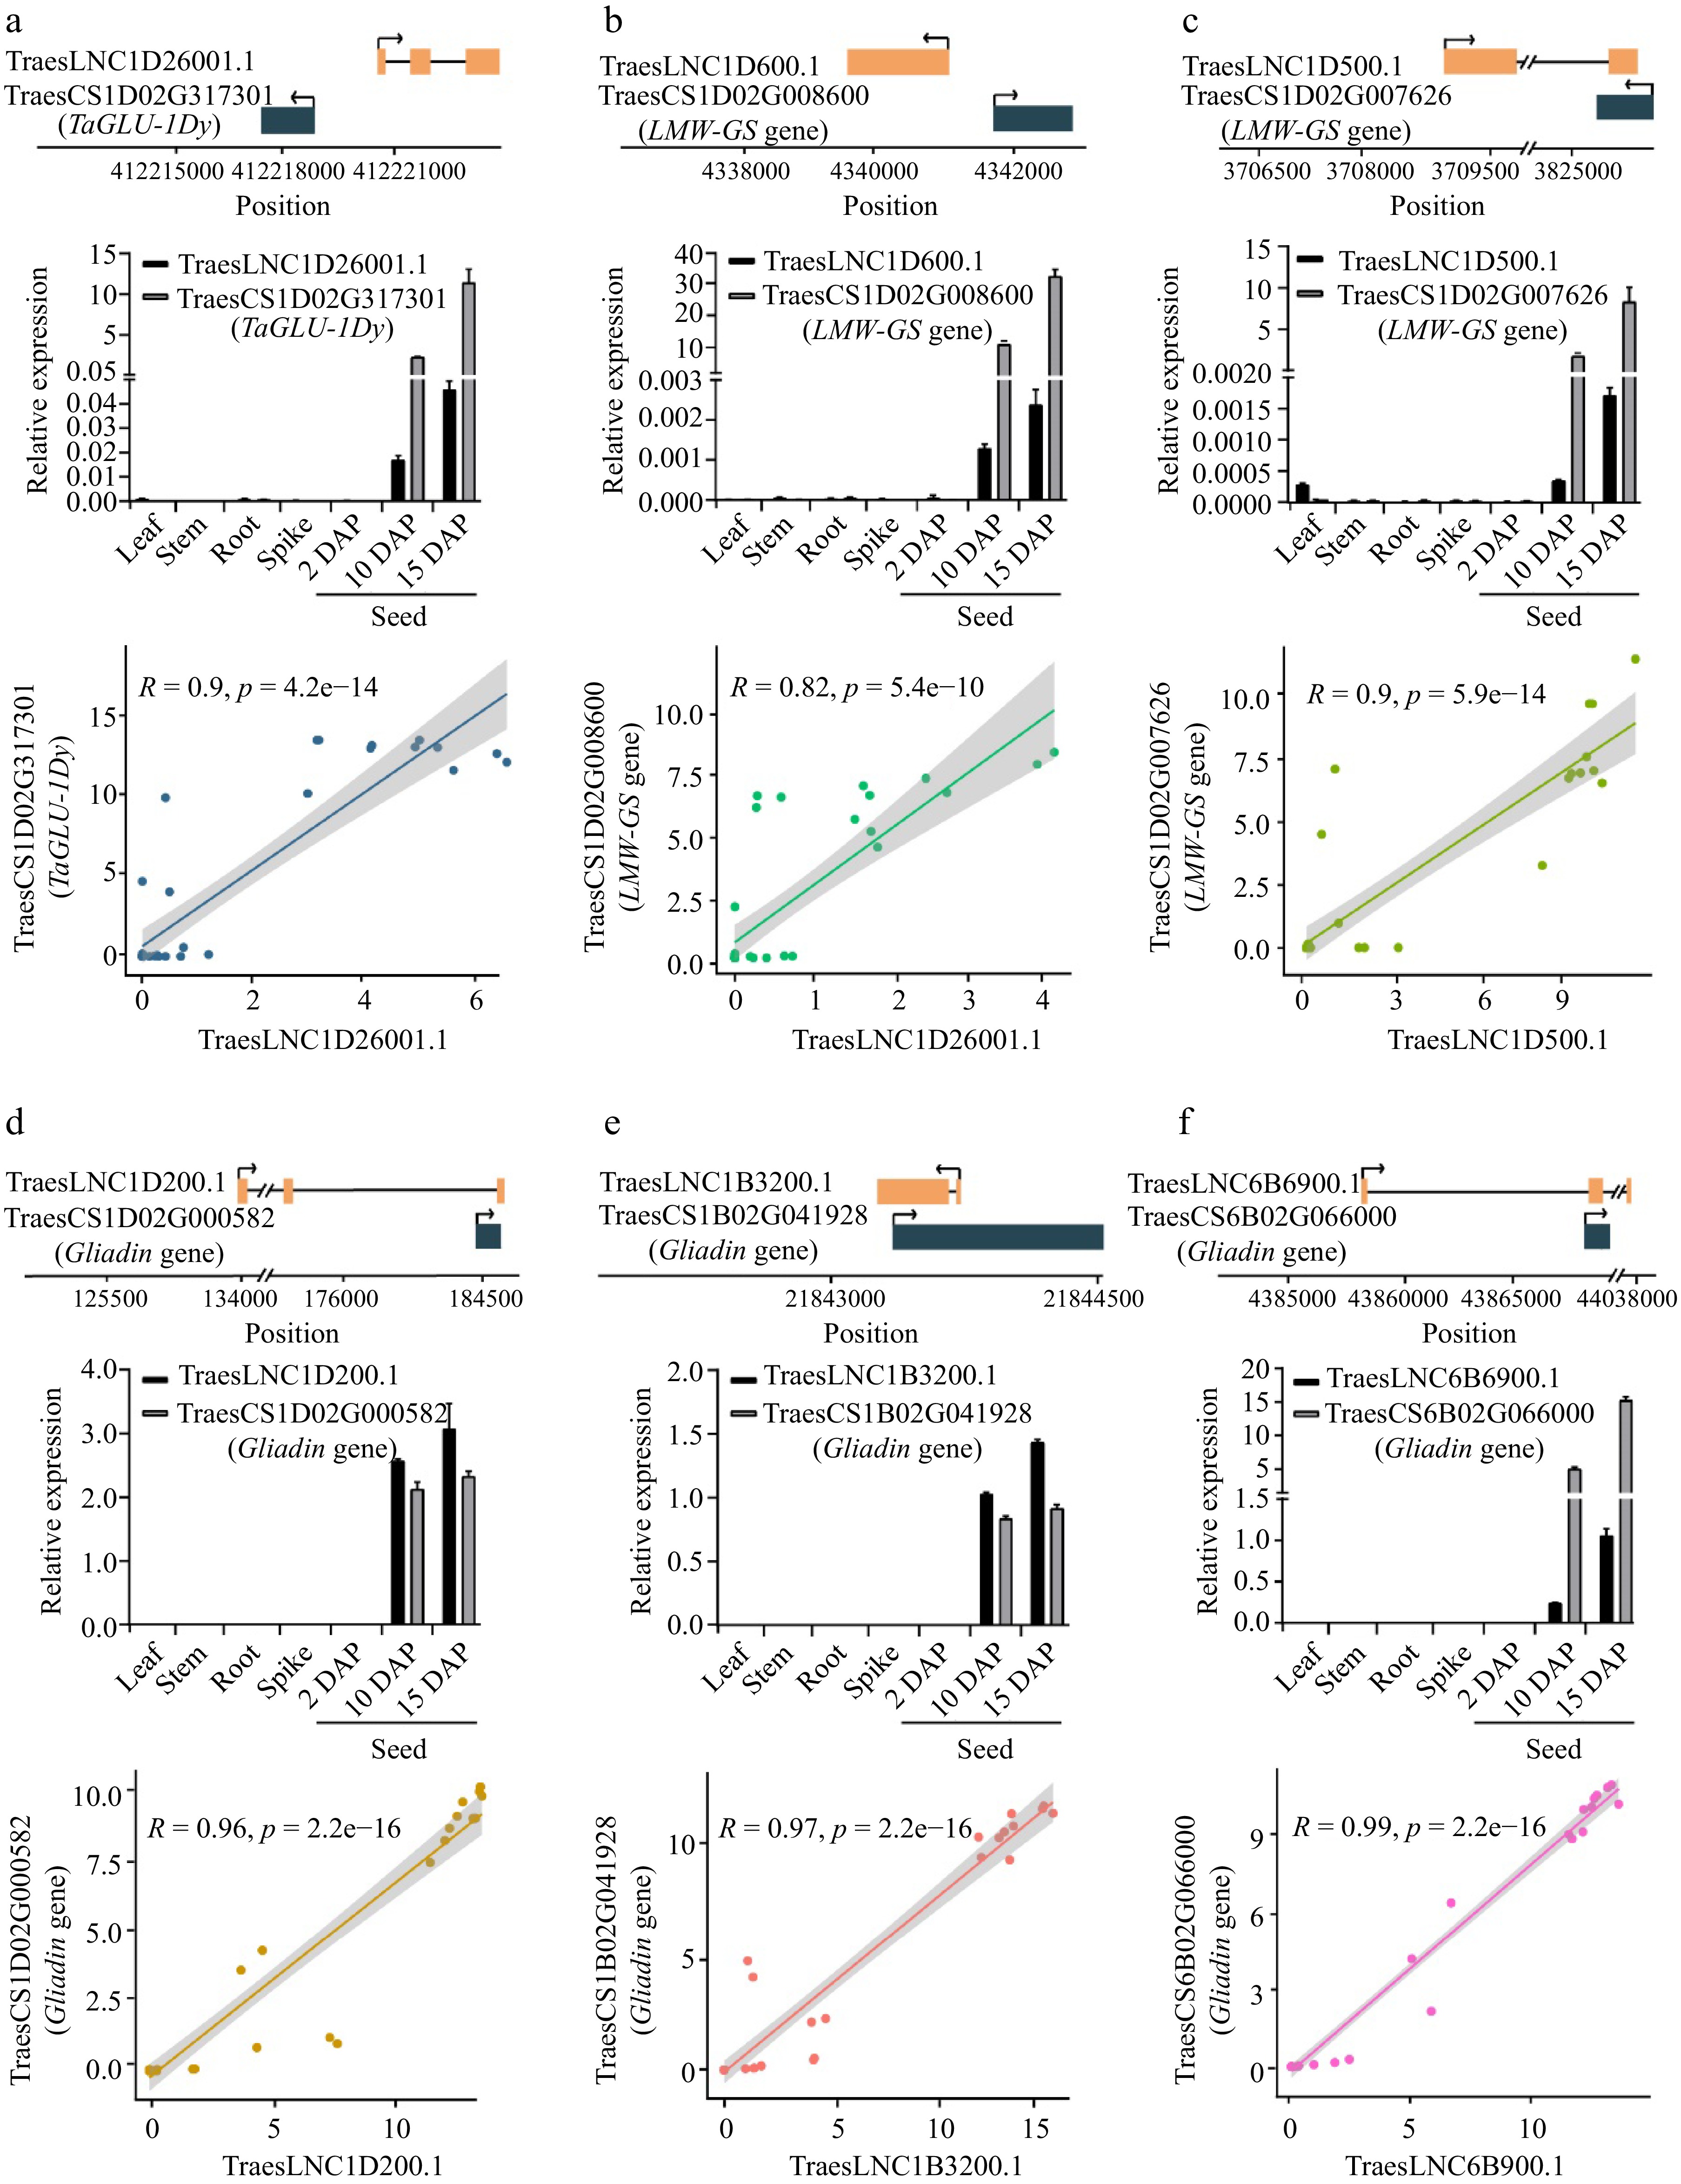
Figure 3.
The relative position, expression, and Pearson correlation coefficient between the expression levels of lncRNAs and cis-regulated SSP genes. (a) TraesLNC1D26001.1 and TraesCS1D02G317301, (b) TraesLNC1D0600.1 and TraesCS1D02G008600, (c) TraesLNC1D0500.1 and TraesCS1D02G007626, (d) TraesLNC1D0200.1 and TraesCS1D02G000582, (e) TraesLNC1B3200.1 and TraesCS1B02G041928, (f) TraesLNC6B6900.1 and TraesCS6B02G066000. For example, (a) shows the relative position, expression, and Pearson correlation coefficient between the expression level of TraesLNC1D26001.1 and TraesCS1D02G317301. The upper panel shows the gene structure and physical locations of TraesLNC1D26001.1 and TraesCS1D02G317301. The middle panel shows TraesLNC1D26001.1 and TraesCS1D02G317301 expression in leaves, stems, roots, young spikes (2 cm), and seeds at 2, 10, and 15 d after pollination (DAP), as revealed by RT-qPCR. Data were normalized to wheat TaACTIN and are shown as mean ± SD from three biological replicates. The bottom panel shows the Pearson correlation coefficient between the expression levels of TraesLNC1D26001.1 and TraesCS1D02G317301. R, Pearson’s correlation coefficient of transcription leves of TraesLNC1D26001.1 and TraesCS1D02G317301 across 37 samples. Each point represents a tissue, with the x-axis and y-axis representing the log2(TPM + 1) of TraesLNC1D26001.1 and TraesCS1D02G317301 in that tissue, respectively.
-
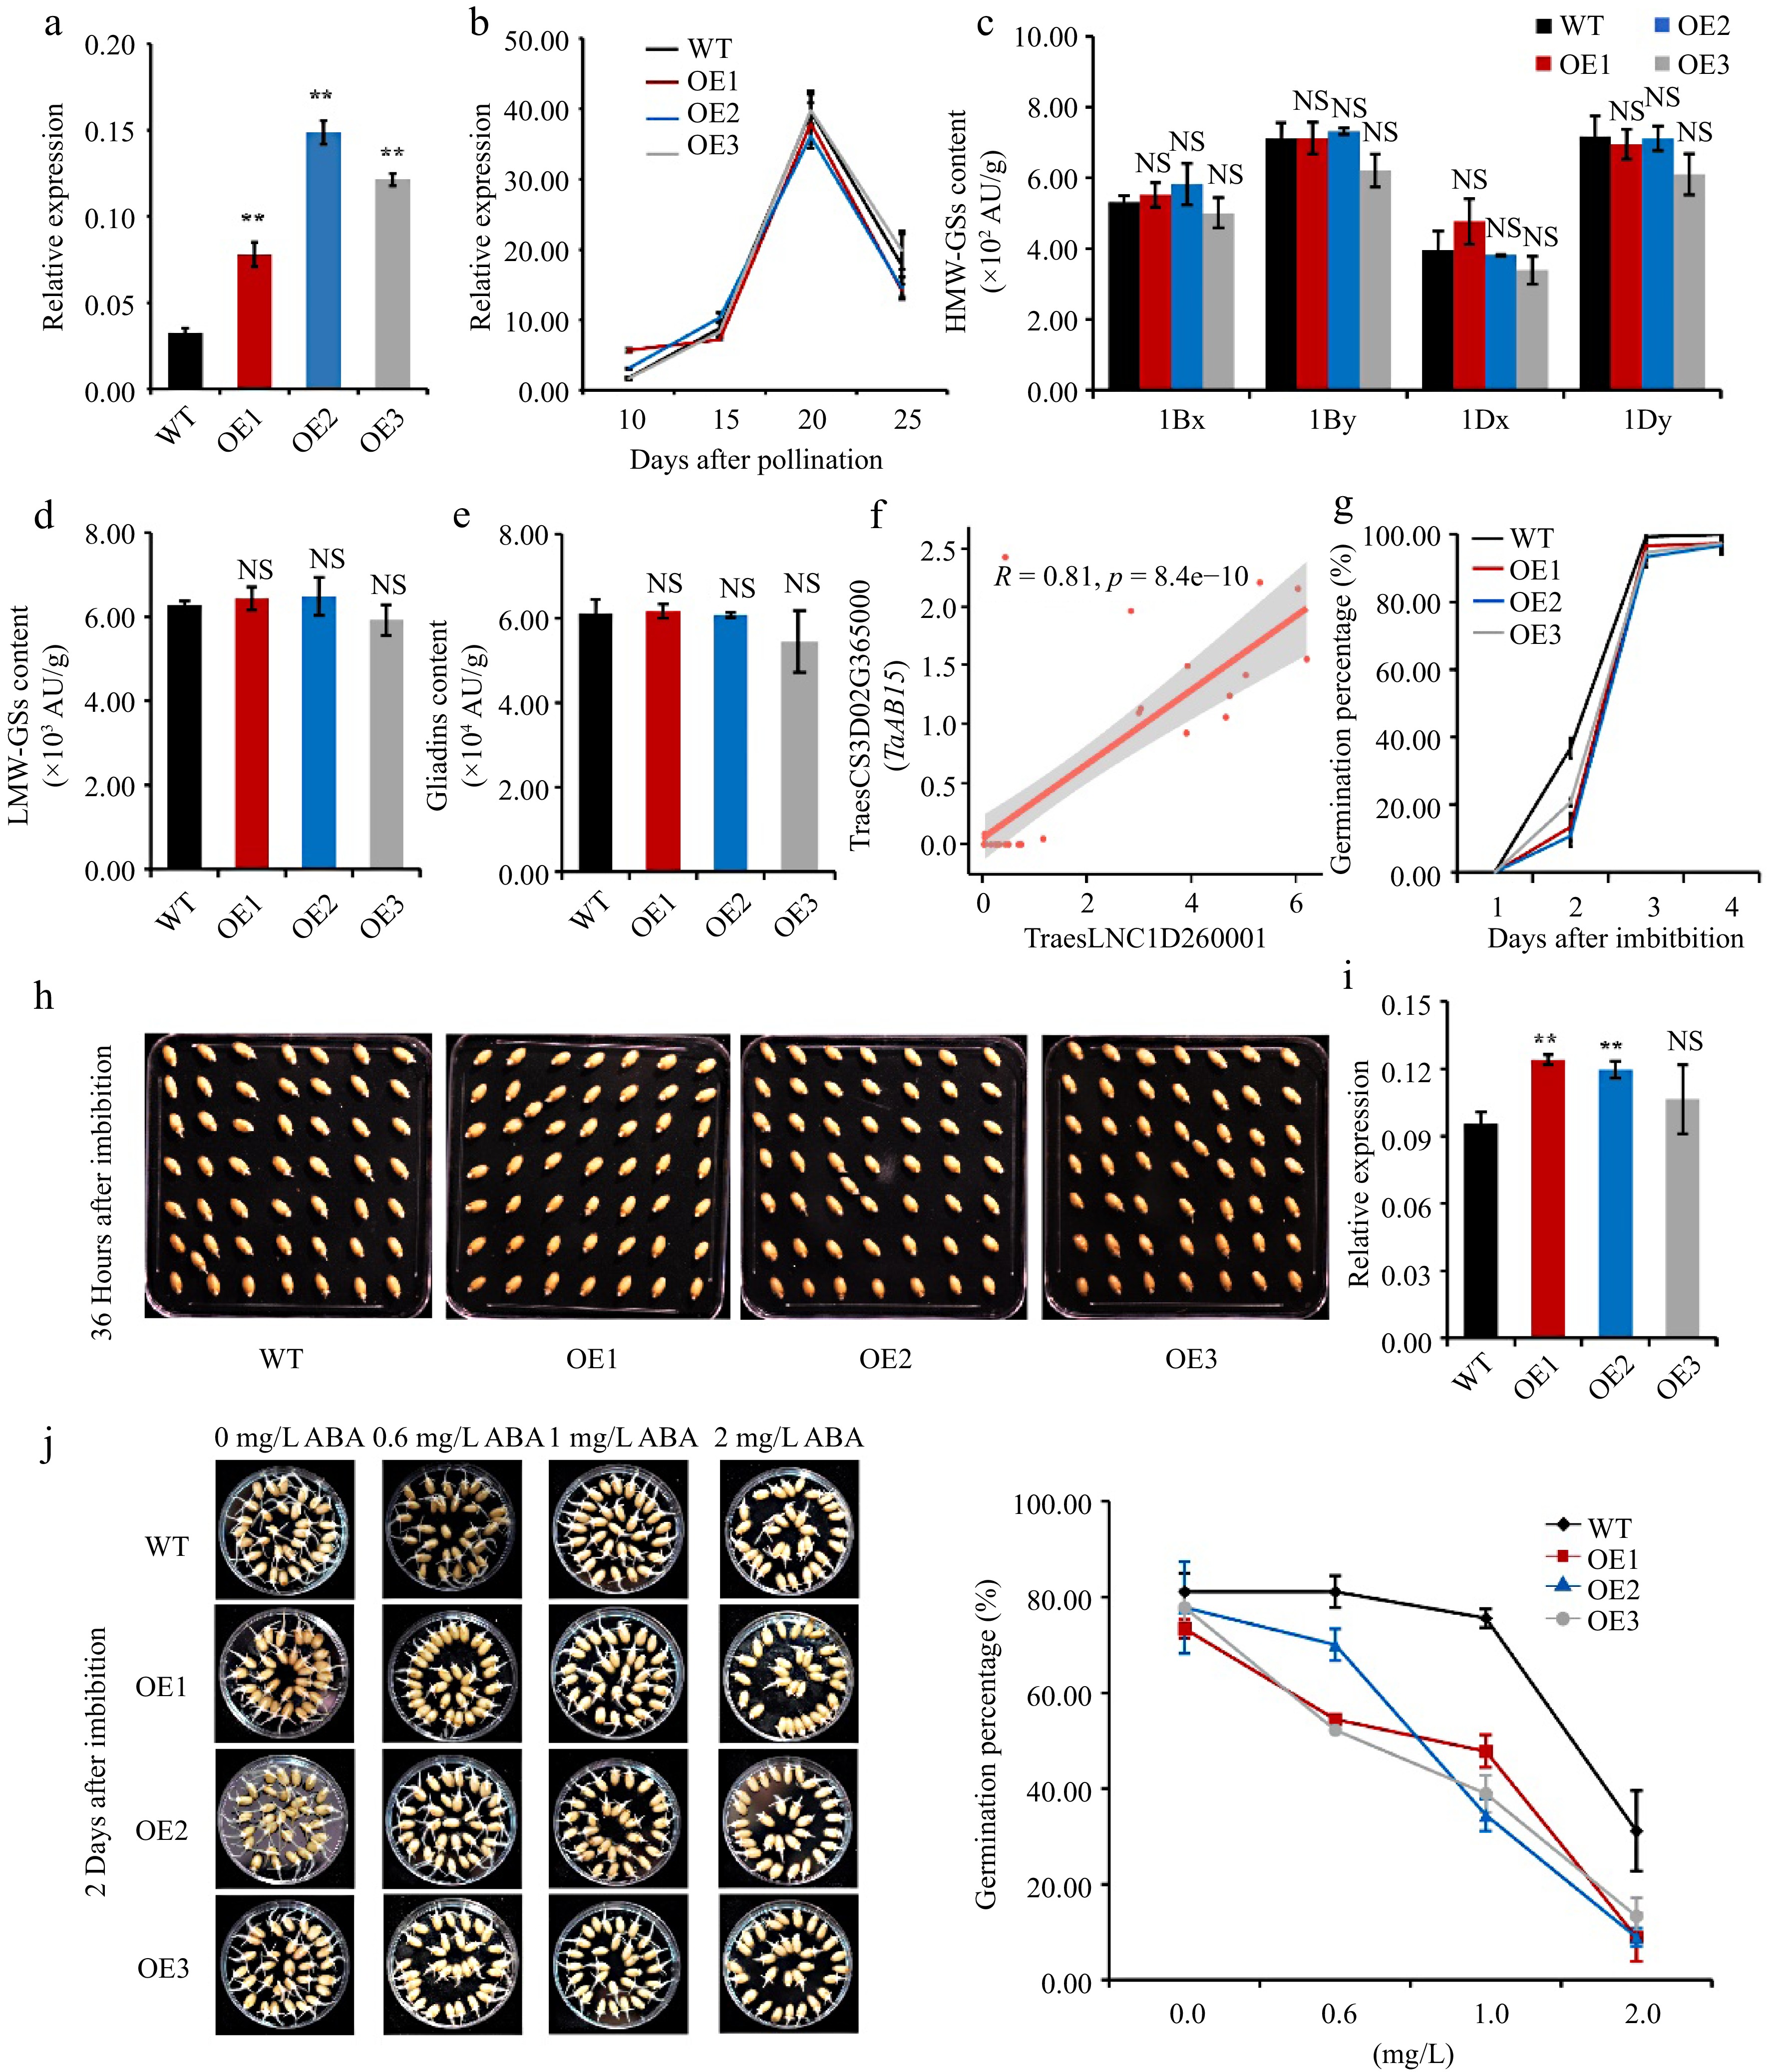
Figure 4.
Overexpressing TraesLNC1D26001.1 delays germination in wheat. (a) TraesLNC1D26001.1 expression levels determined by RT-qPCR in three independent TraesLNC1D26001.1-overexpression lines (OE1, OE2, and OE3) and the wild type (WT). Data were normalized to TaACTIN and are shown as mean ± SD from three biological replicates. Significant differences compared to the WT are indicated by **, p < 0.01, as determined by Student's t-test. NS, no significant difference. The statistical analyses described here applied to all other statistical analyses in this figure. (b) TaGLU-1Dy expression determined by RT-qPCR in OE1, OE2, OE3, and the WT using RNA extracted from whole seeds at 10, 15, 20, and 25 DAP. Data were normalized to TaACTIN and are shown as mean ± SD from three biological replicates. (c) High-molecular-weight glutenins (HMW-GSs), (d) low-molecular-weight glutenins (LMW-GSs), and (e) gliadin content in OE1, OE2, OE3, and the WT, as determined by reverse-phase high-performance liquid chromatography (RP-HPLC) analysis. Three biological replicates were carried out for each sample. (f) Pearson correlation coefficient between the expression levels of TraesLNC1D26001.1 and TraesCS3D02G365000 (TaABI5). R and p represent the Pearson correlation coefficient and p-value of TraesLNC1D26001.1 and TaABI5 expression in 37 samples, respectively. Each point represents a tissue, with the x-axis and y-axis representing the log2 (TPM+1) of TraesLNC1D26001.1 and TaABI5 in that tissue, respectively. (g−h) Germination percentages of OE1, OE2, OE3, and WT seeds. (g) Data are represented as a line connecting the average of three data points. (h) Representative photographs of OE1, OE2, OE3, and WT seeds at 36 h after imbibition (HAI) are also shown. (i) TaABI5 expression determined by RT-qPCR analysis in OE1, OE2, OE3, and the WT using RNA extracted from whole seeds at 1 d after imbibition (DAI). Data were normalized to TaACTIN and are shown as mean ± SD from three biological replicates. (j) Representative photographs and germination percentages of OE1, OE2, OE3, and WT seeds at 2 d after imbibition with 0, 0.6, 1 and 2 mg·L−1 ABA treatment, respectively. Data are represented as a line connecting the average of three data points.
-
Gene ID Gene name Function Number of co-expressed lncRNAs TraesCS6D02G168200 TaBT1-6D Adenine nucleotide transporter BT1, chloroplastic/amyloplastic/mitochondrial 8 TraesCS5D02G552900 TaCwi-5D Beta-fructofuranosidase, insoluble isoenzyme 3 213 TraesCS4A02G321700 TaCwi-4A Beta-fructofuranosidase, insoluble isoenzyme 3 210 TraesCS4A02G235600 TaSnRK2.10-4A Serine/threonine-protein kinase SAPK10 21 TraesCS2B02G390700 TaGBSSII Granule-bound starch synthase 1b, chloroplastic/amyloplastic (Fragment) 42 TraesCS2B02G240100 Beta-amylase Beta-amylase Tri a 17 26 TraesCS2A02G215100 Beta-amylase Beta-amylase Tri a 17 5 TraesCS1D02G342400 TaSTT3a-1D Dolichyl-diphosphooligosaccharide-protein glycosyltransferase subunit STT3A 2 TraesCS1B02G352700 TaSTT3a-1B Dolichyl-diphosphooligosaccharide-protein glycosyltransferase subunit STT3A 2 TraesCS1A02G340400 TaSTT3a-1A Dolichyl-diphosphooligosaccharide-protein glycosyltransferase subunit STT3A 1 TraesCS1A02G134100 TaSUT-1A Sucrose transport protein SUT 5 Table 1.
Genes co-expressed with lncRNAs involved in wheat grain size and weight and starch metabolism.
-
Gene ID Annotation Co-expressed lncRNAs TraesCS1D02G317301 HMW-GSs
(TaGLU-1Dy)TraesLNC1D26001.1 TraesCS1D02G008600 LMW-GSs TraesLNC1D600.1 TraesCS1D02G007626 LMW-GSs TraesLNC1D500.1 TraesCS1D02G007400 LMW-GSs TraesLNC1D500.1 TraesCS1A02G007934 LMW-GSs TraesLNC7D23000.1 TraesCS1D02G000582 ω-gliadin TraesLNC1D200.1 TraesCS1D02G000531 ω-gliadin TraesLNC1D200.1,
TraesLNCUn18600.1TraesCS1B02G041928 ω-gliadin TraesLNC1B3200.1 TraesCS1B02G011484 ω-gliadin TraesLNC1B700.2 TraesCS1B02G011467 ω-gliadin TraesLNC1B700.2 TraesCS1B02G011463 ω-gliadin TraesLNC1B700.2 TraesCS1B02G011460 ω-gliadin TraesLNC1B700.1 TraesCSU02G182638 ω-gliadin TraesLNC1D32300.1,
TraesLNC1A31800.1,
TraesLNC3B43500.1TraesCS1D02G001300 δ-gliadin TraesLNC7A20900.1,
TraesLNC7D23000.1,
TraesLNCUn39000.1TraesCS1D02G001400 γ-gliadin TraesLNC1B700.1 TraesCS1B02G011000 γ-gliadin TraesLNC1B700.1 TraesCS1B02G010900 γ-gliadin TraesLNC7D23000.1 TraesCS6B02G066100 α-gliadin TraesLNC6B6900.1,
TraesLNCUn39000.1TraesCS6B02G066000 α-gliadin TraesLNC6B6800.1,
TraesLNC6B6900.1TraesCS6A02G049400 α-gliadin TraesLNC7A20900.1 TraesCS6A02G049200 α-gliadin TraesLNC6A4700.1,
TraesLNC1B700.1TraesCS6A02G049100 α-gliadin TraesLNC6A4700.1 TraesCSU02G108100 α-gliadin TraesLNC1B700.1 Table 2.
Seed storage protein genes that are co-expressed with lncRNAs.
Figures
(4)
Tables
(2)