-
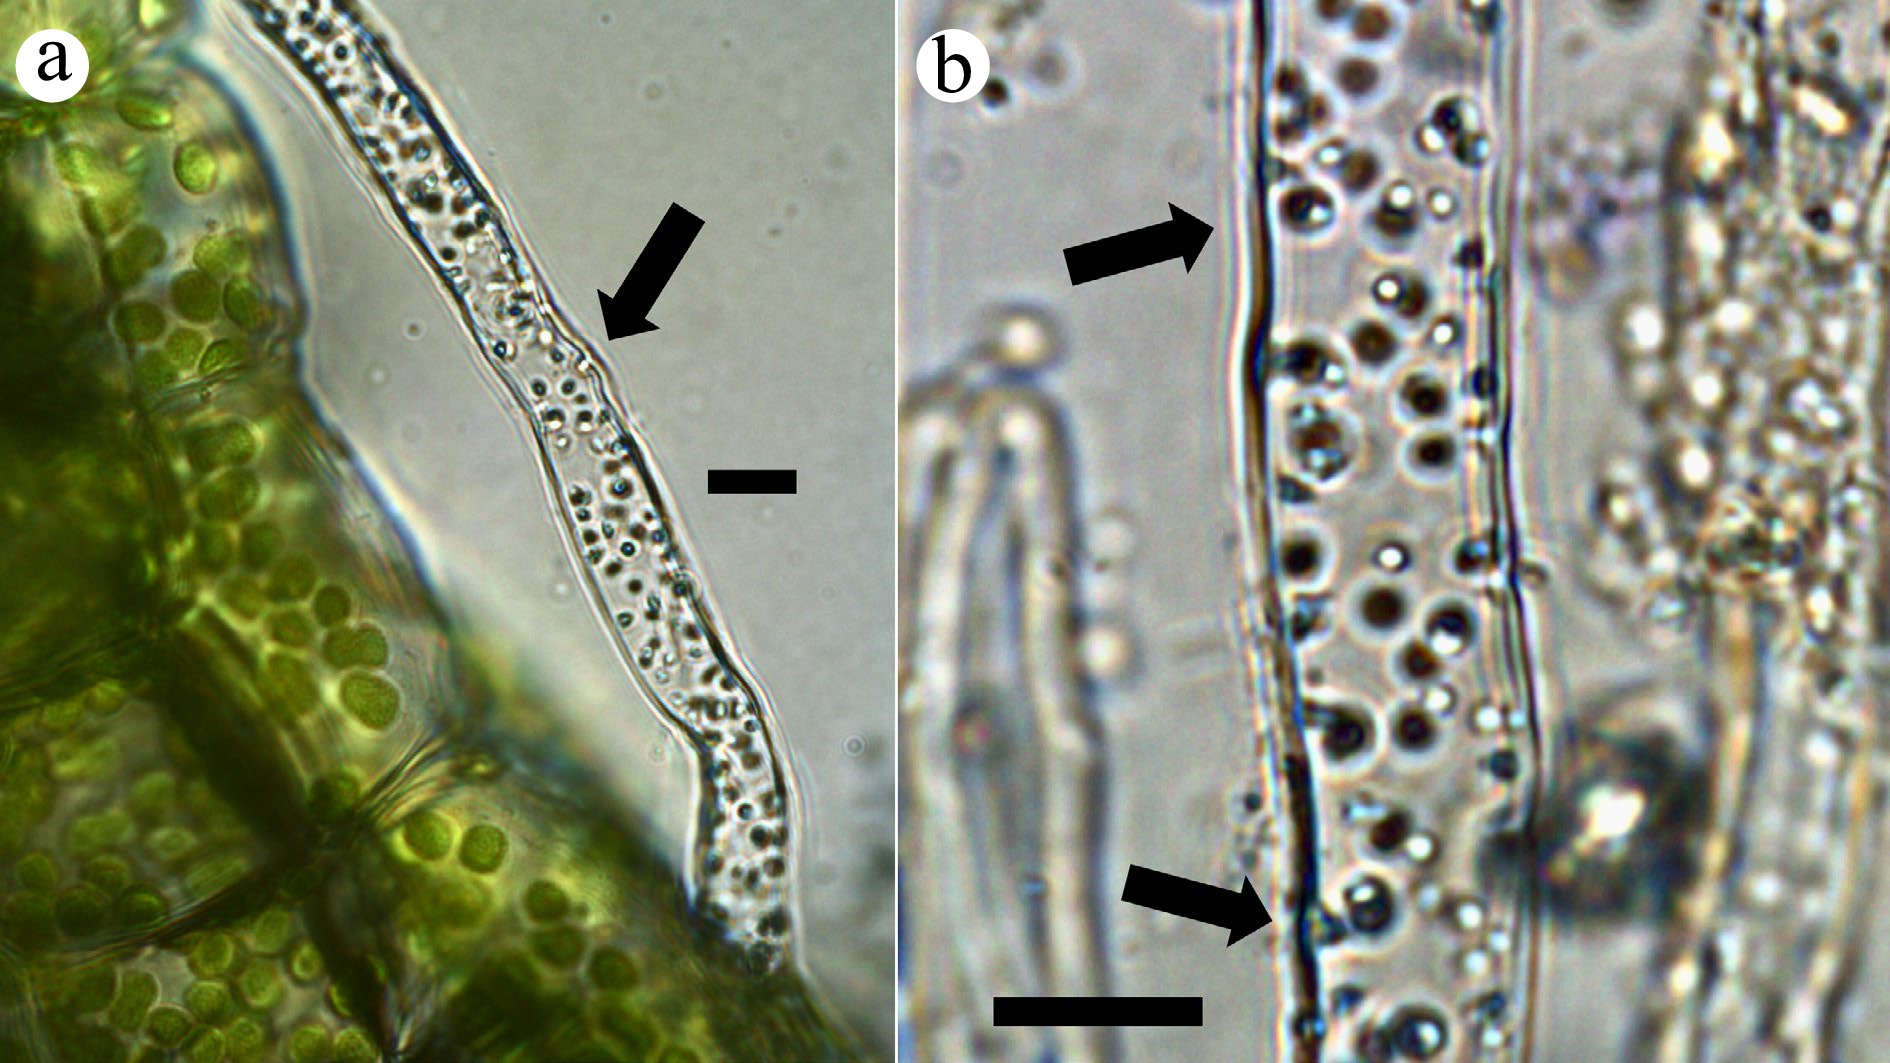
Figure 1.
Thallus surface and pegged rhizoid of a liverwort (Riccia fluitans). (a) Rhizoid stained with nitro blue tetrazolium (NBT) to visualize superoxide (blue color) around bacterial clusters within the filament (arrow; bar = 10 µ). (b) Rhizoid containing multiple clusters of bacteria, stained blue using NBT due to superoxide around bacteria (arrows; bar = 10 µ).
-
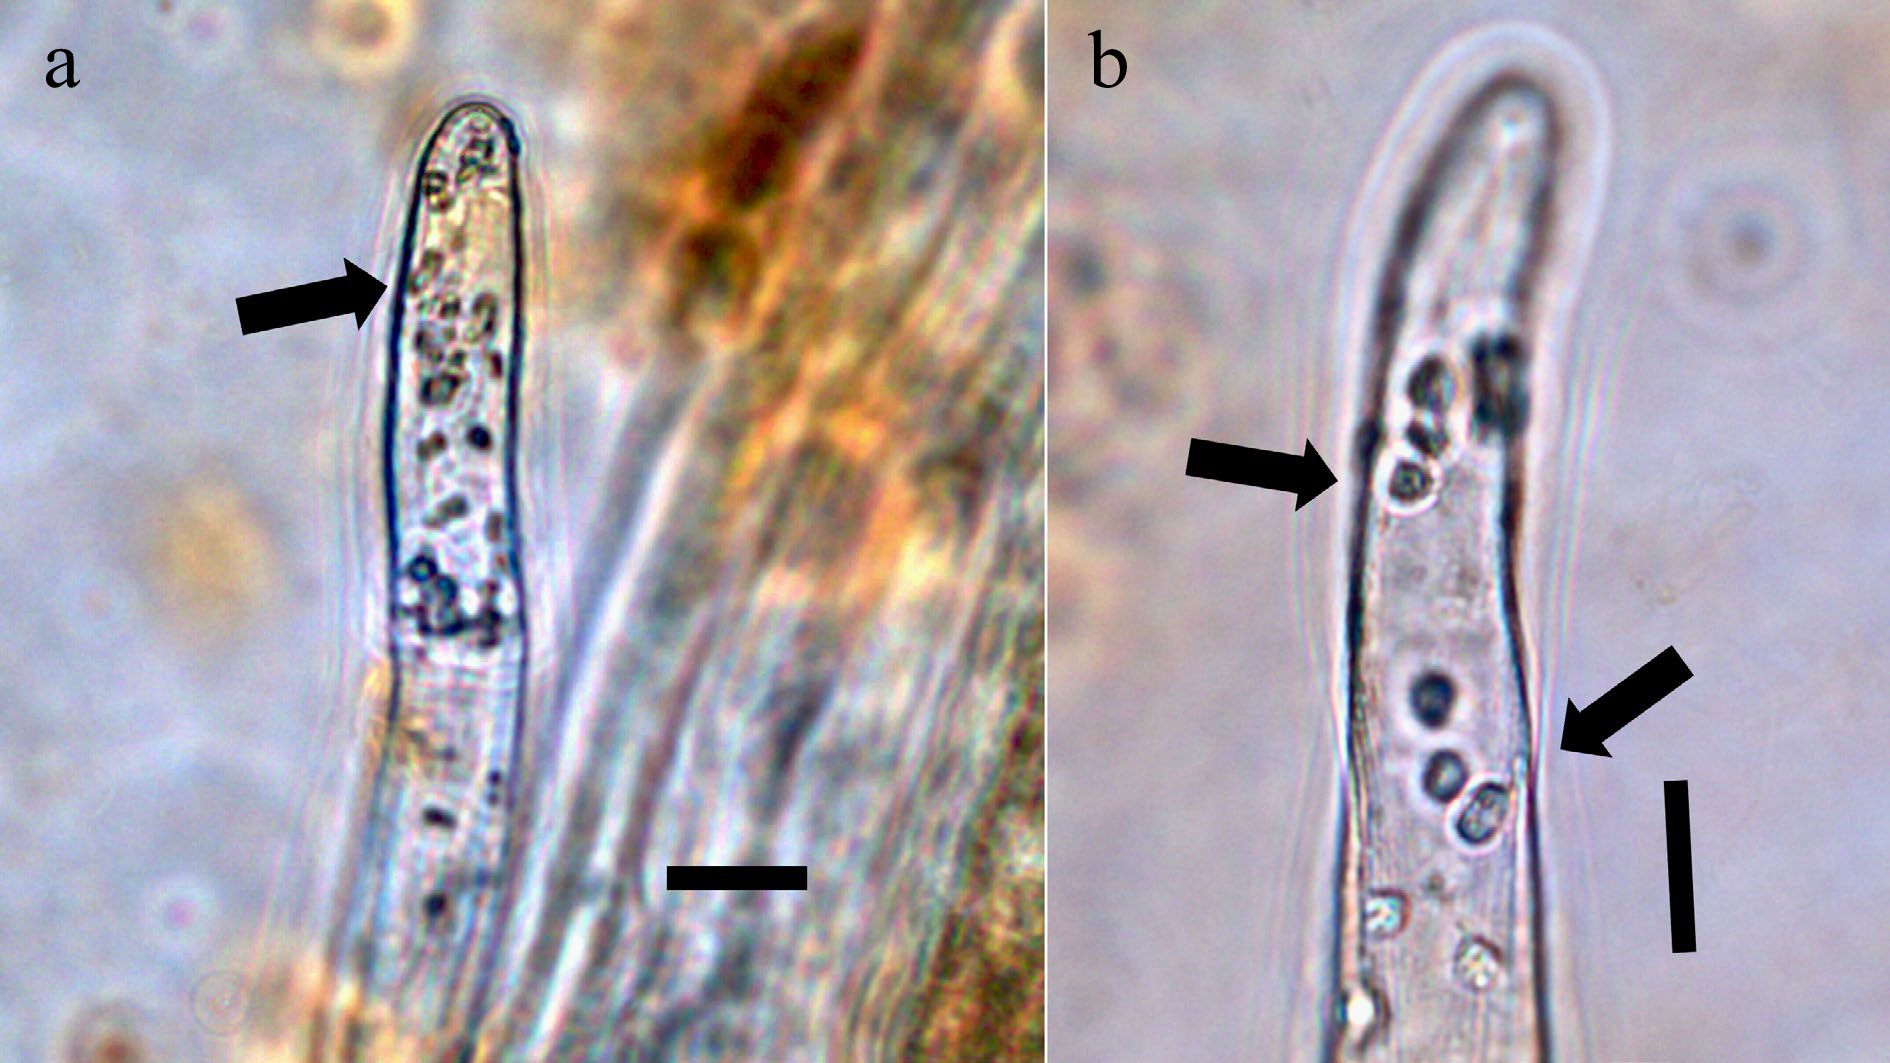
Figure 2.
Boston fern (Nephrolepis exaltata; Nephrolepidaceae) gametophyte rhizoids stained with a saturated solution of bromothymol blue to show ammonium (purple) around bacteria. (a) Rhizoid tip showing aggregation of bacteria in the tip (arrow; bar = 10 µ). (b) Rhizoid tip showing bacterial clusters in filament (arrow; bar = 10 µ).
-
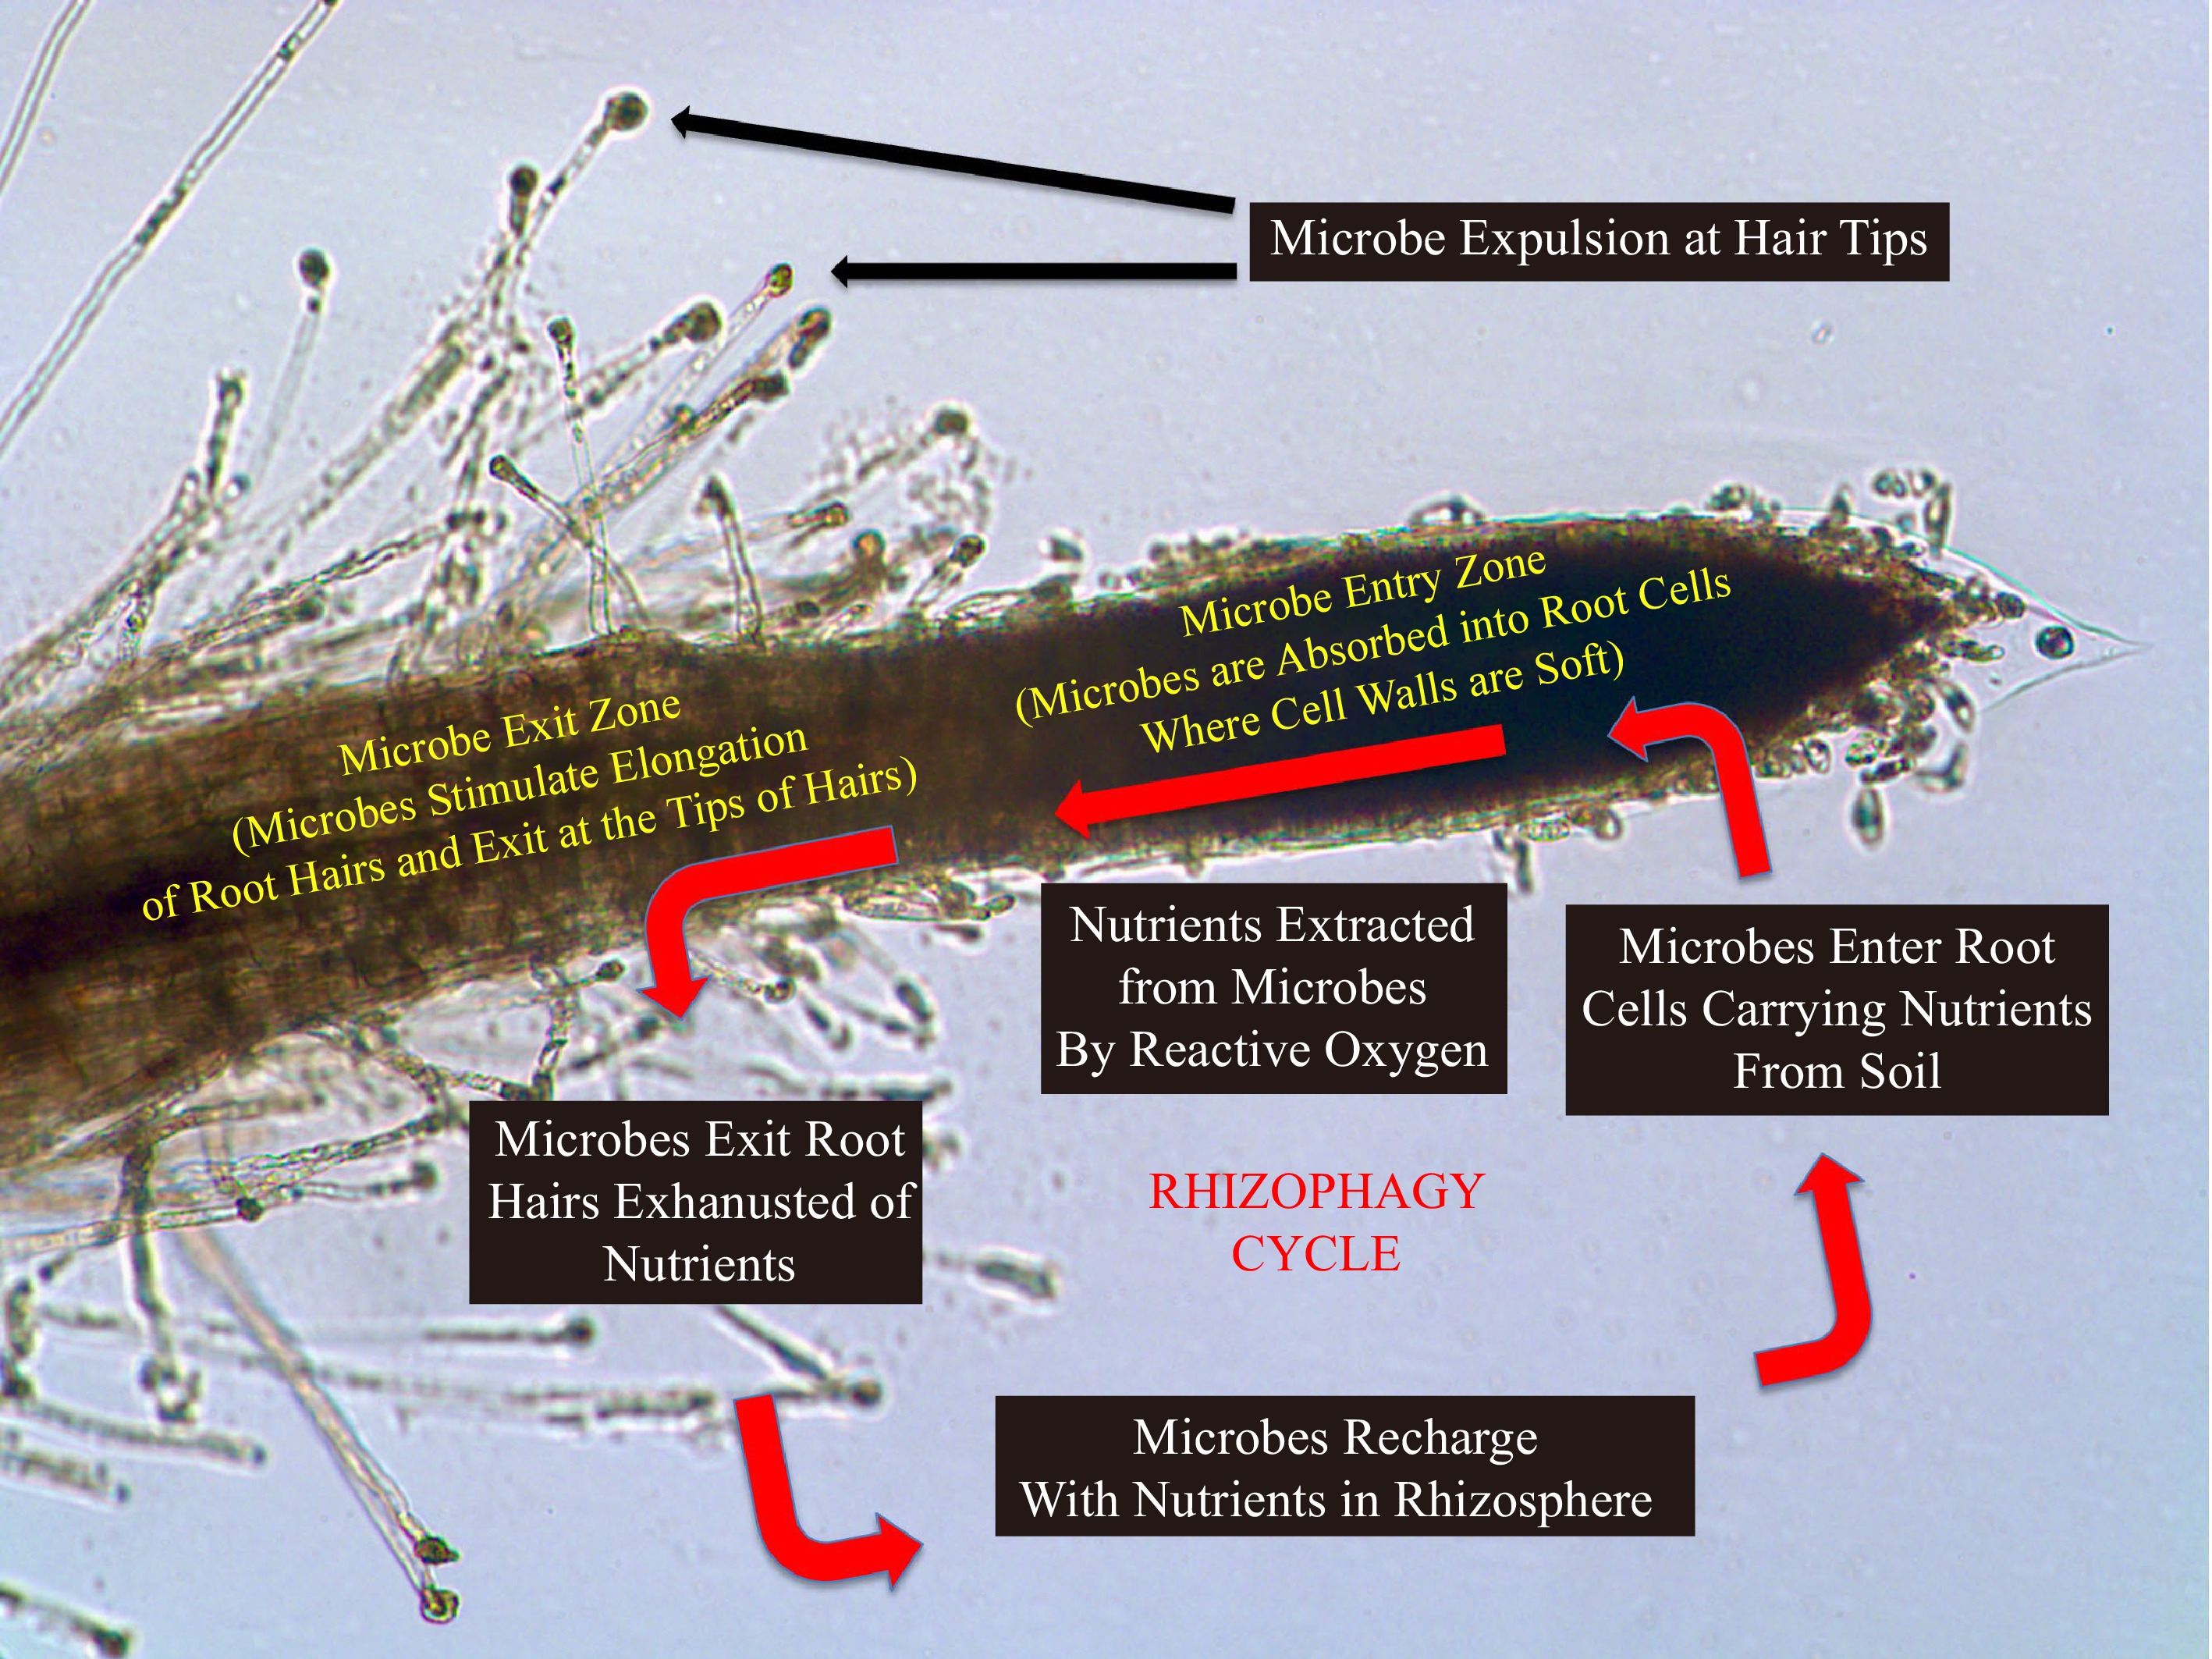
Figure 3.
Diagram showing the rhizophagy cycle, with a schematic of a root, with root cap to the right and developing root hairs to the left. In the rhizophagy cycle microbes alternate between a free-living phase in soil and an intracellular phase in root cells. The microbes obtain nutrients in the soil phase, and nutrients are extracted by the plant from microbes oxidatively in the endophytic phase inside the root. Microbes are expelled from root hairs at tips where they reform cell walls and reenter soil to acquire additional nutrients[12].
-
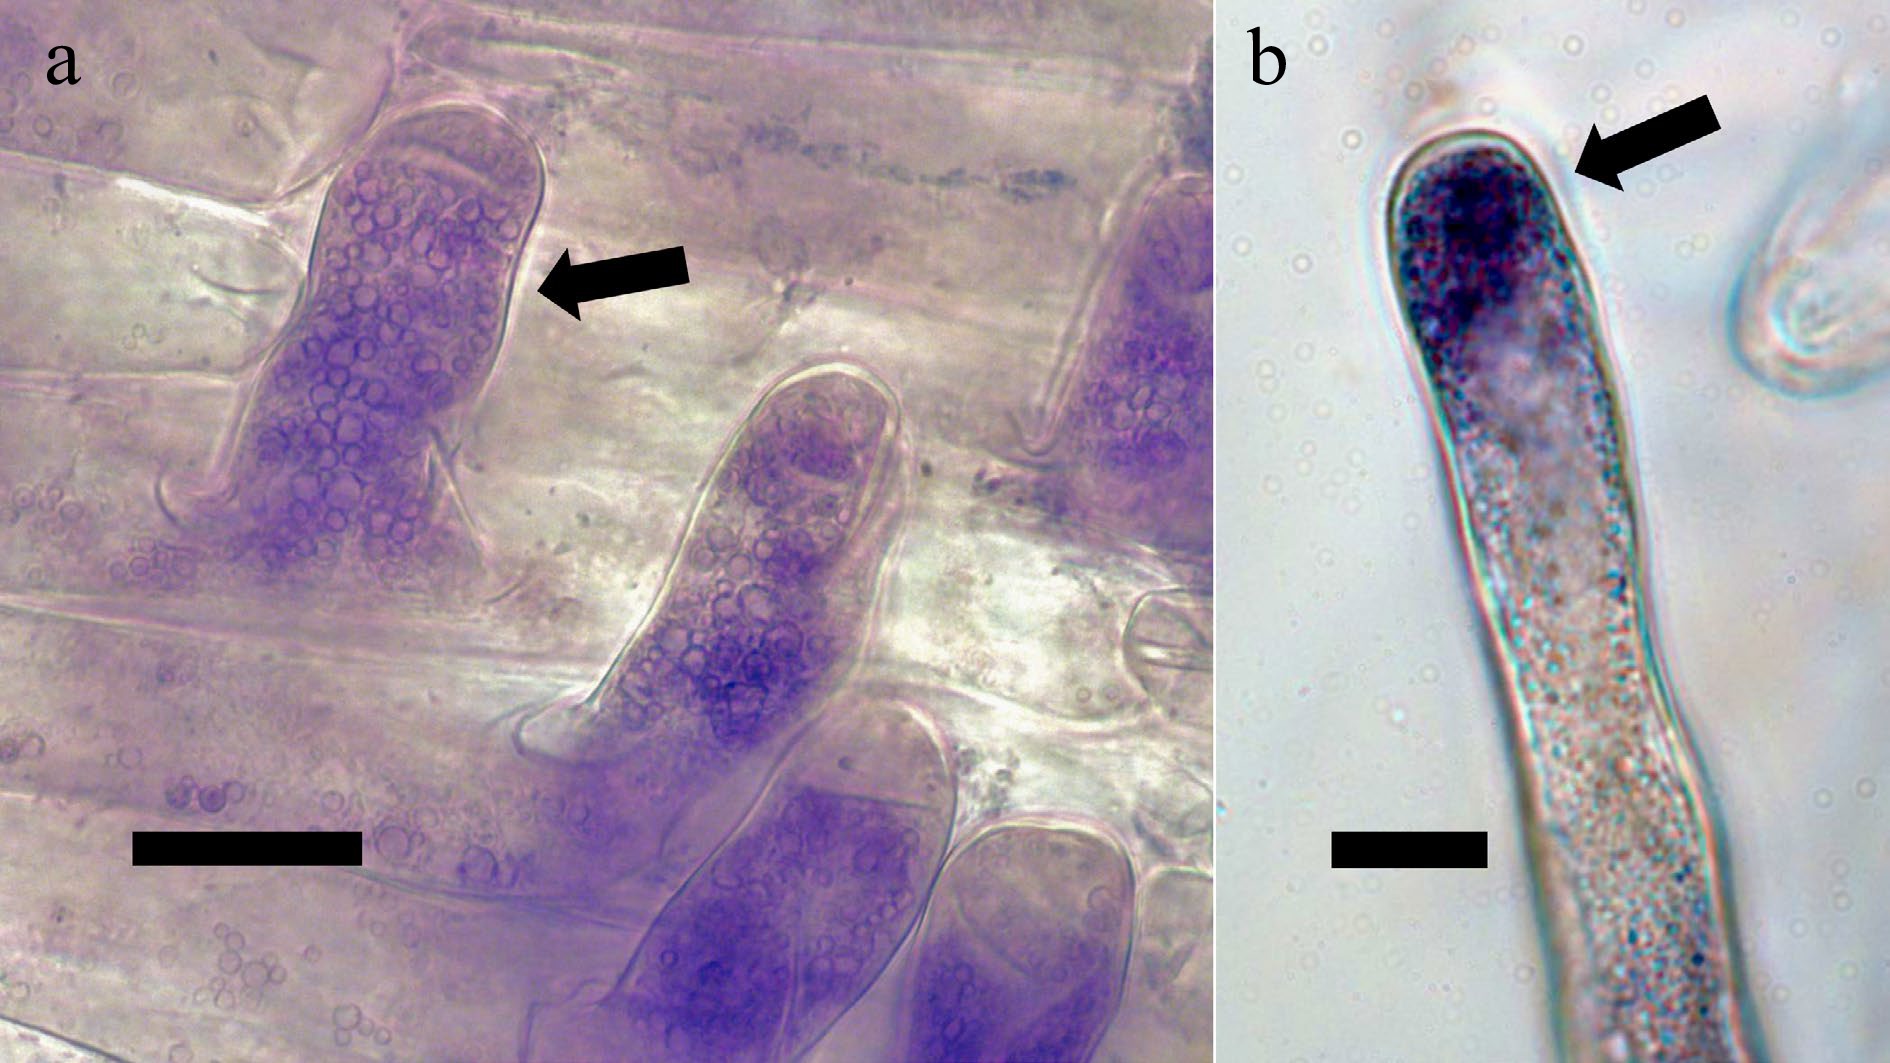
Figure 4.
Root hairs containing bacteria internally[9]. (a) Love-lies-bleeding (Amaranthus caudatus; Amaranthaceae) root hairs (arrow) stained with diaminobenzidine tetrahydrochloride to stain hydrogen peroxide (purple-brown color) around bacteria internally (bar = 10 µ). (b) Root hair of tall fescue (Festuca arundinacea; Poaceae) stained with nitro blue tetrazolium to visualize superoxide (blue color) around the bacteria in the tip of the hair (arrow; bar = 10 µ).
-
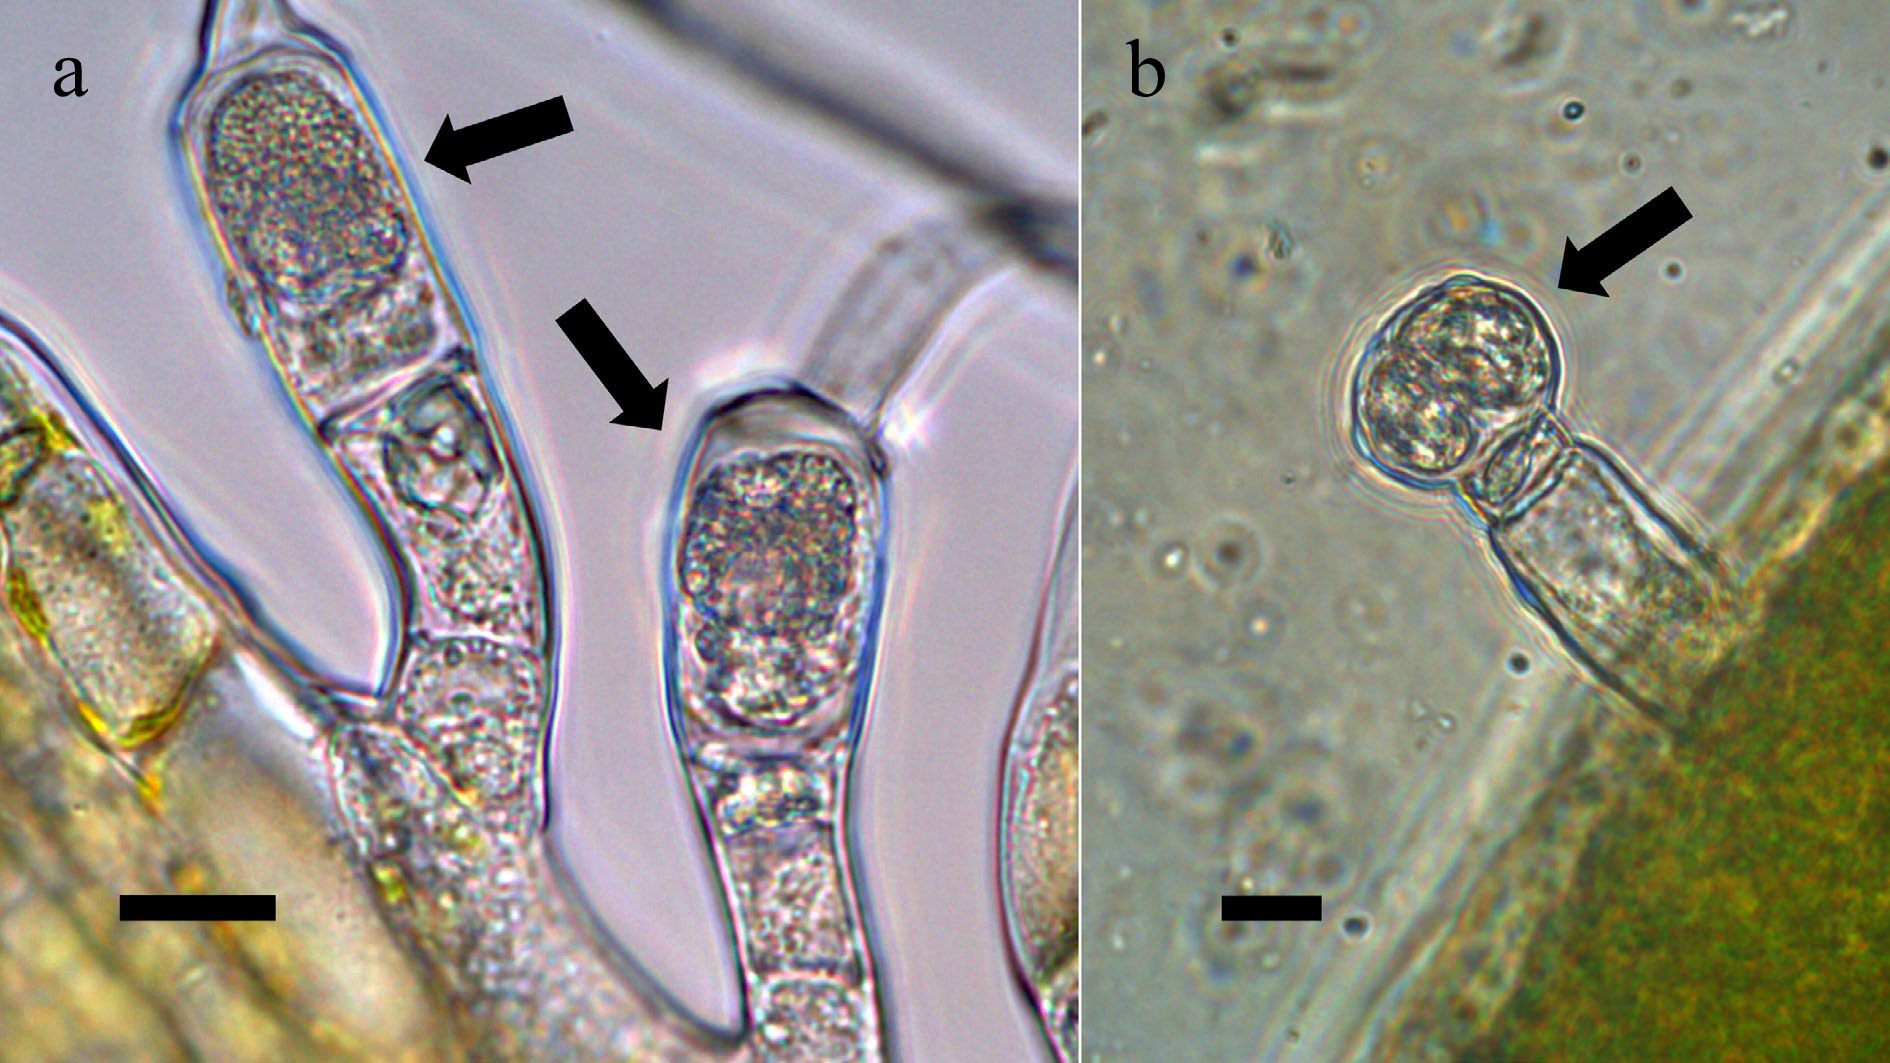
Figure 5.
Trichomes on seed plants stained using acidified diphenylamine stain to visualize nitrate (purple; arrows) around clusters of bacteria in hairs[10]. (a) Two trichomes (at arrows) on petals of Canadian goldenrod (Solidago canadensis; Asteraceae) (bar = 10 µ). (b) Trichome on young leaf of common mullein (Verbascum thapsus; Scrophulariaceae) showing accumulation of nitrate around bacterial mass in head of trichome (bar = 10 µ).
-
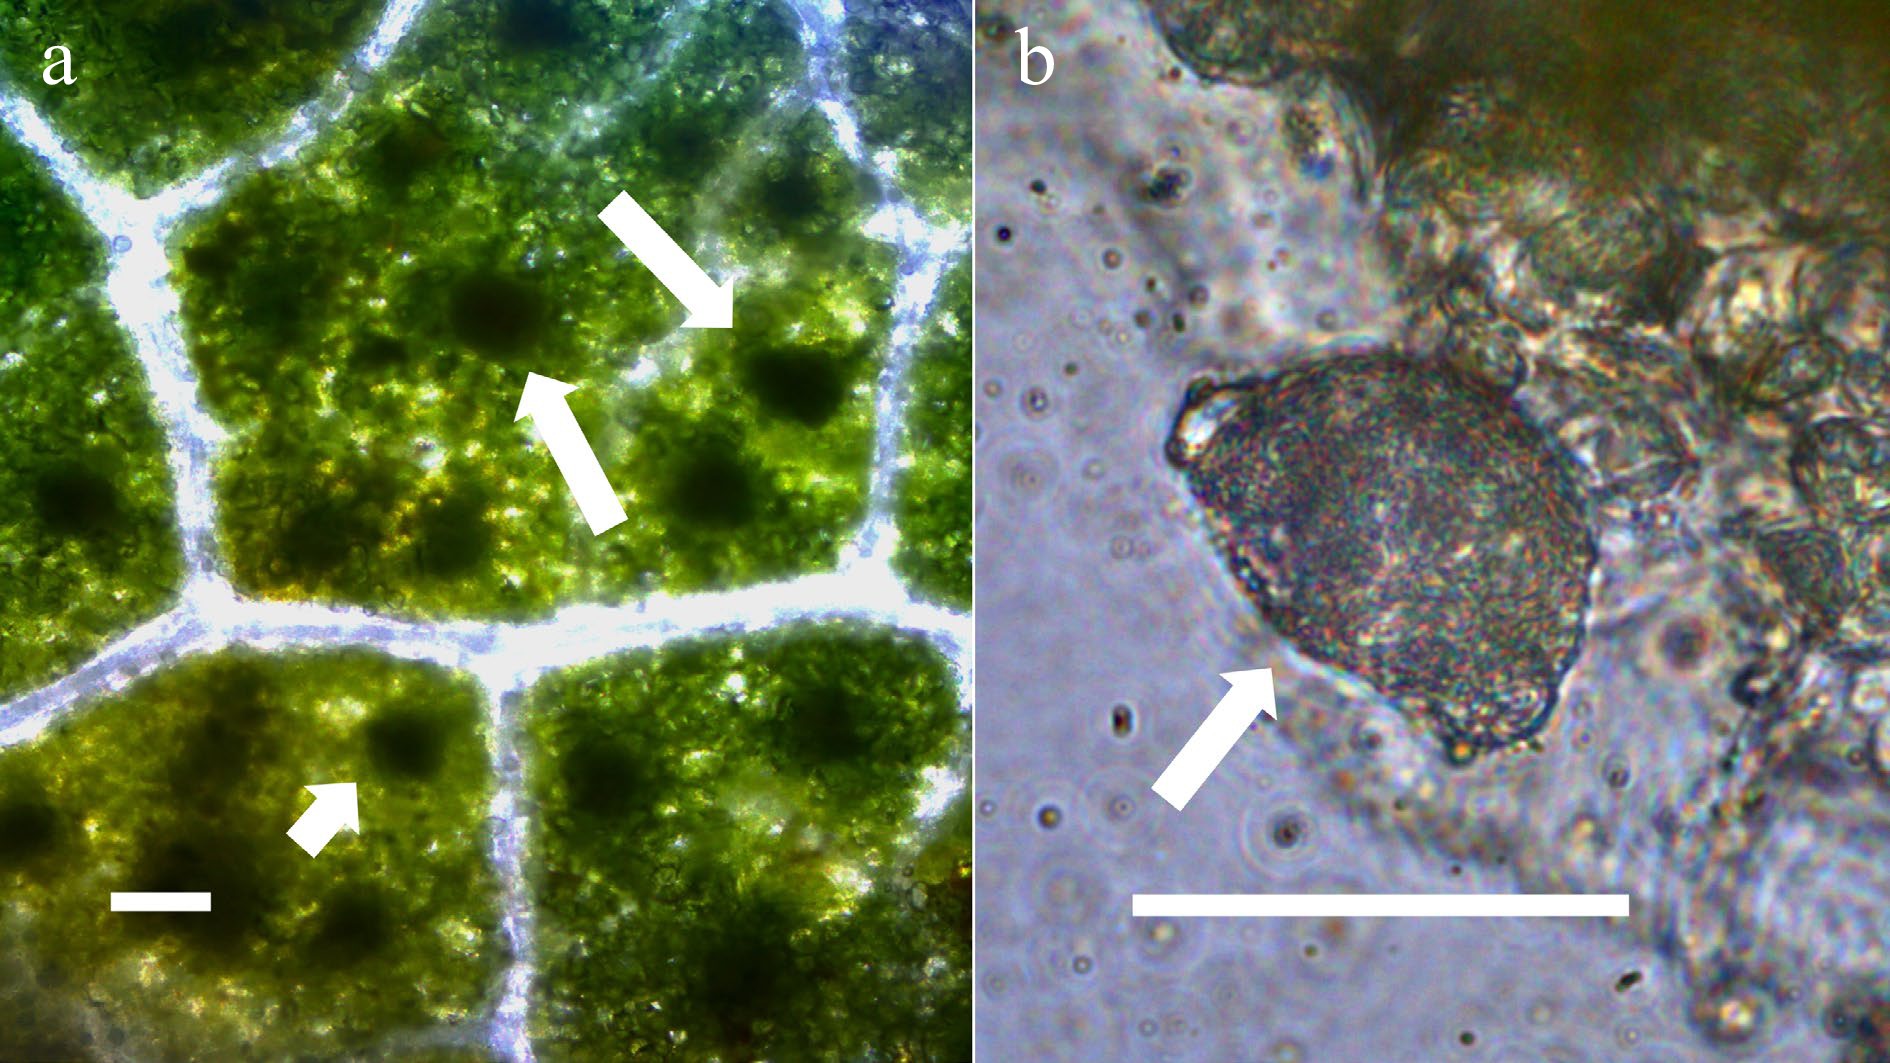
Figure 6.
Leaves of portia tree (Thespesia populnea; Malvaceae) with bacterial leaf nodules[10]. (a) Leaf stained with acidified diphenylamine to show nitrate (blue color) in leaves around bacterial masses (arrows point to leaf nodules) (bar = 50 µm). (b) Arrow points to mass of bacteria from a leaf nodule stained with acidified diphenylamine to show nitrate (blue color) around bacteria (bar = 50 µm).
-
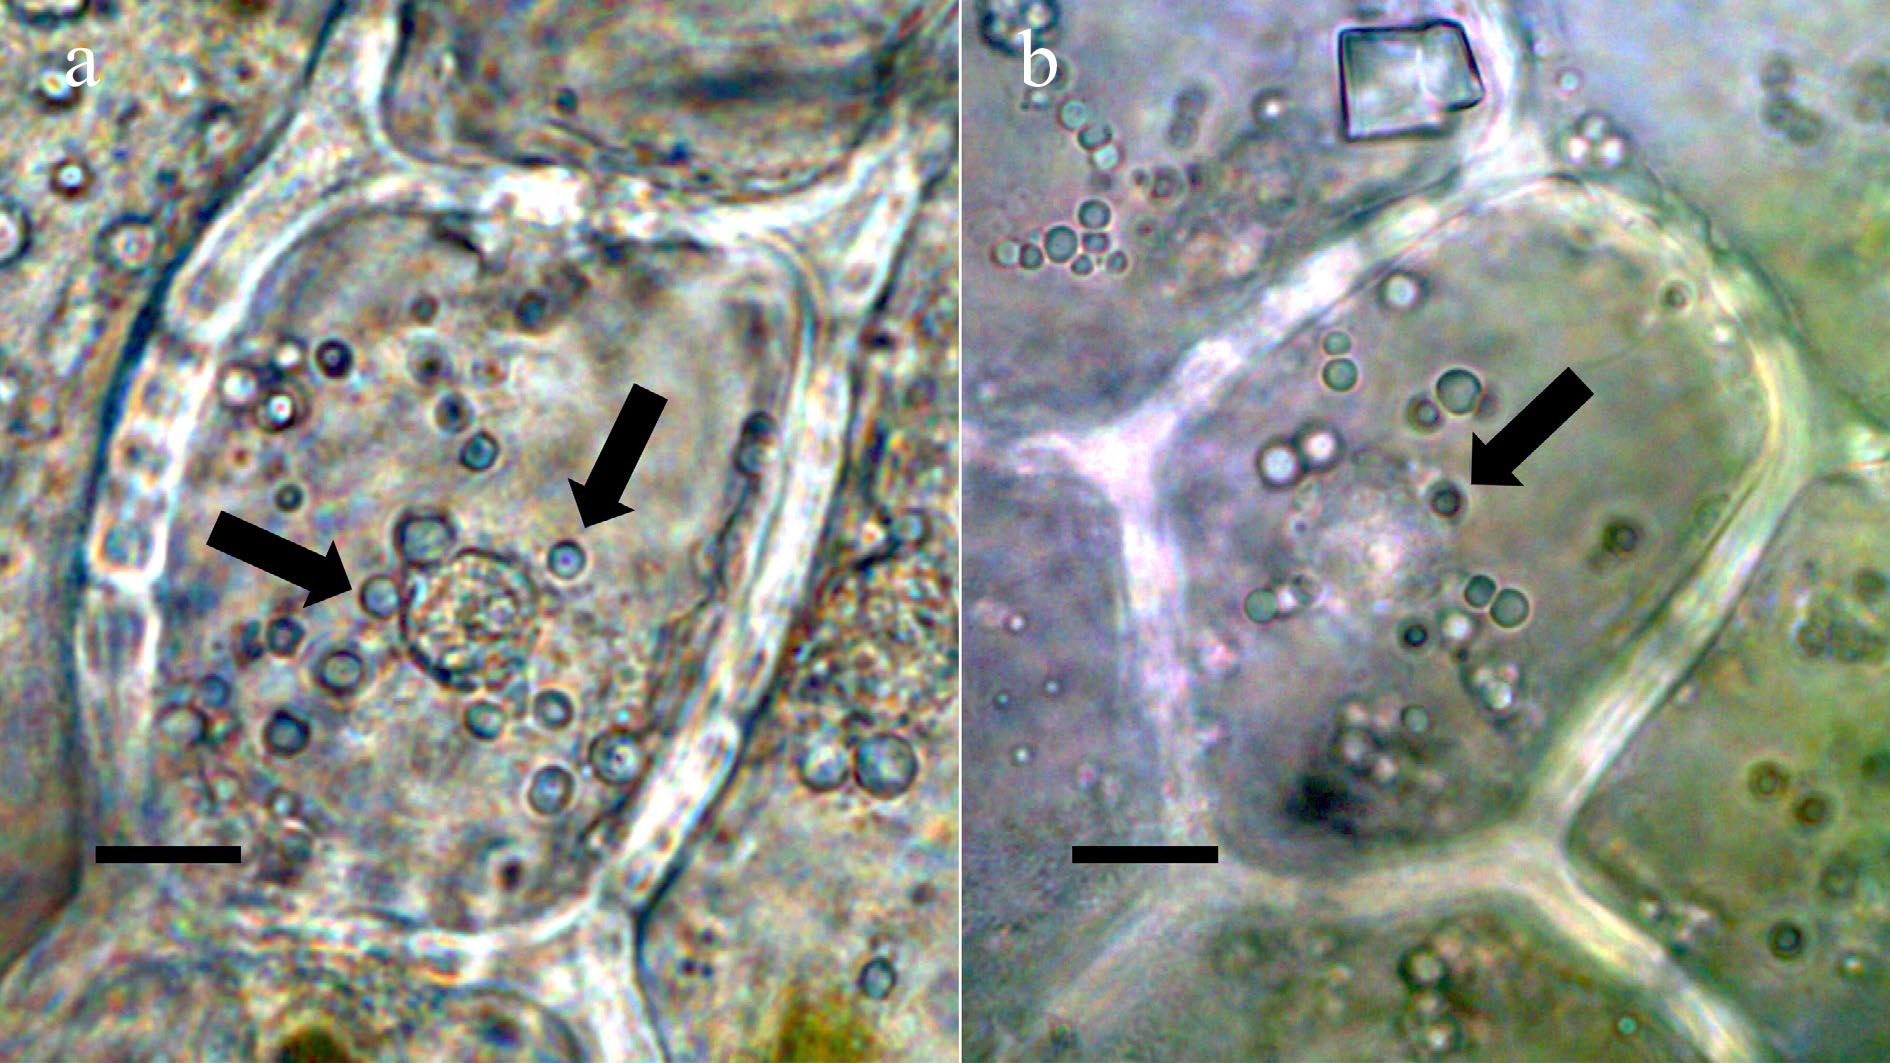
Figure 7.
Oblong-leaved vanilla (Vanilla phaeantha; Orchidaceae) showing bacteria within nucleus and emergence from nuclei[10]. (a) Nucleus stained with acidified diphenylamine to show nitrate (blue-purple color) (bar = 10 µm). (b) Nucleus stained with nitro blue tetrazolium to show superoxide (blue color) around bacteria (arrows) in cytoplasm (bar = 10 µm).
-
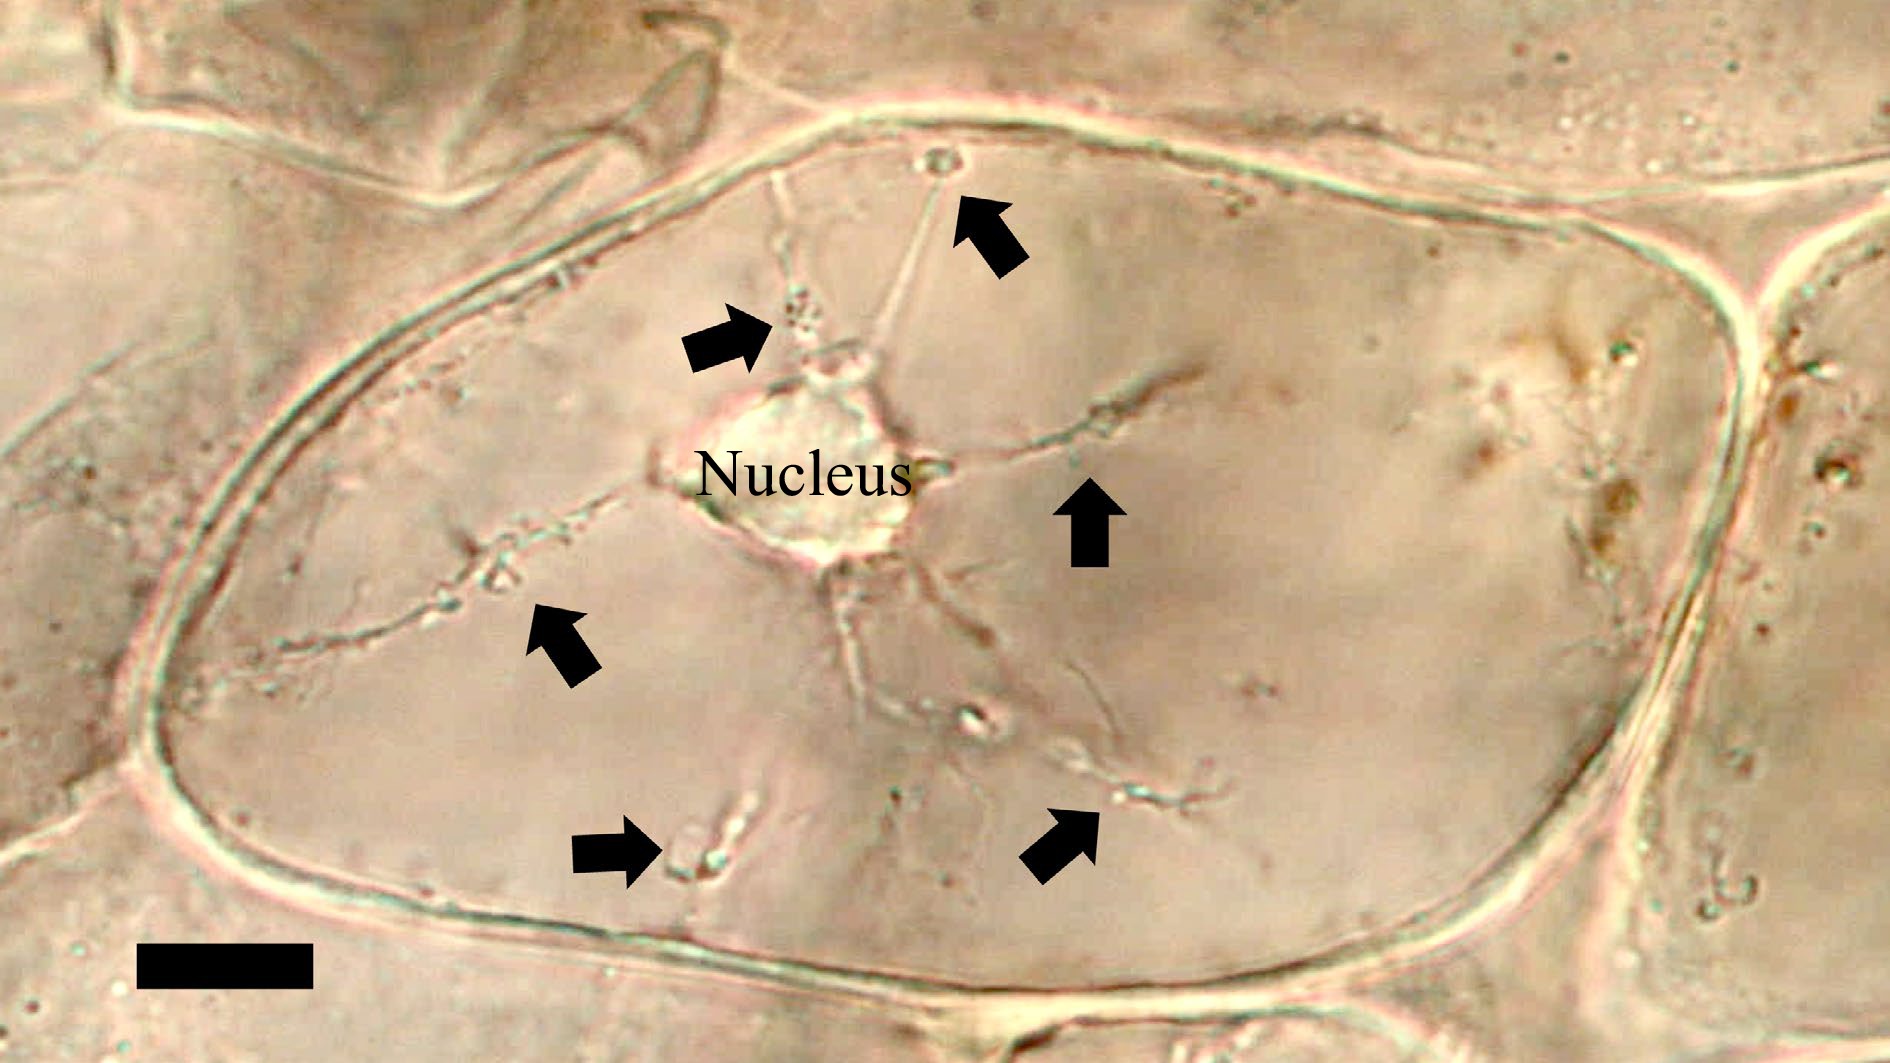
Figure 8.
Bacterial tracks (arrows) from nucleus through cytoplasm to periplasmic space of mint (Mentha sp.; Lamiaceae) (bar = 15 µm).
Figures
(8)
Tables
(0)