-
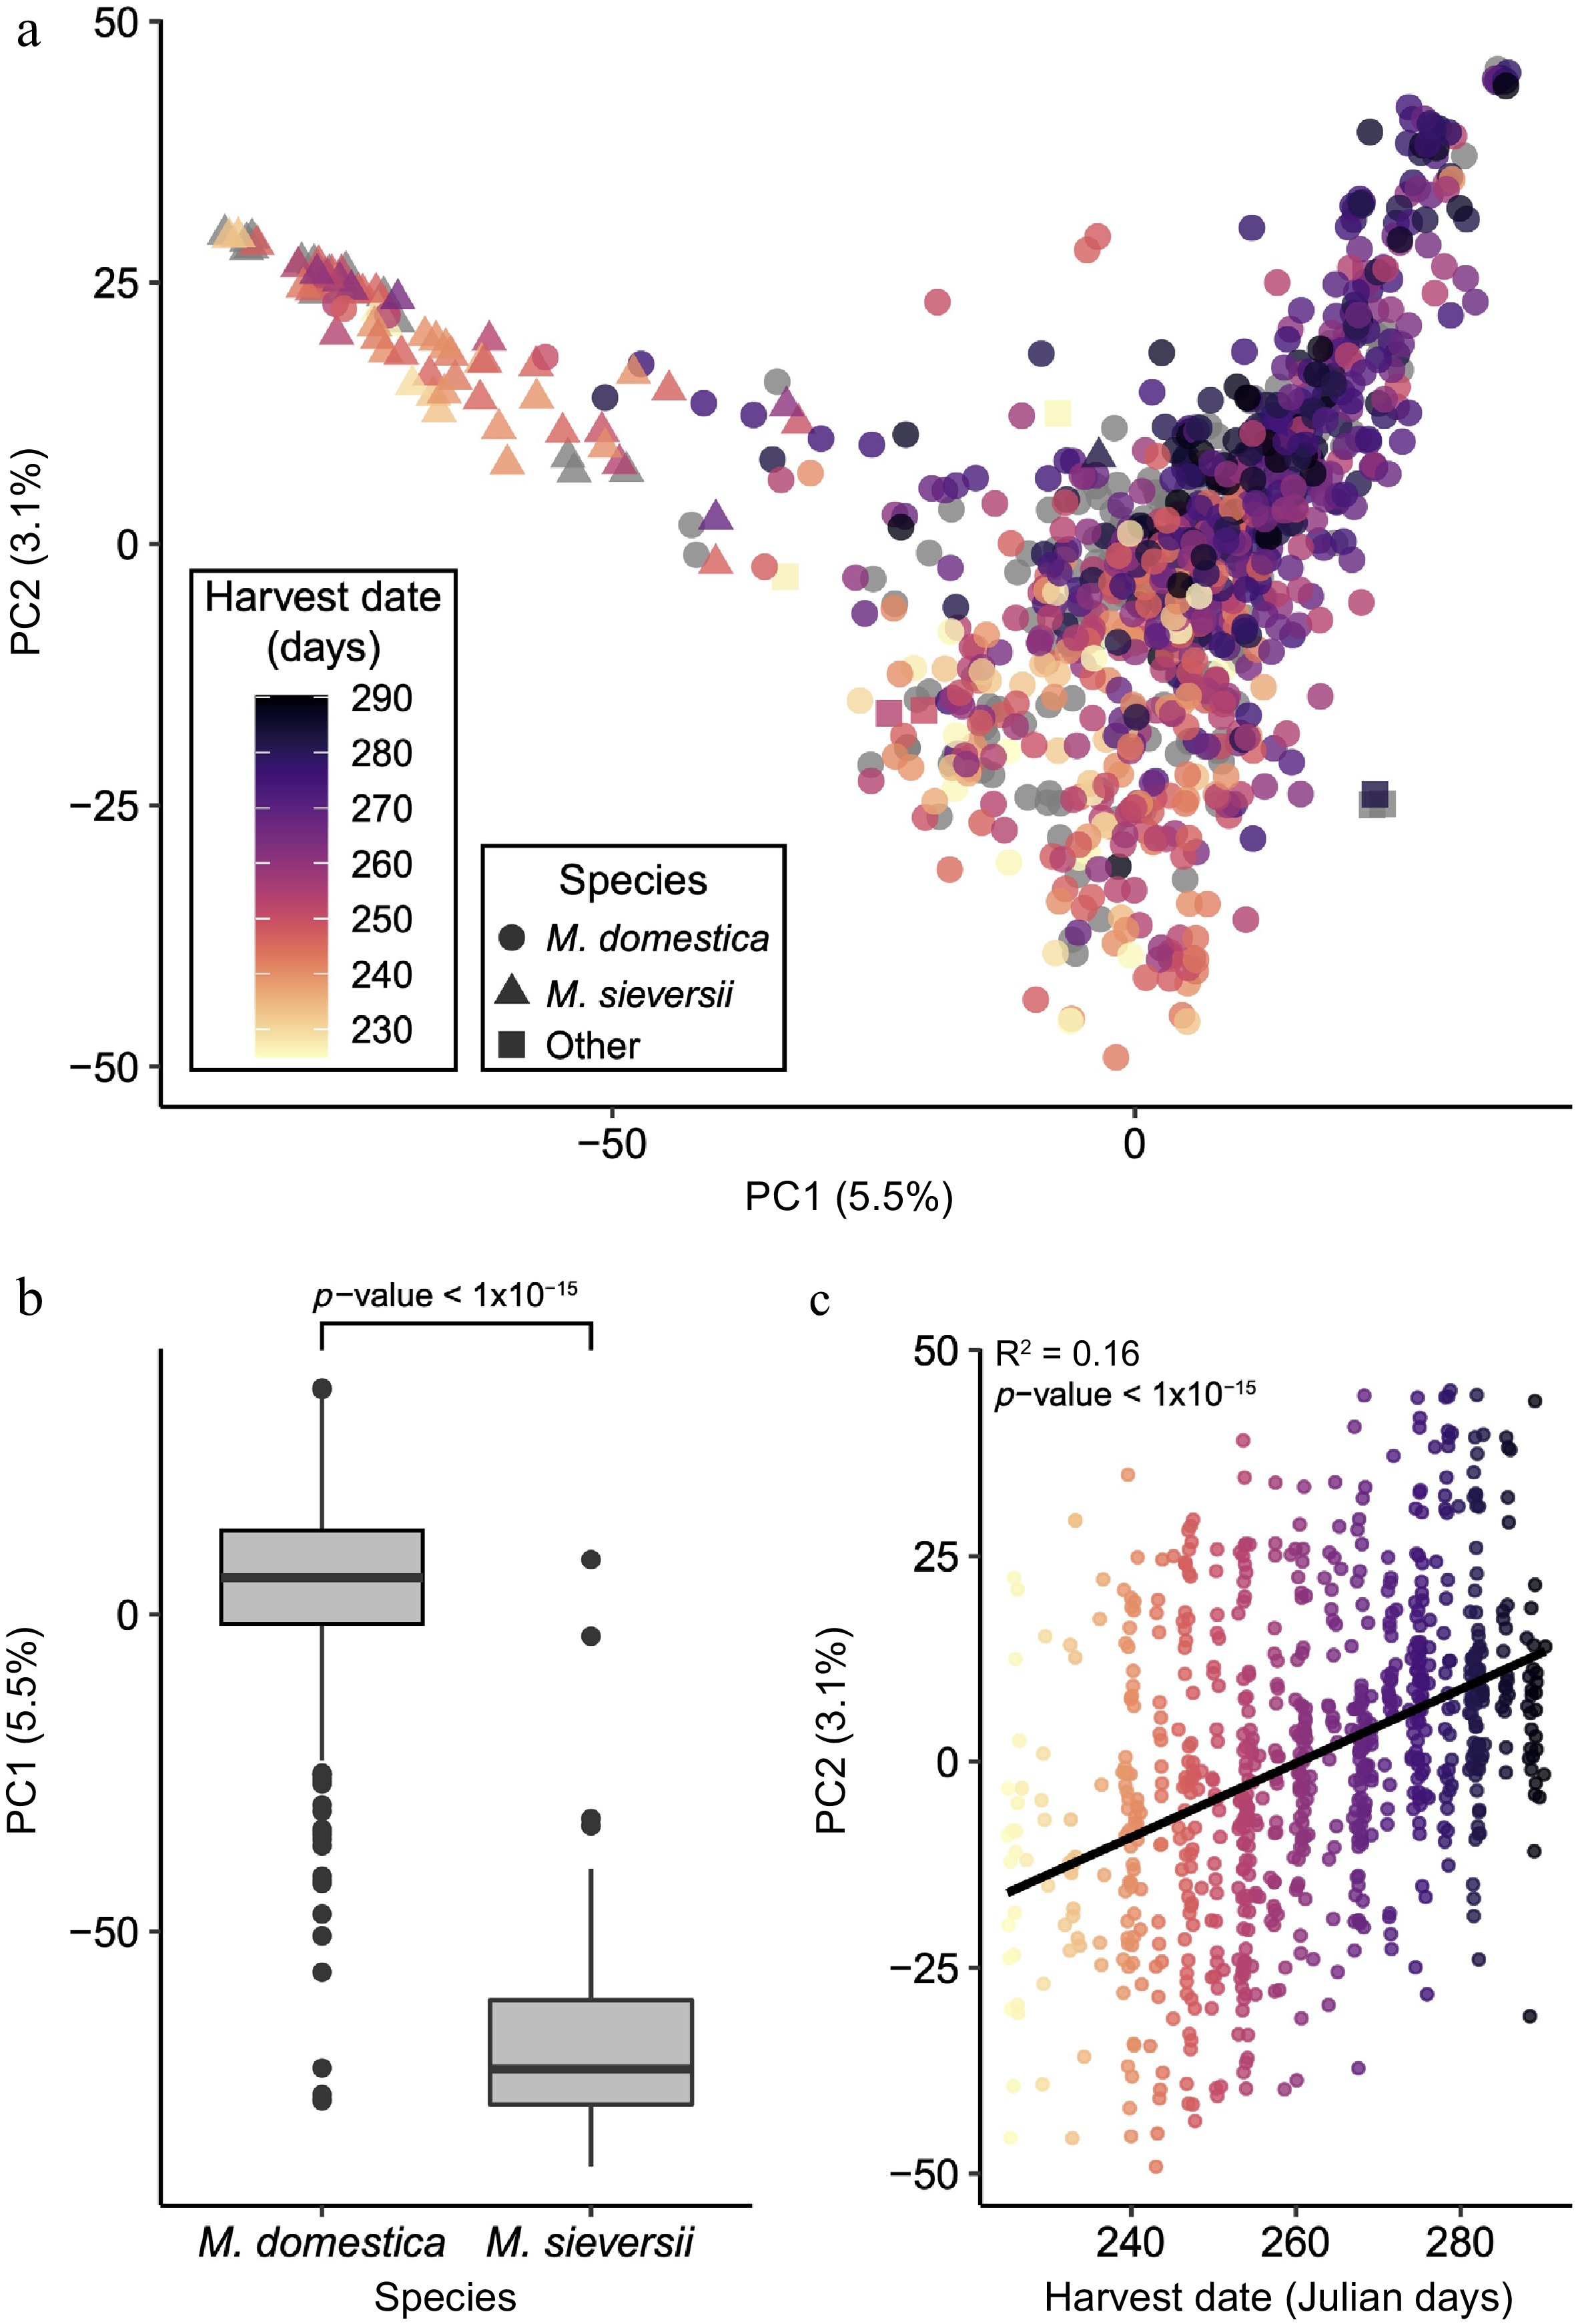
Figure 1.
Population genomic analysis of 1,054 diverse apple accessions. (a) Principal components analysis of genome-wide SNP data, with accessions coloured by harvest date and with shape representing species. (b) Boxplot of the PC1 values between M. sieversii and M. domestica. (c) Pearson correlation of PC 2 values with harvest date.
-
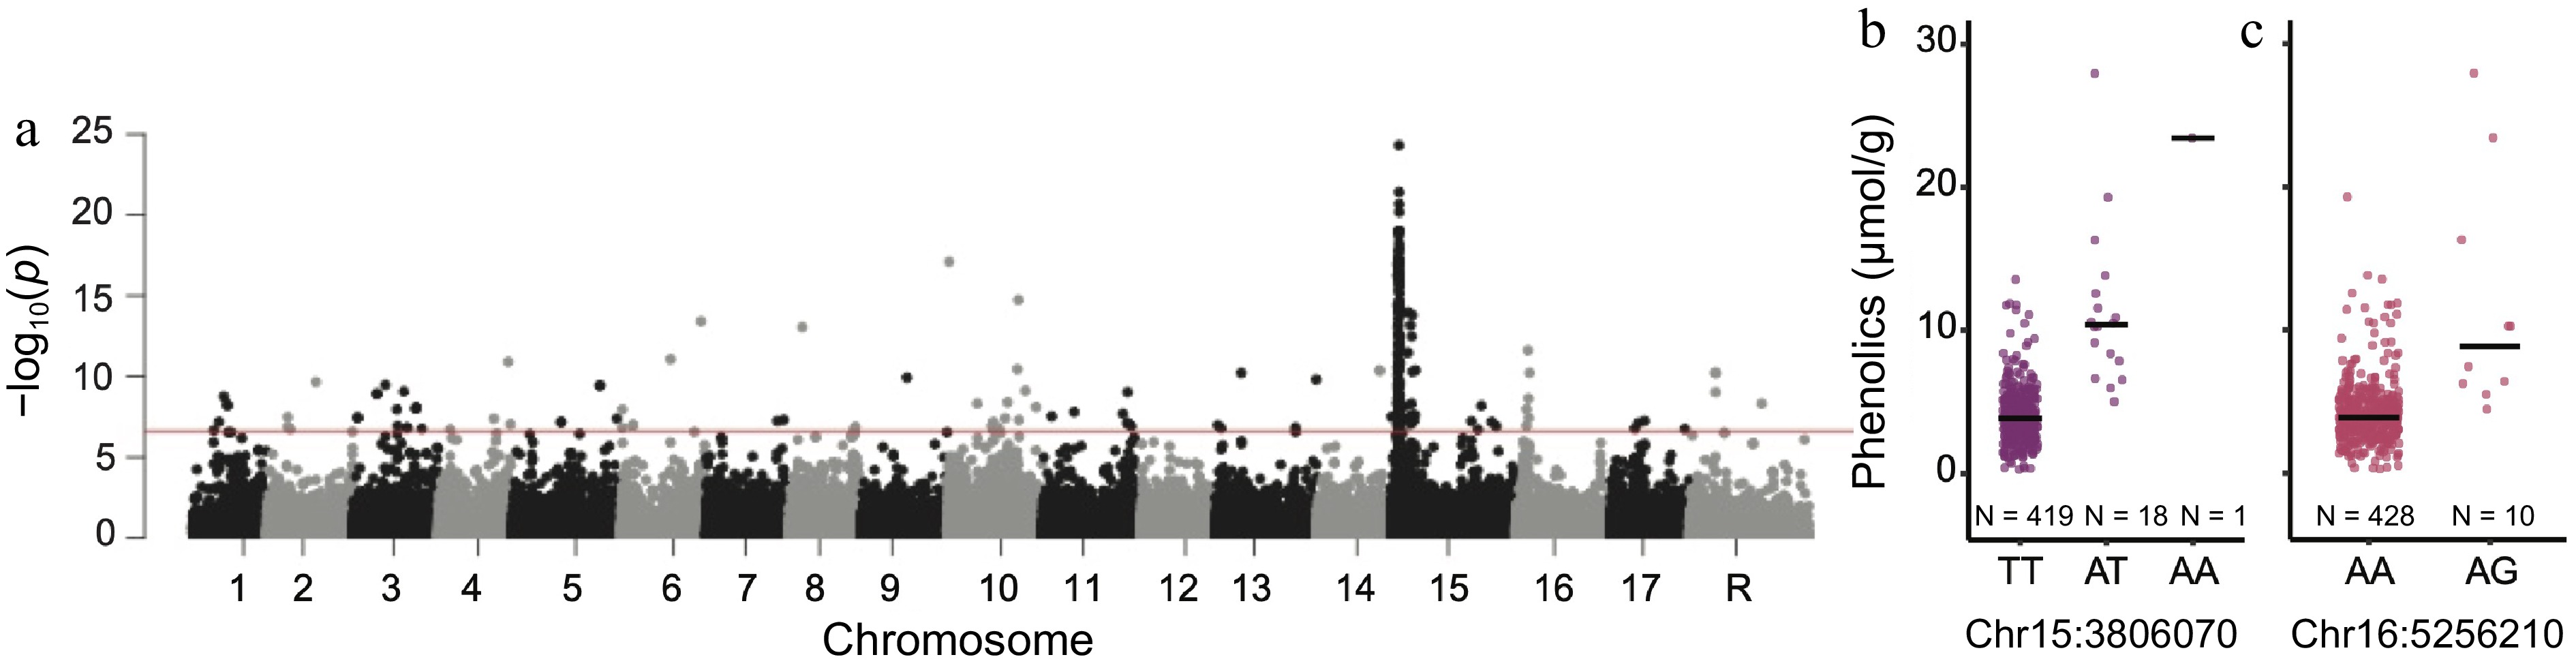
Figure 2.
Genome-wide association study for phenolic content. (a) Manhattan plot of GWAS results for phenolic content. The horizontal red line represents the significance threshold. Boxplot of the distribution of phenolic content measurements across the genotypes of the top SNPs on chromosomes (b) 15 and (c) 16, with a black line indicating the median phenolic content measurement for each genotype.
-
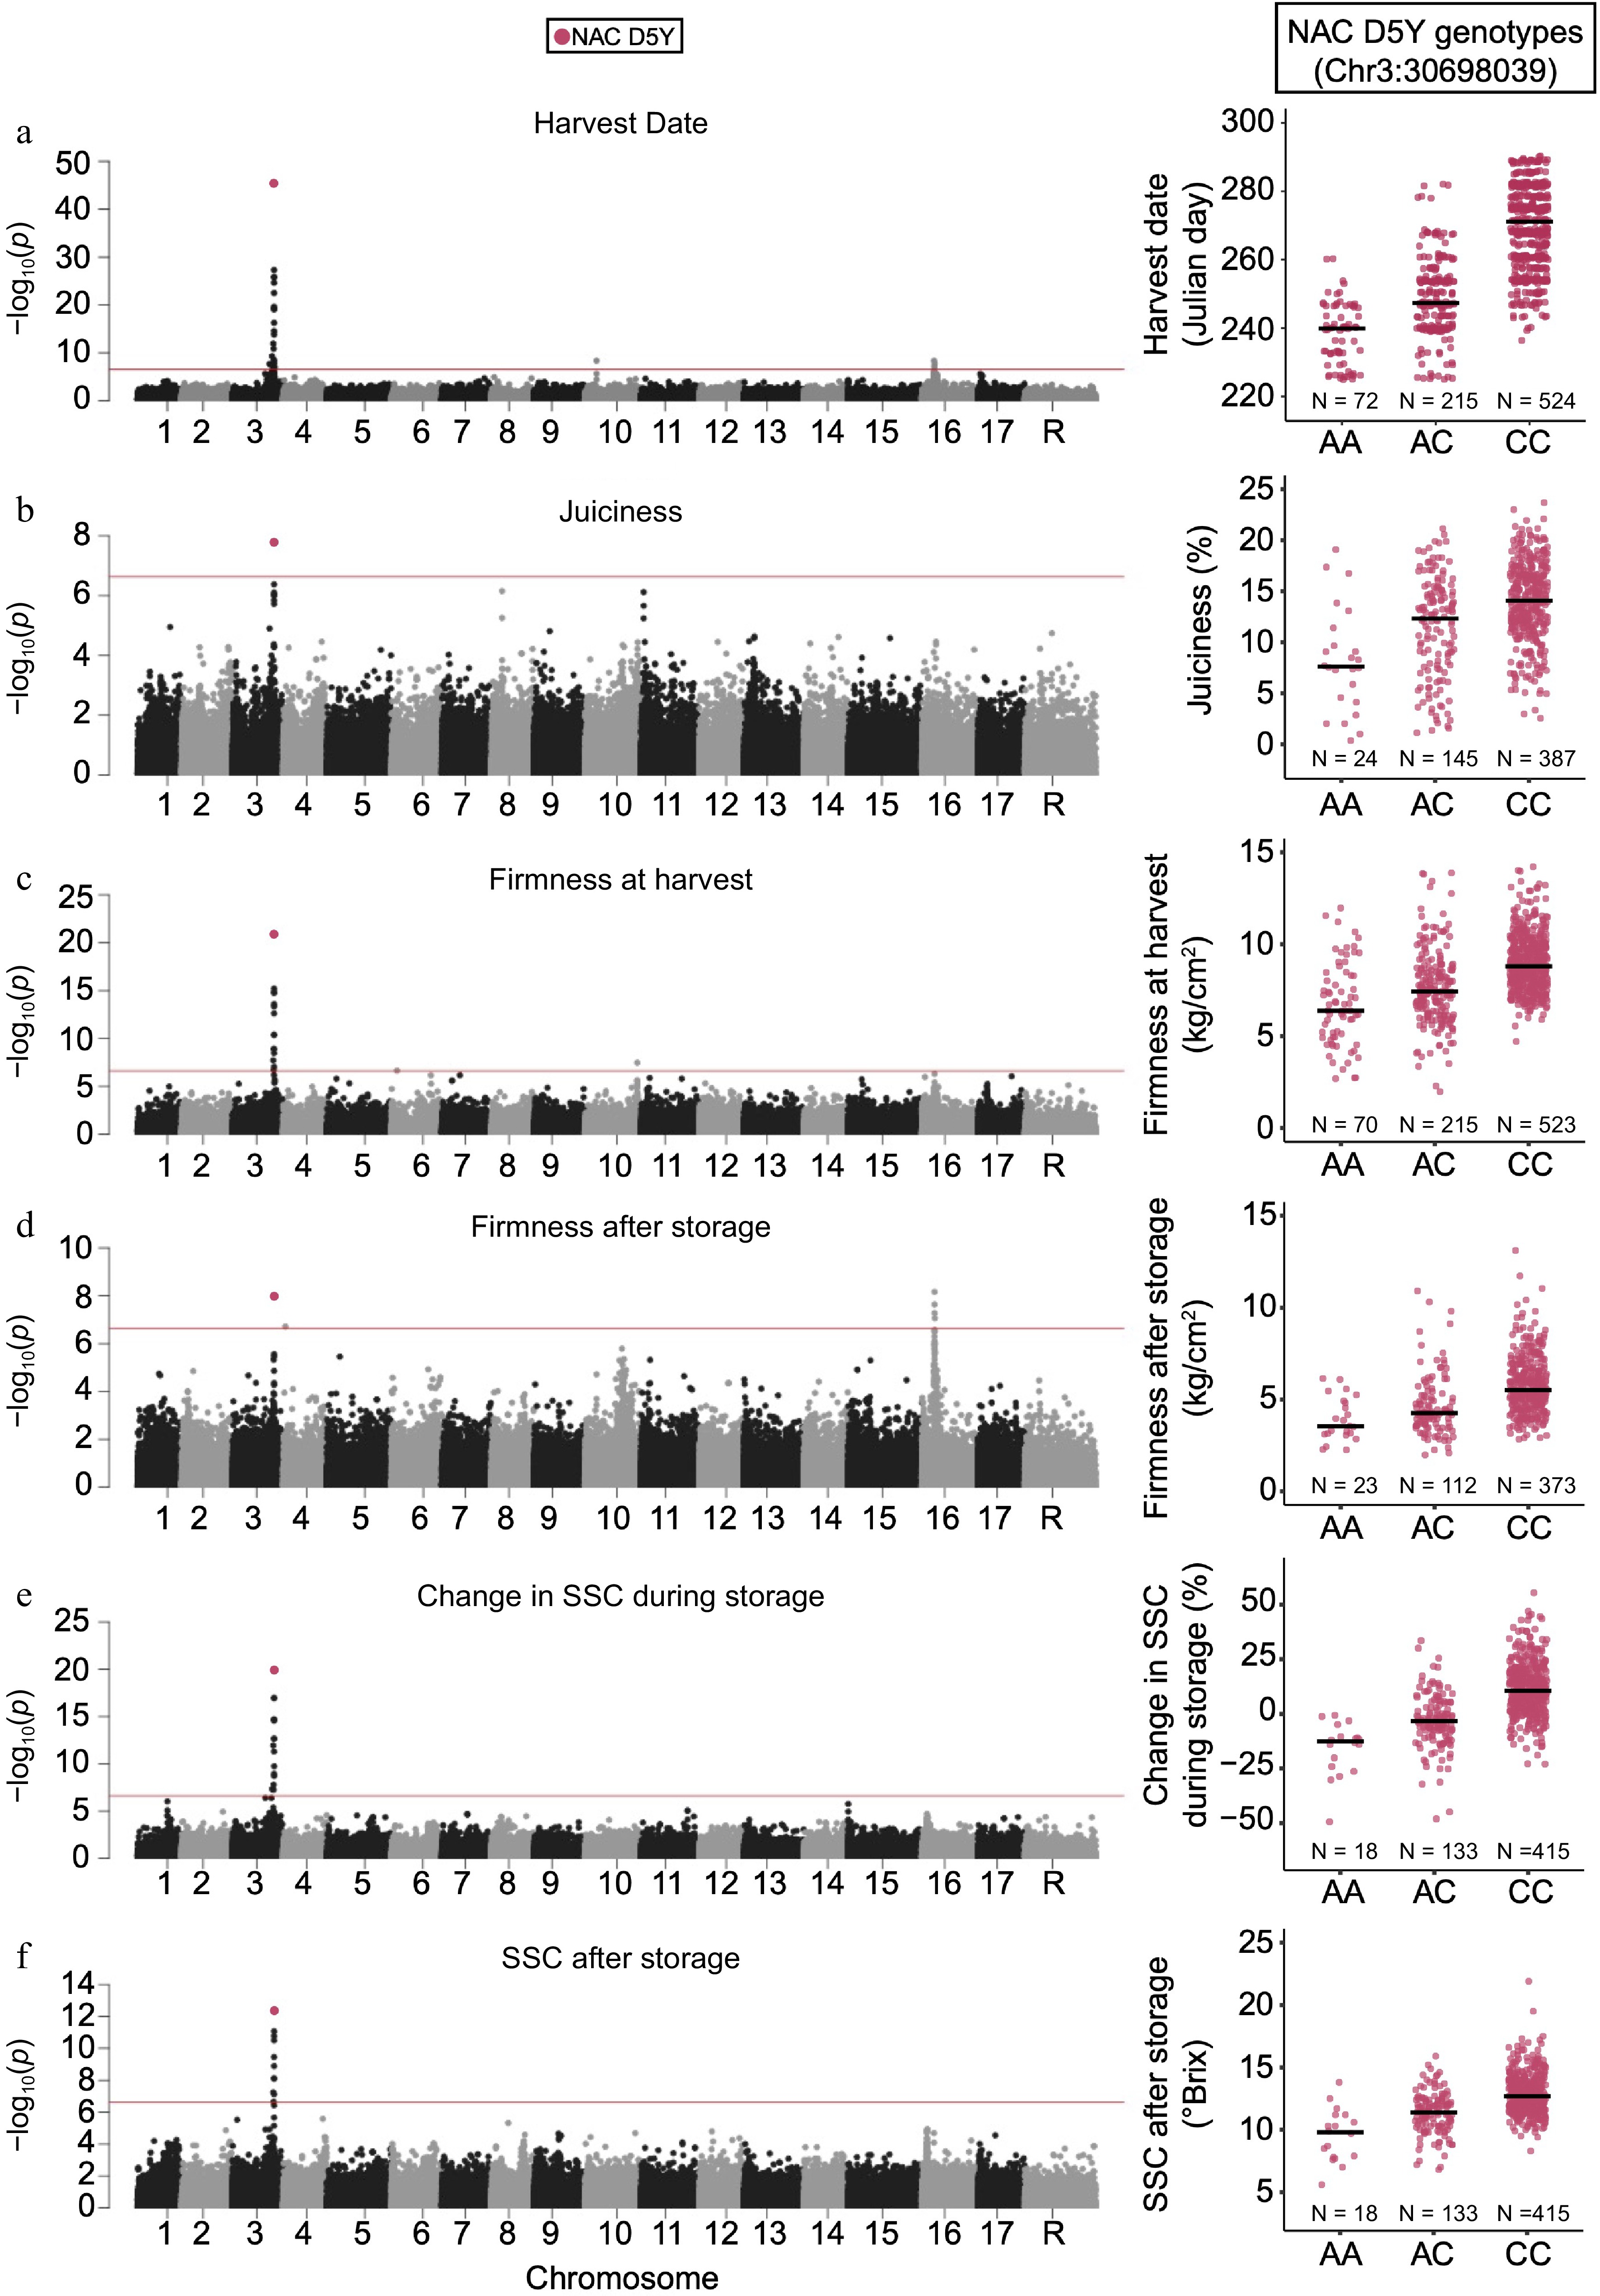
Figure 3.
Genome-wide association studies of ripening related traits. Manhattan plots of GWAS results for (a) harvest date, (b) juiciness, (c) firmness at harvest, (d) firmness after storage, (e) change in SSC during storage and (f) SSC after storage. The horizontal red lines in each Manhattan plot represent the significance threshold. The distributions of trait measurements across the NAC18.1 D5Y genotypes are also shown adjacent to each Manhattan plot with median values for each genotype indicated by a horizontal line.
-
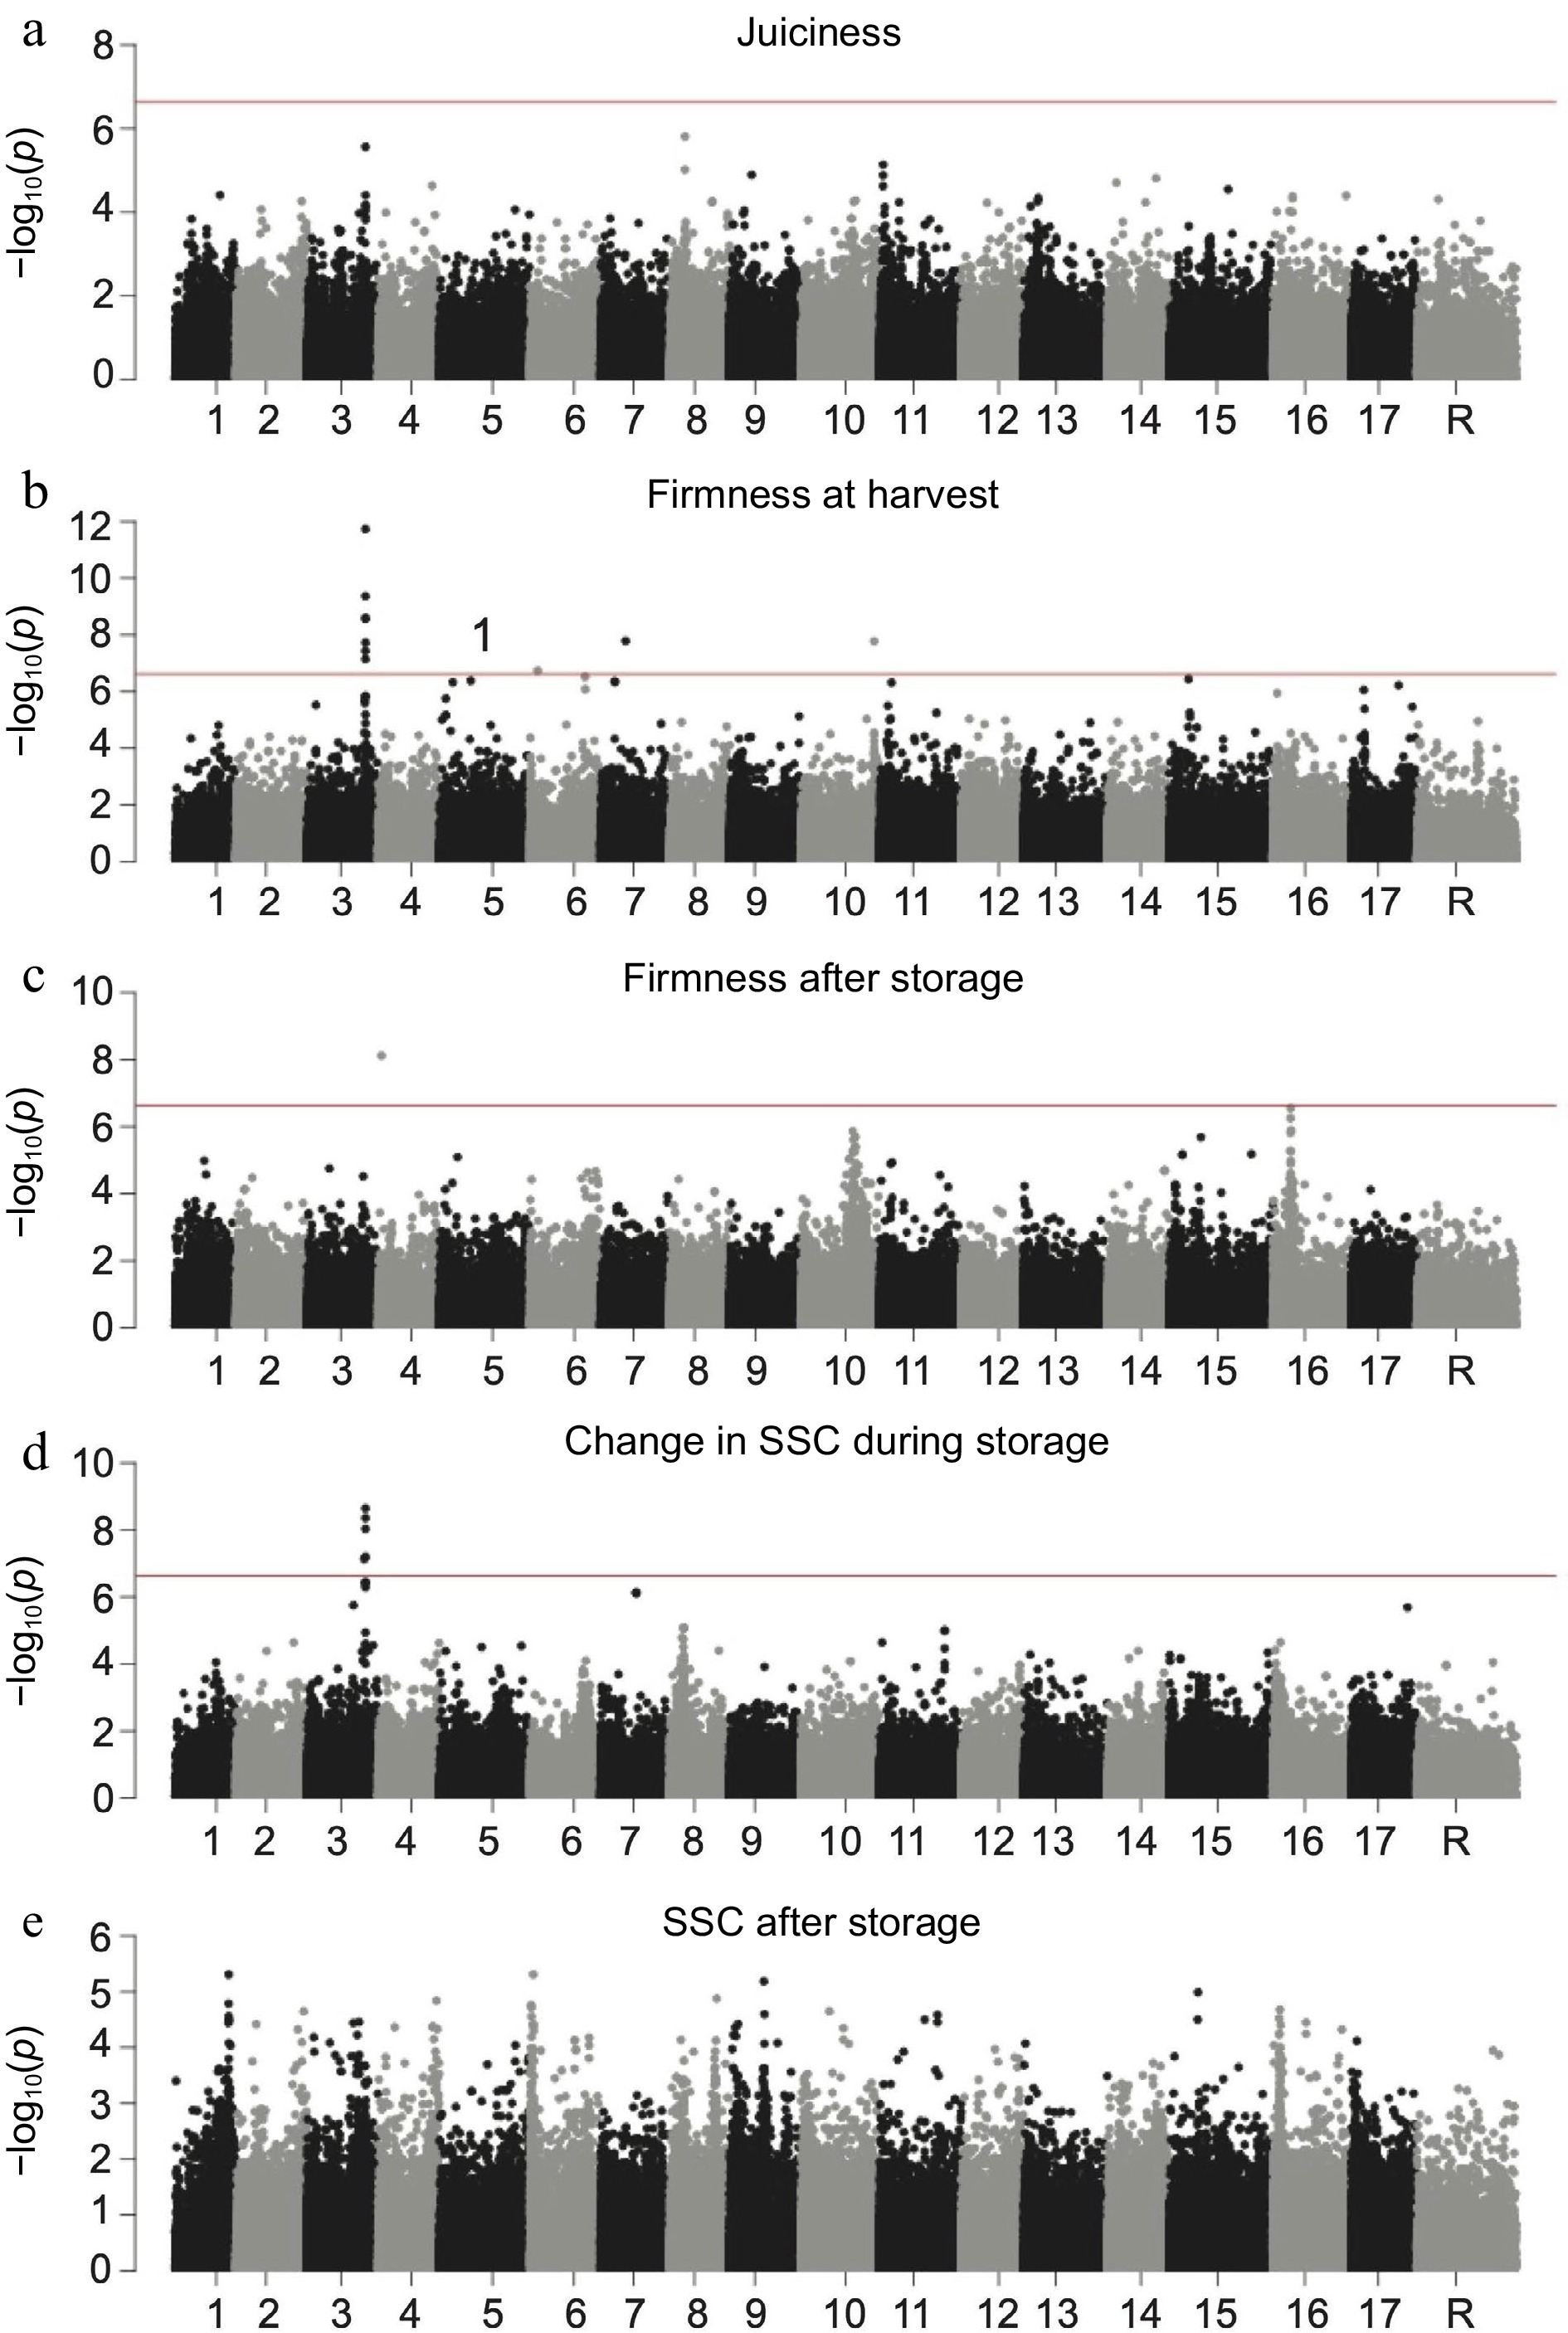
Figure 4.
Genome-wide association studies of ripening related traits with harvest include as a covariate. Manhattan plots of GWAS results for (a) juiciness, (b) firmness at harvest, (c) firmness after storage, (d) change in SSC during storage and (e) SSC after storage. The horizontal red lines in each Manhattan plot represent the significance threshold.
-
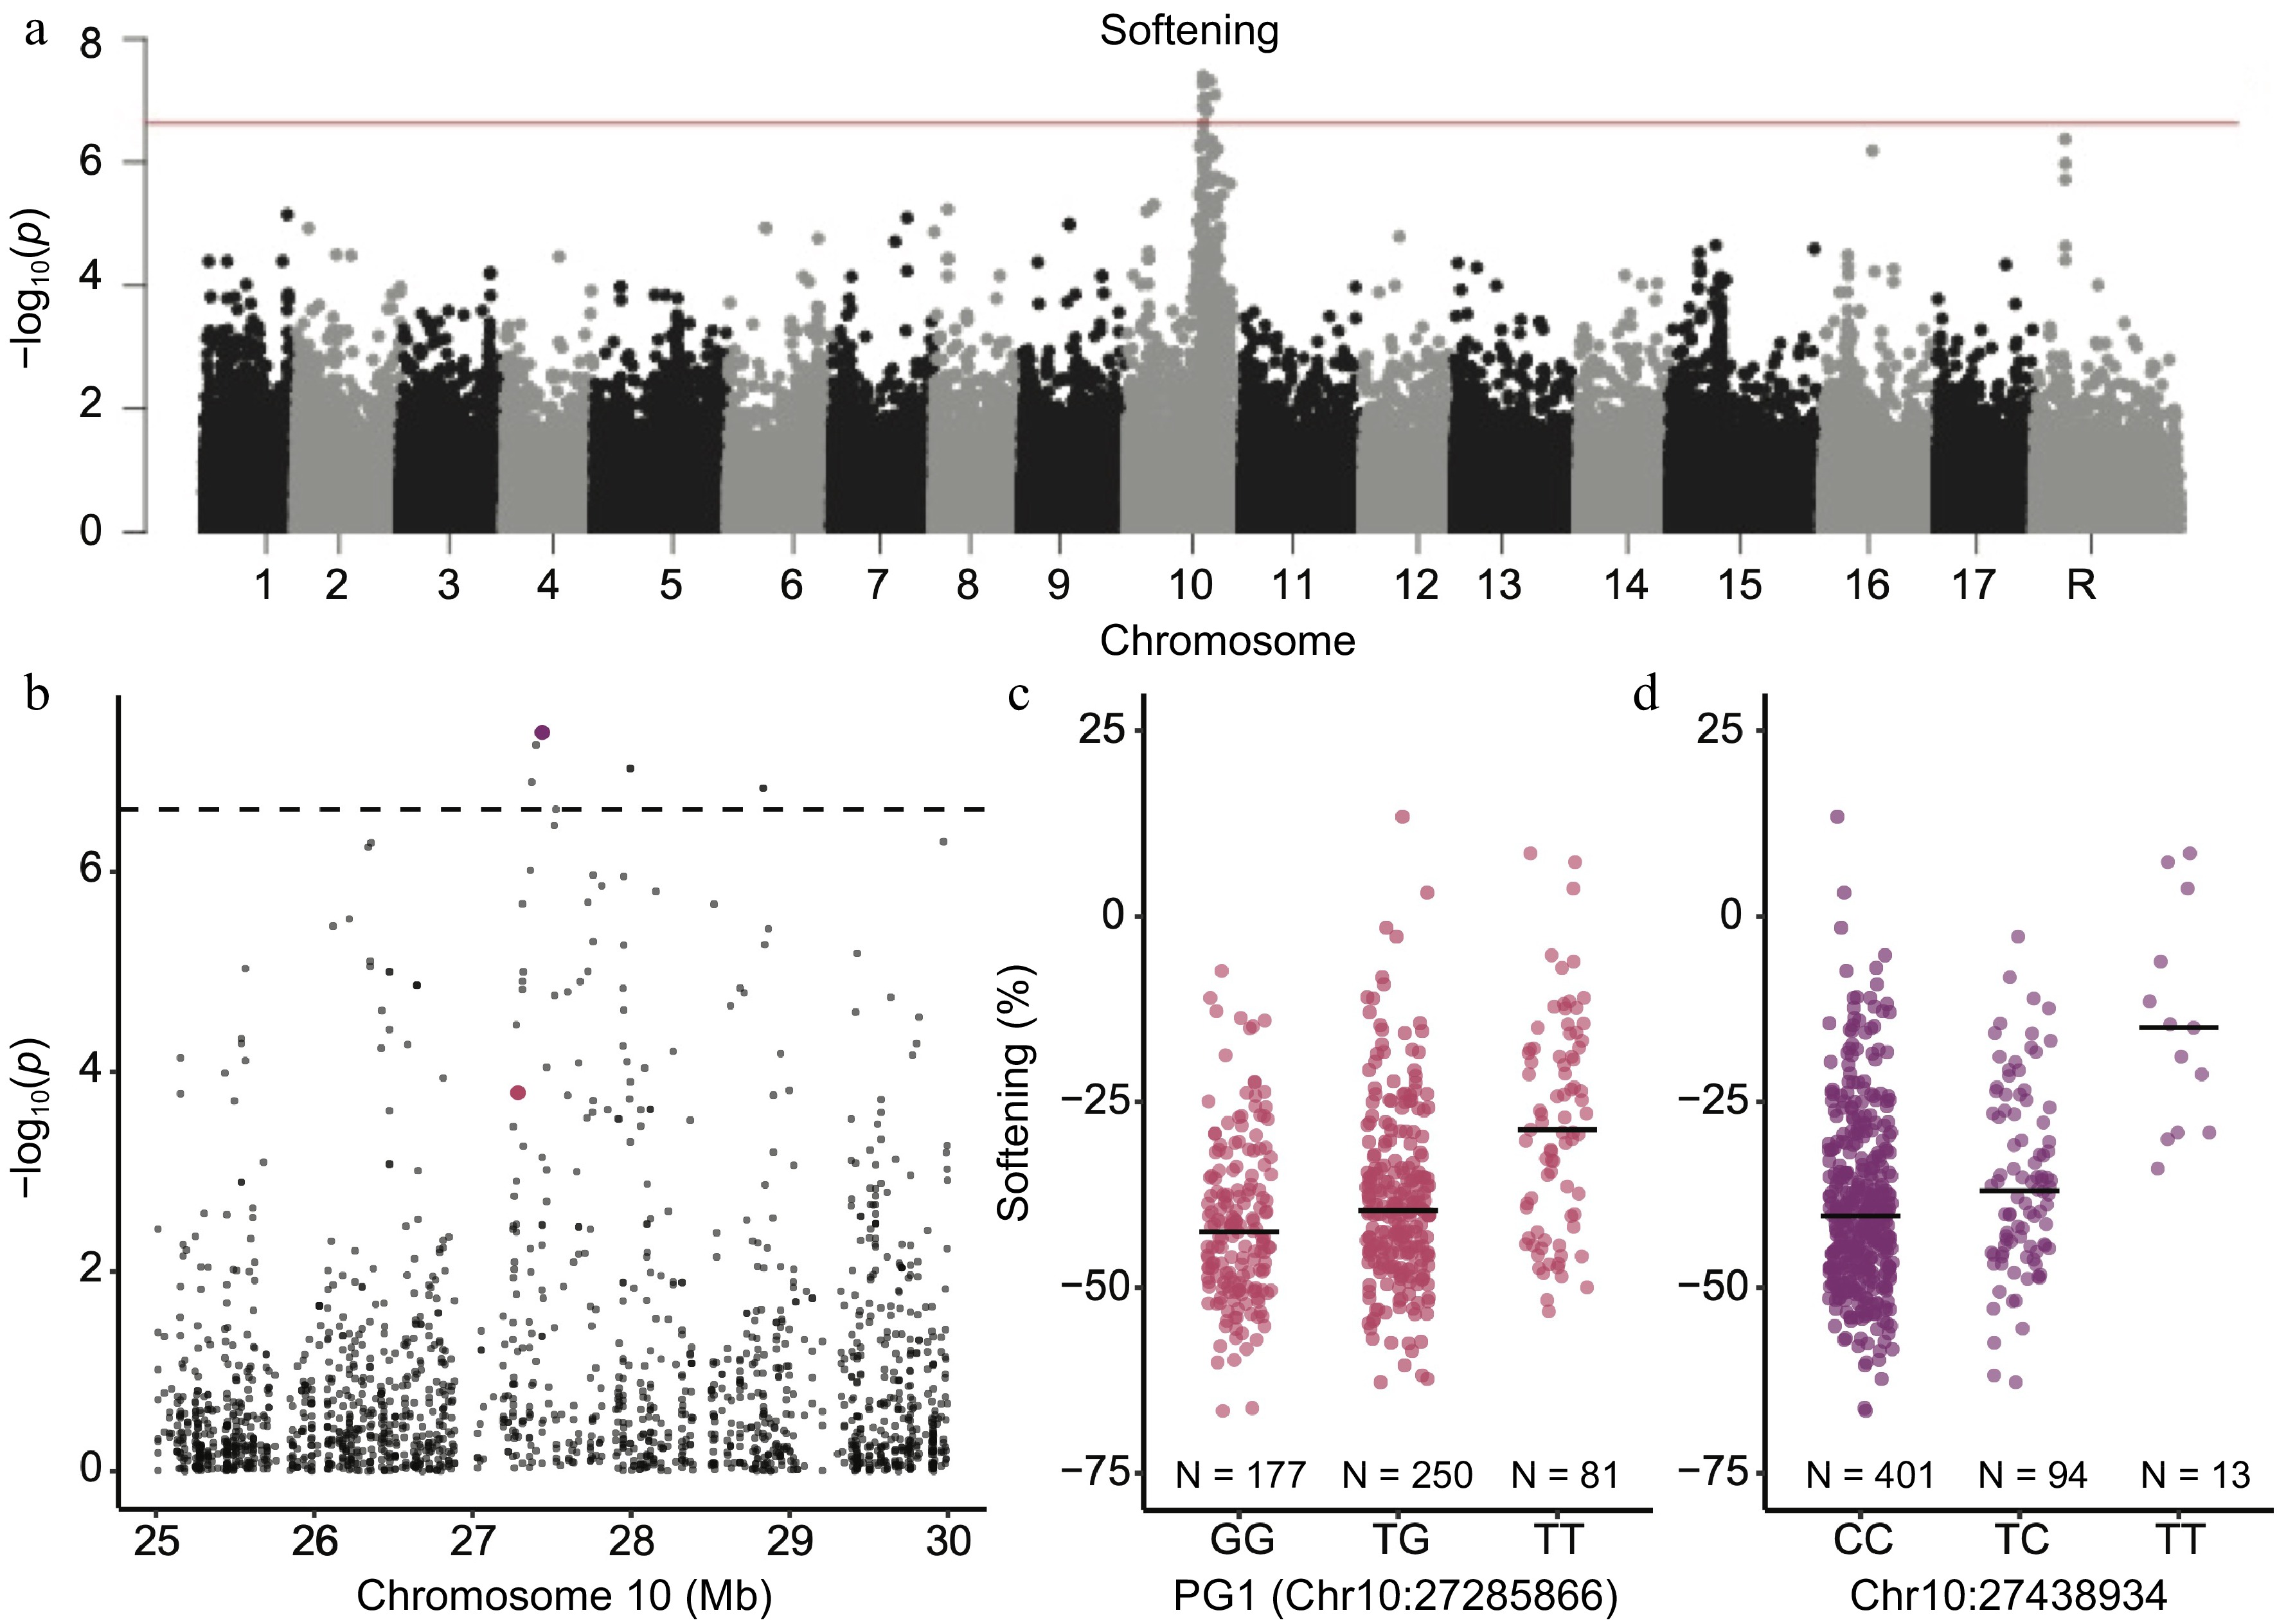
Figure 5.
Genome-wide association study for softening during storage. (a) Manhattan plot for a GWAS for softening during storage. The horizontal red line represents the significance threshold. (b) Manhattan plot showing only the genomic region around the GWAS peak from panel (a) on chromosome 10. The purple SNP is the most significant SNP associated with softening. The PG1 SNP is shown in pink. The horizontal dotted line represents the significance threshold. (c) Distributions of softening measurements across PG1 genotypes. (d) Distributions of softening measurements across genotypes of the most significant SNP from the GWAS. Horizontal black lines indicate the median value within each genotype.
-
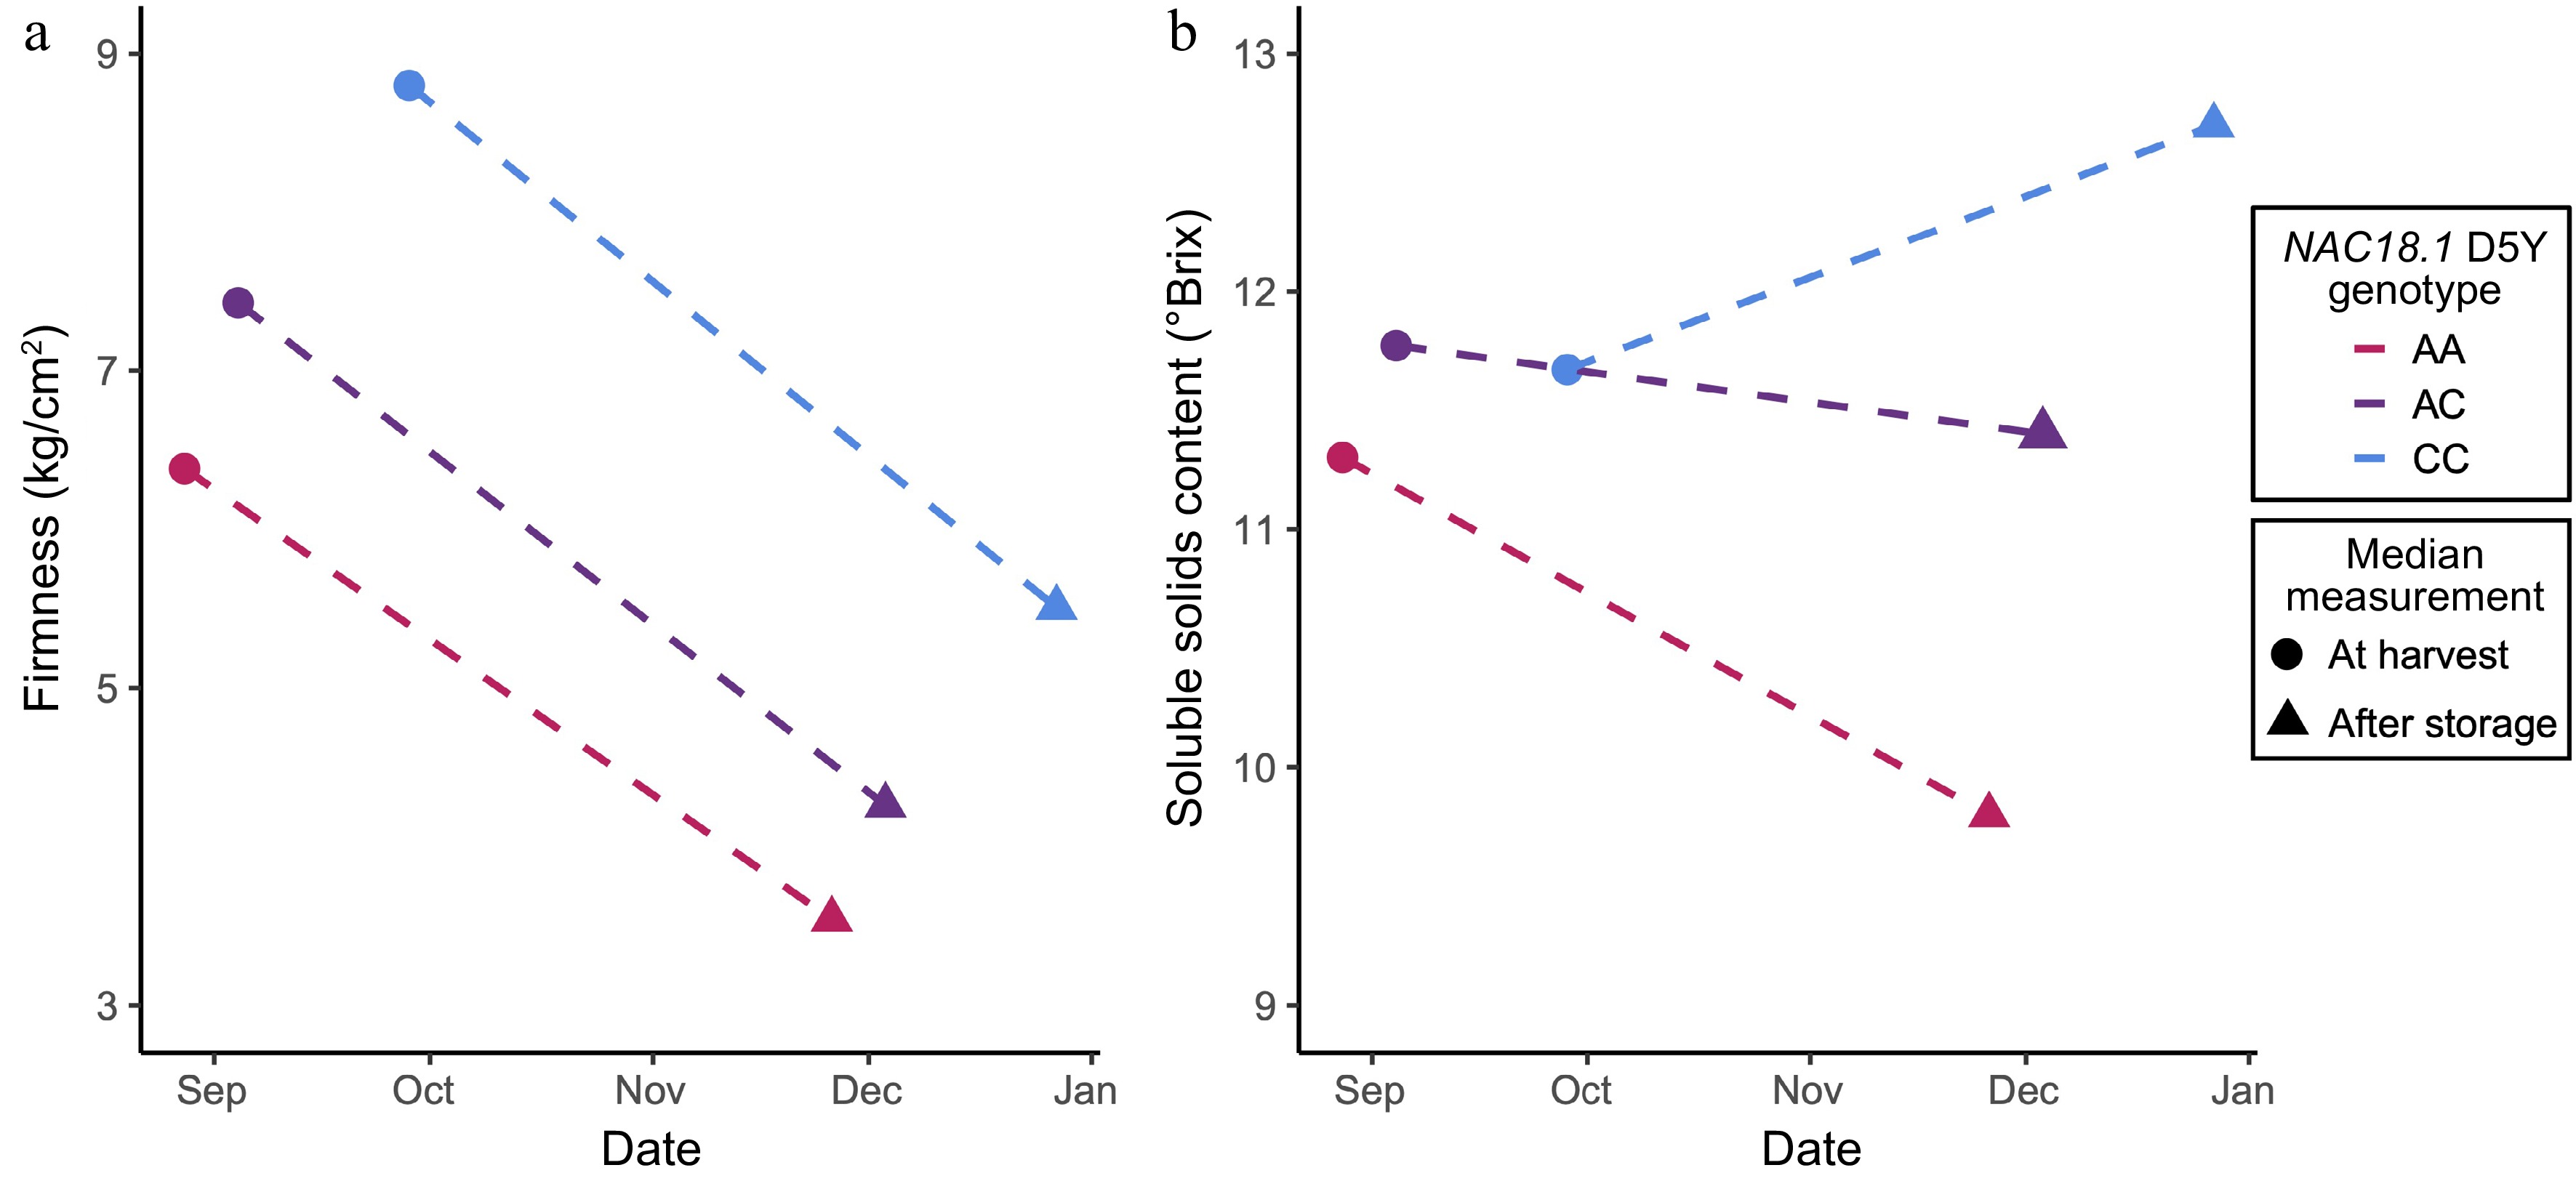
Figure 6.
A summary of the allelic effects of NAC18.1 D5Y genotypes on ripening phenotypes, both at harvest and after 3 months of cold storage. (a) Median measures of firmness at harvest and firmness after storage for apple accessions with different D5Y genotypes. (b) The median soluble solids content at harvest and after storage for apple accessions with different D5Y genotypes.
Figures
(6)
Tables
(0)