-
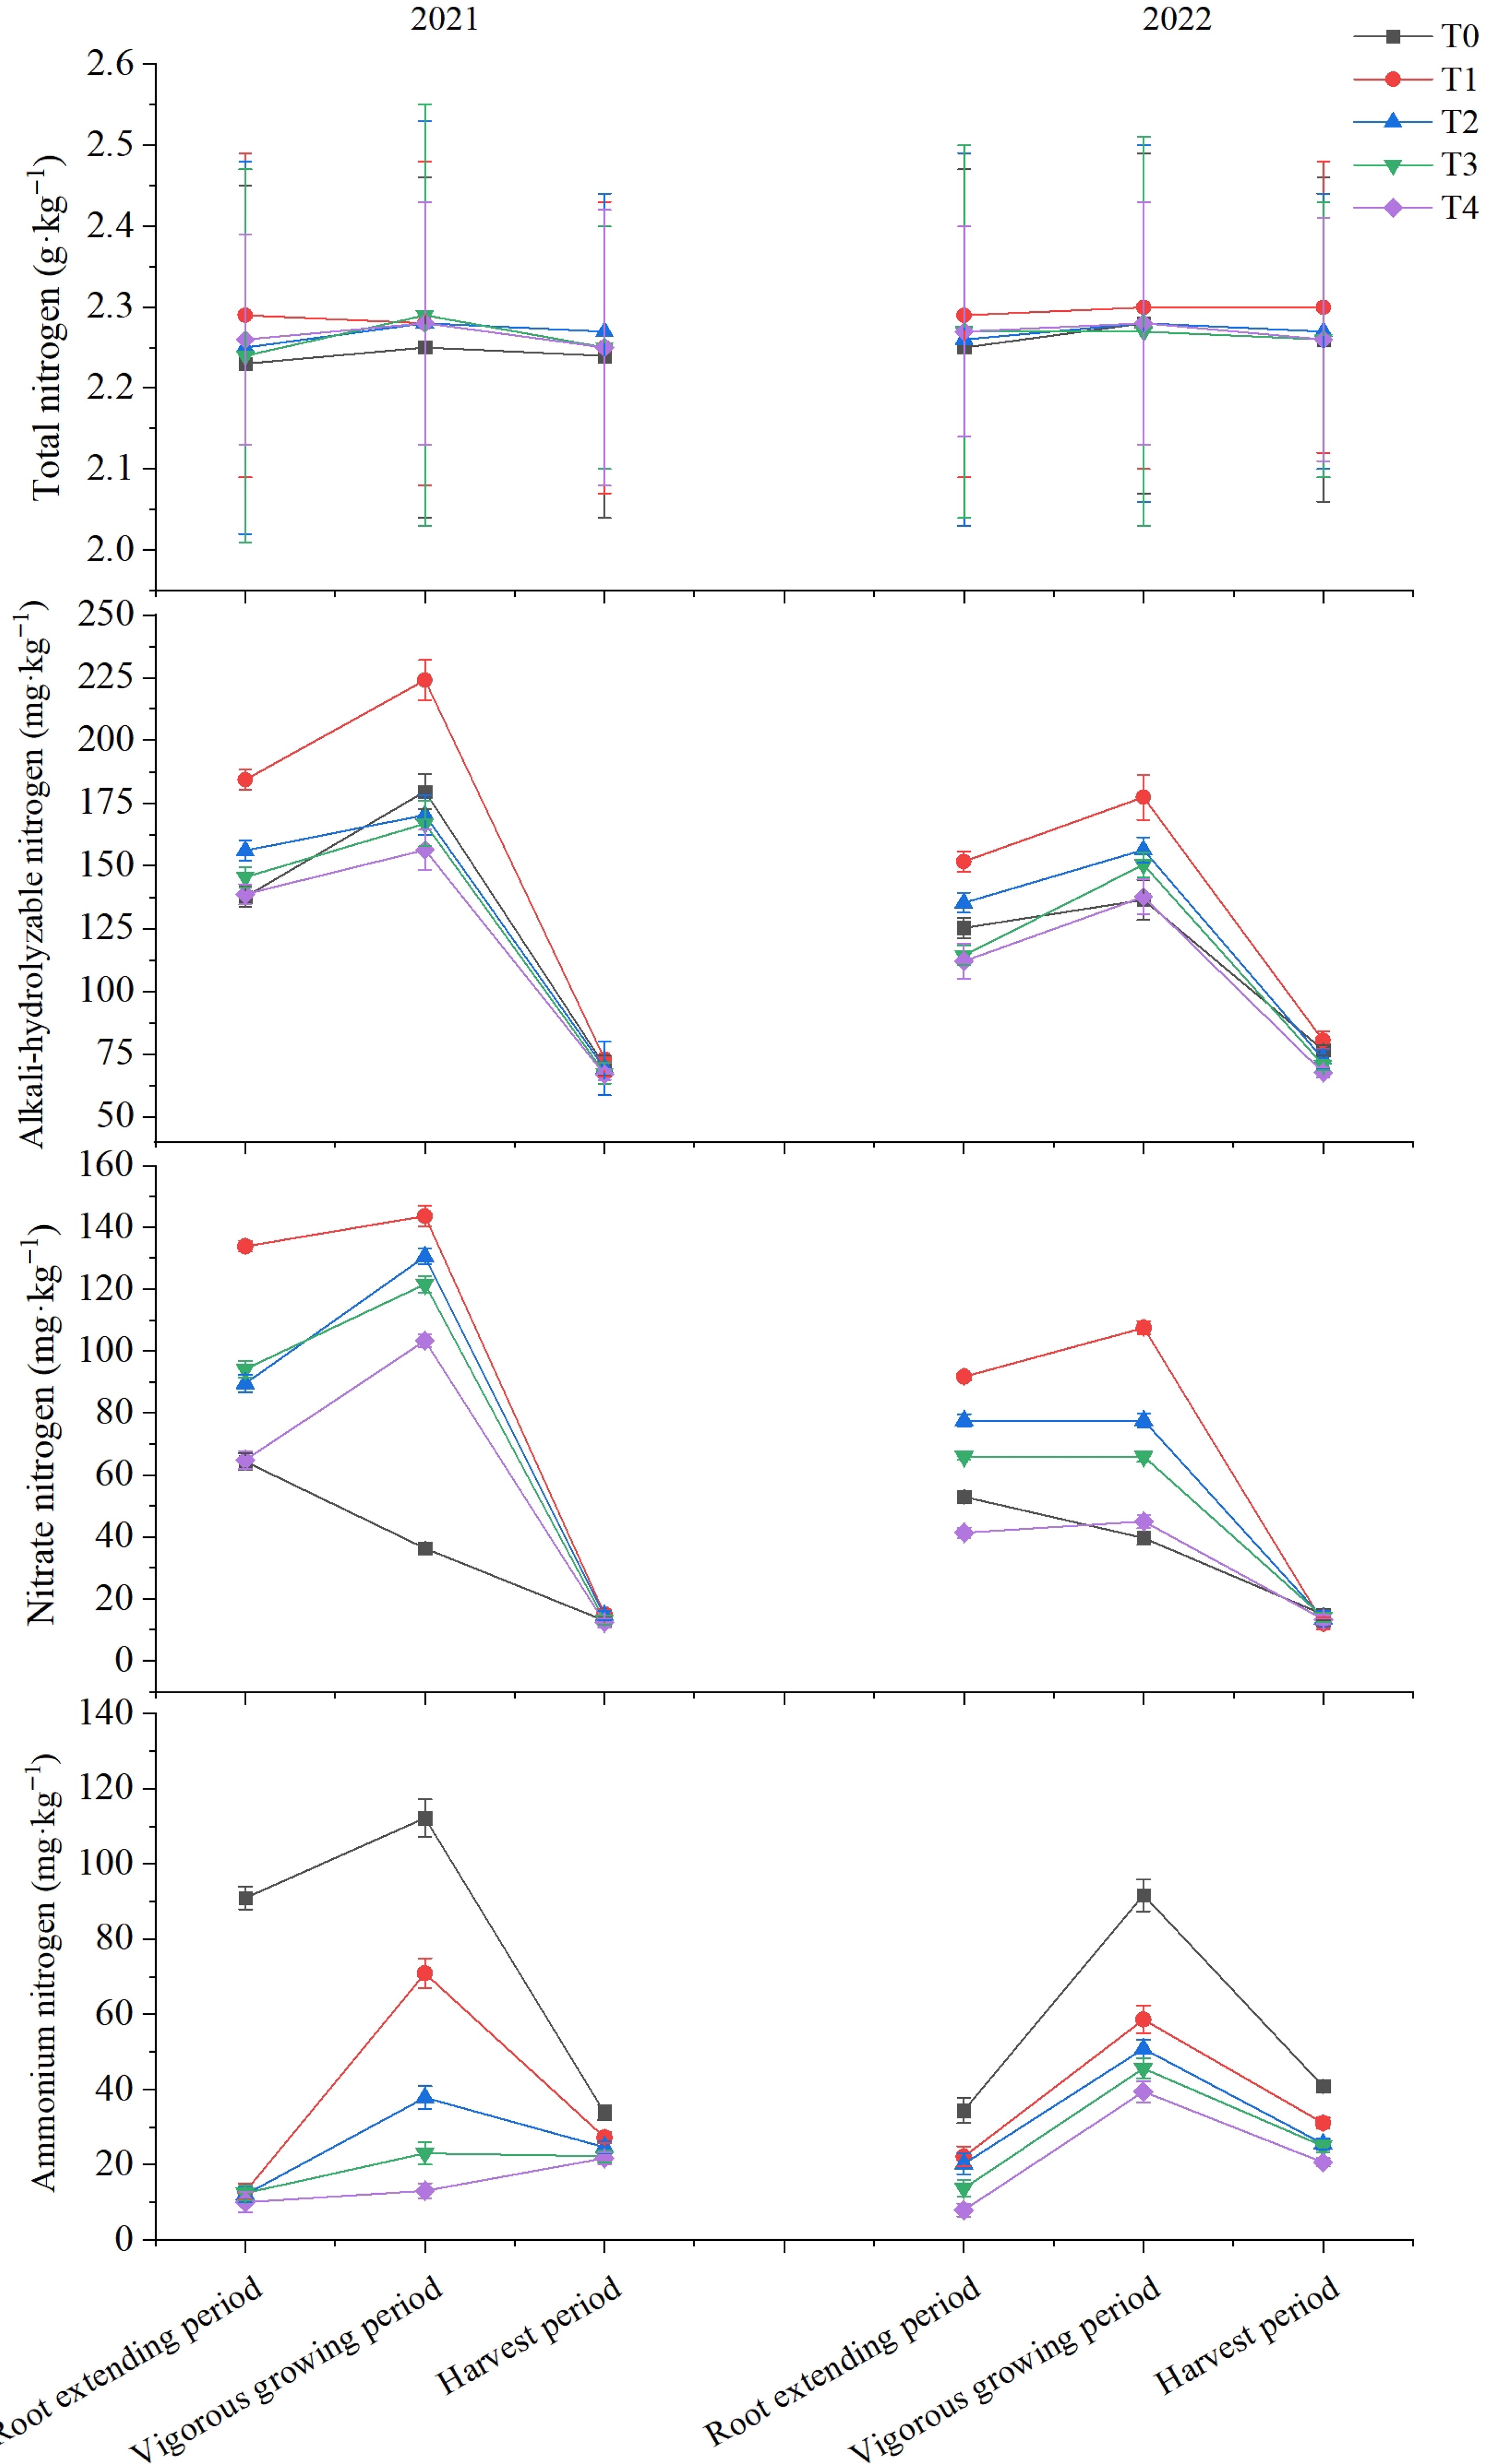
Figure 1.
Effect of reduced nitrogen fertilizer application combined with biochar on nitrogen content of different forms in flue-cured tobacco cultivated soils.
-
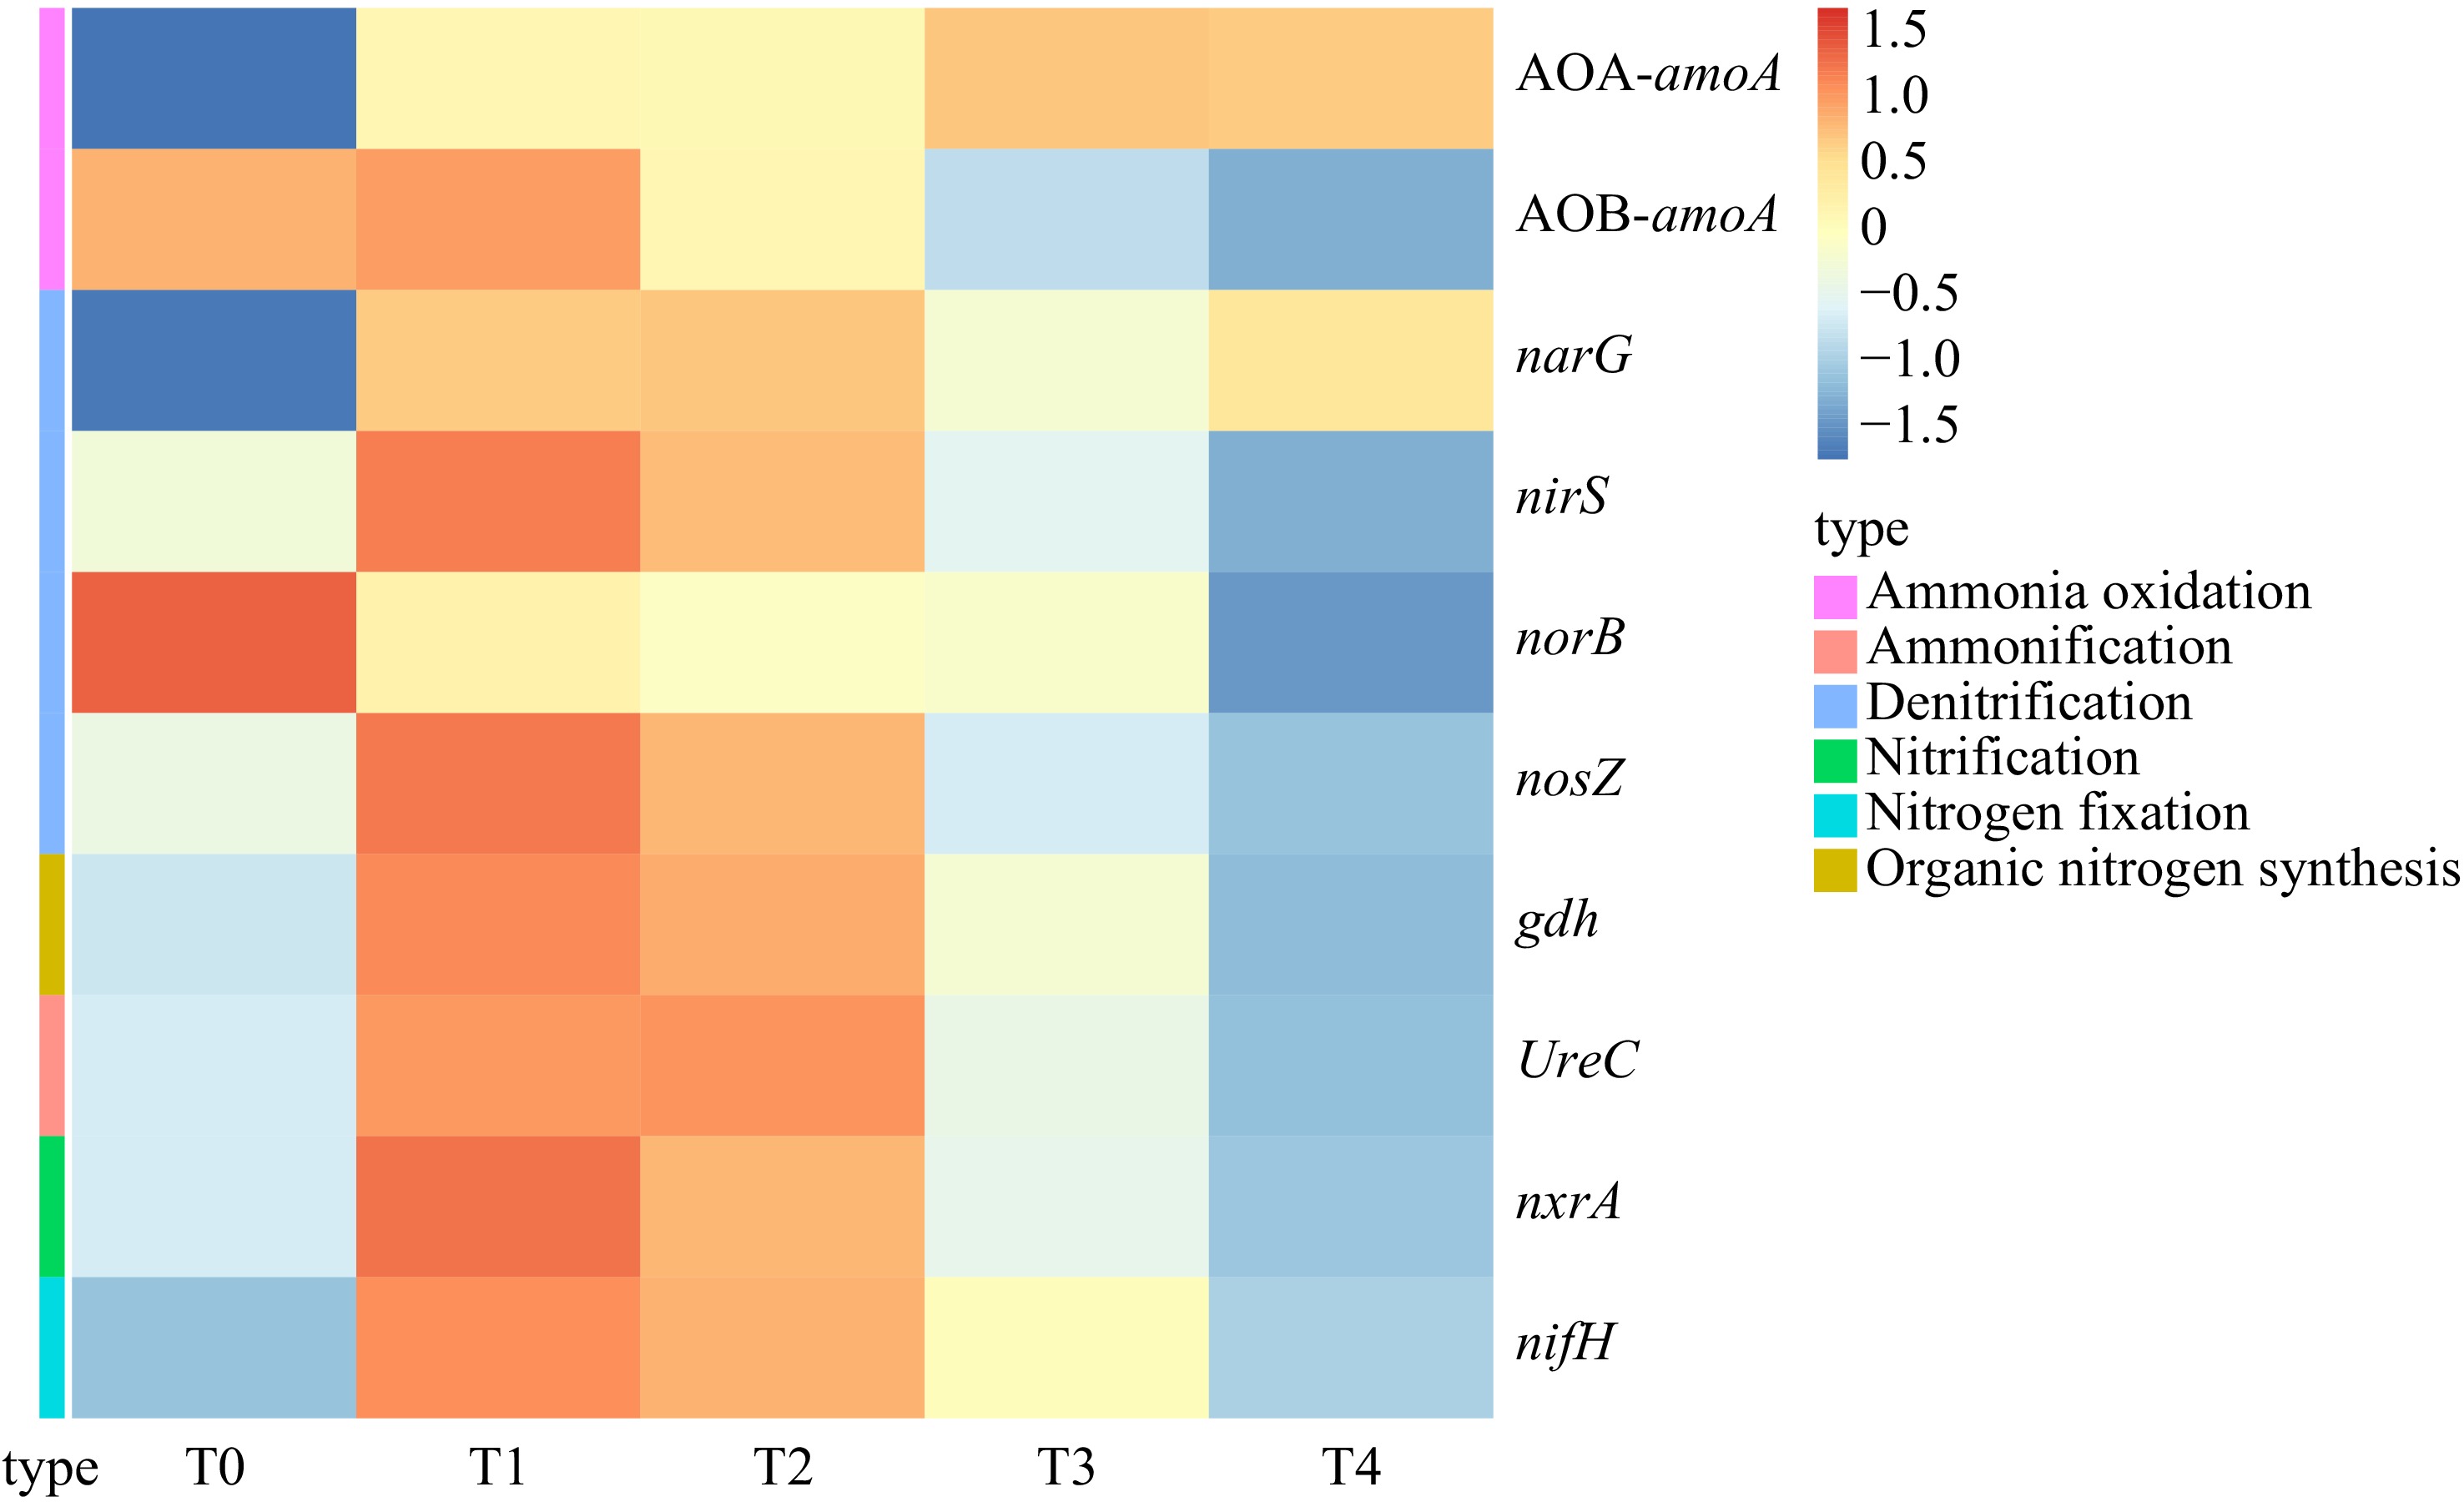
Figure 2.
Difference of nitrogen cycle function gene abundance among different treatments and control.
-
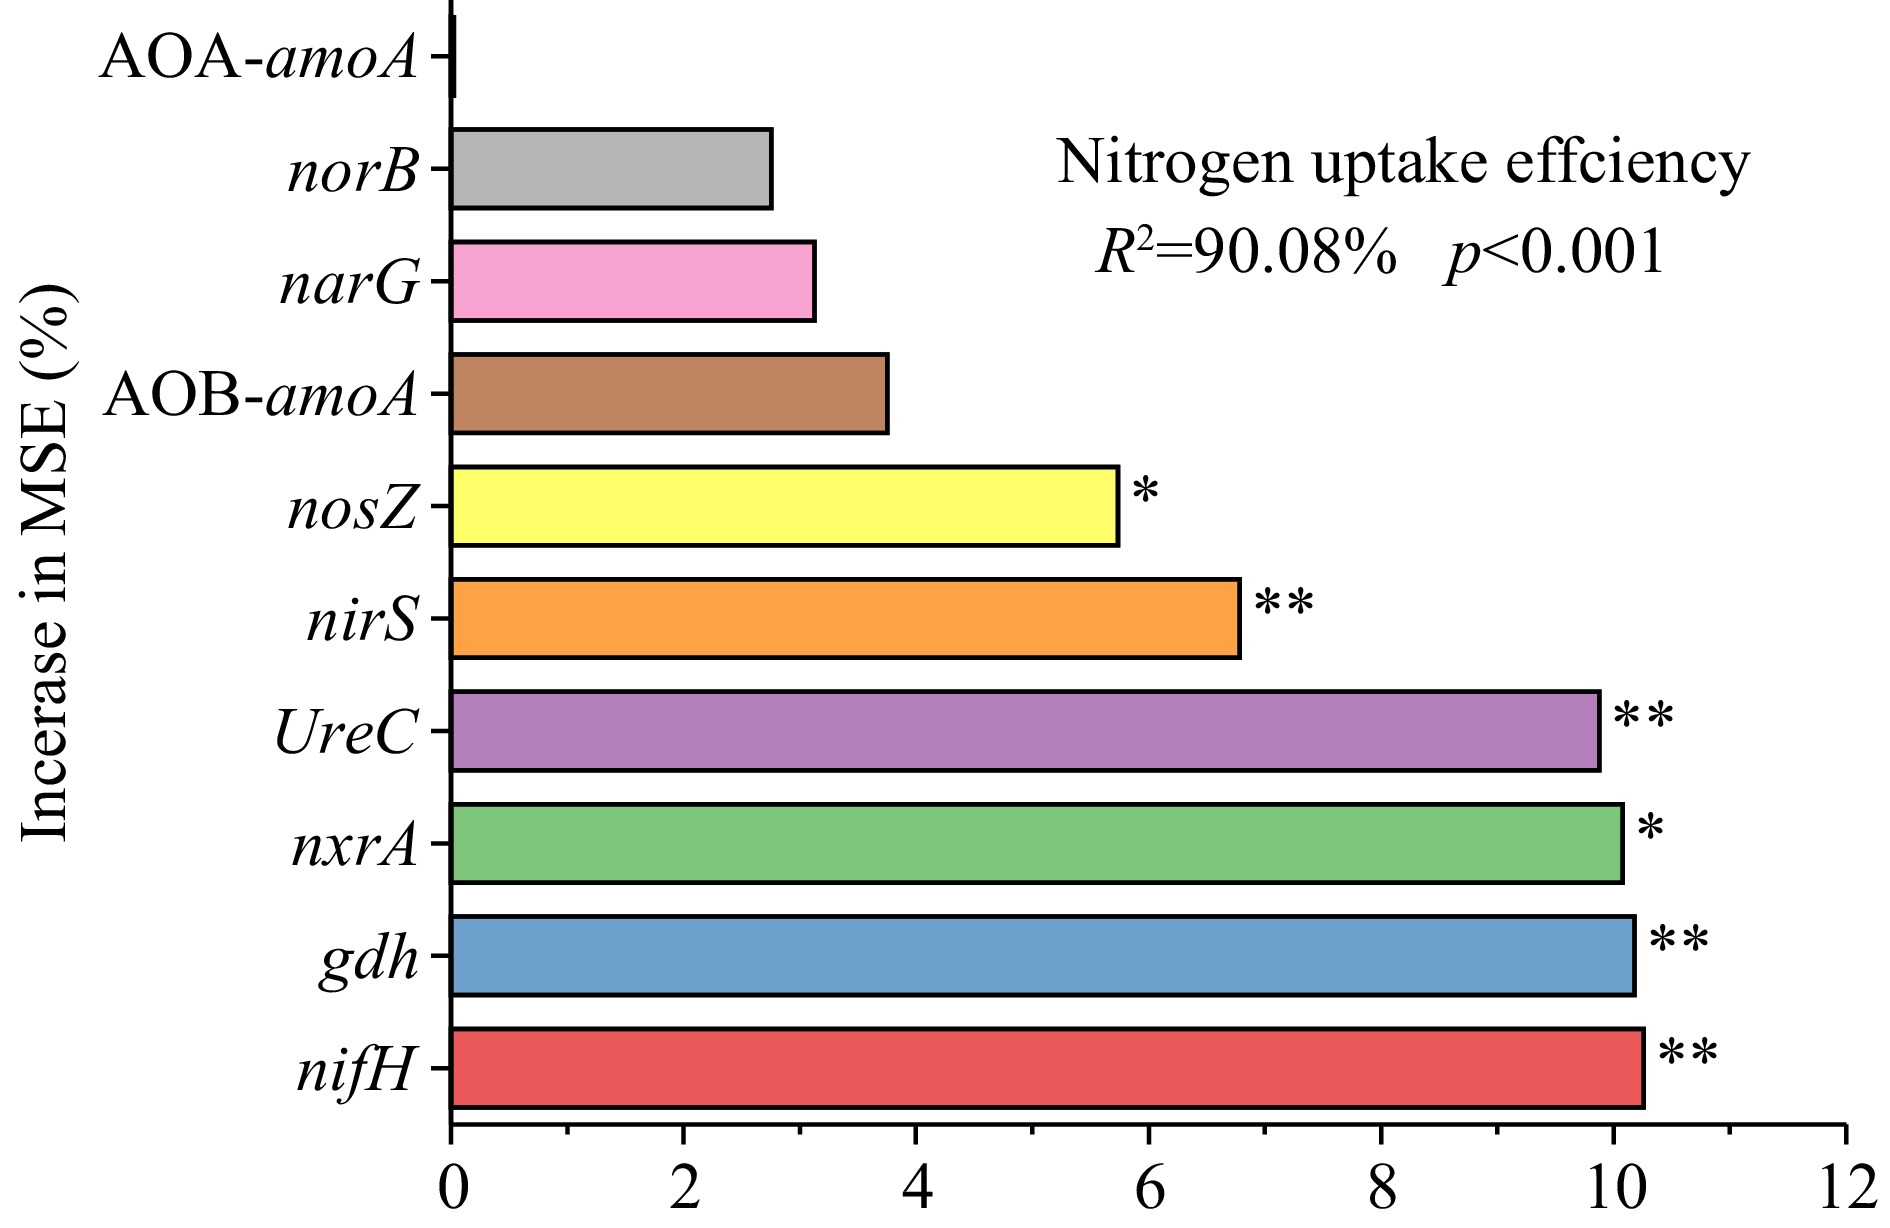
Figure 3.
Random forest model predicts the relevance of nitrogen cycle functional genes on nitrogen uptake efficiency in flue-cured tobacco. Note: The precision importance measures were calculated for each tree in a random forest and averaged over the entire forest. The percentage increase in the mean squared error (MSE) of the variables was used to estimate the importance of these predictors.
-
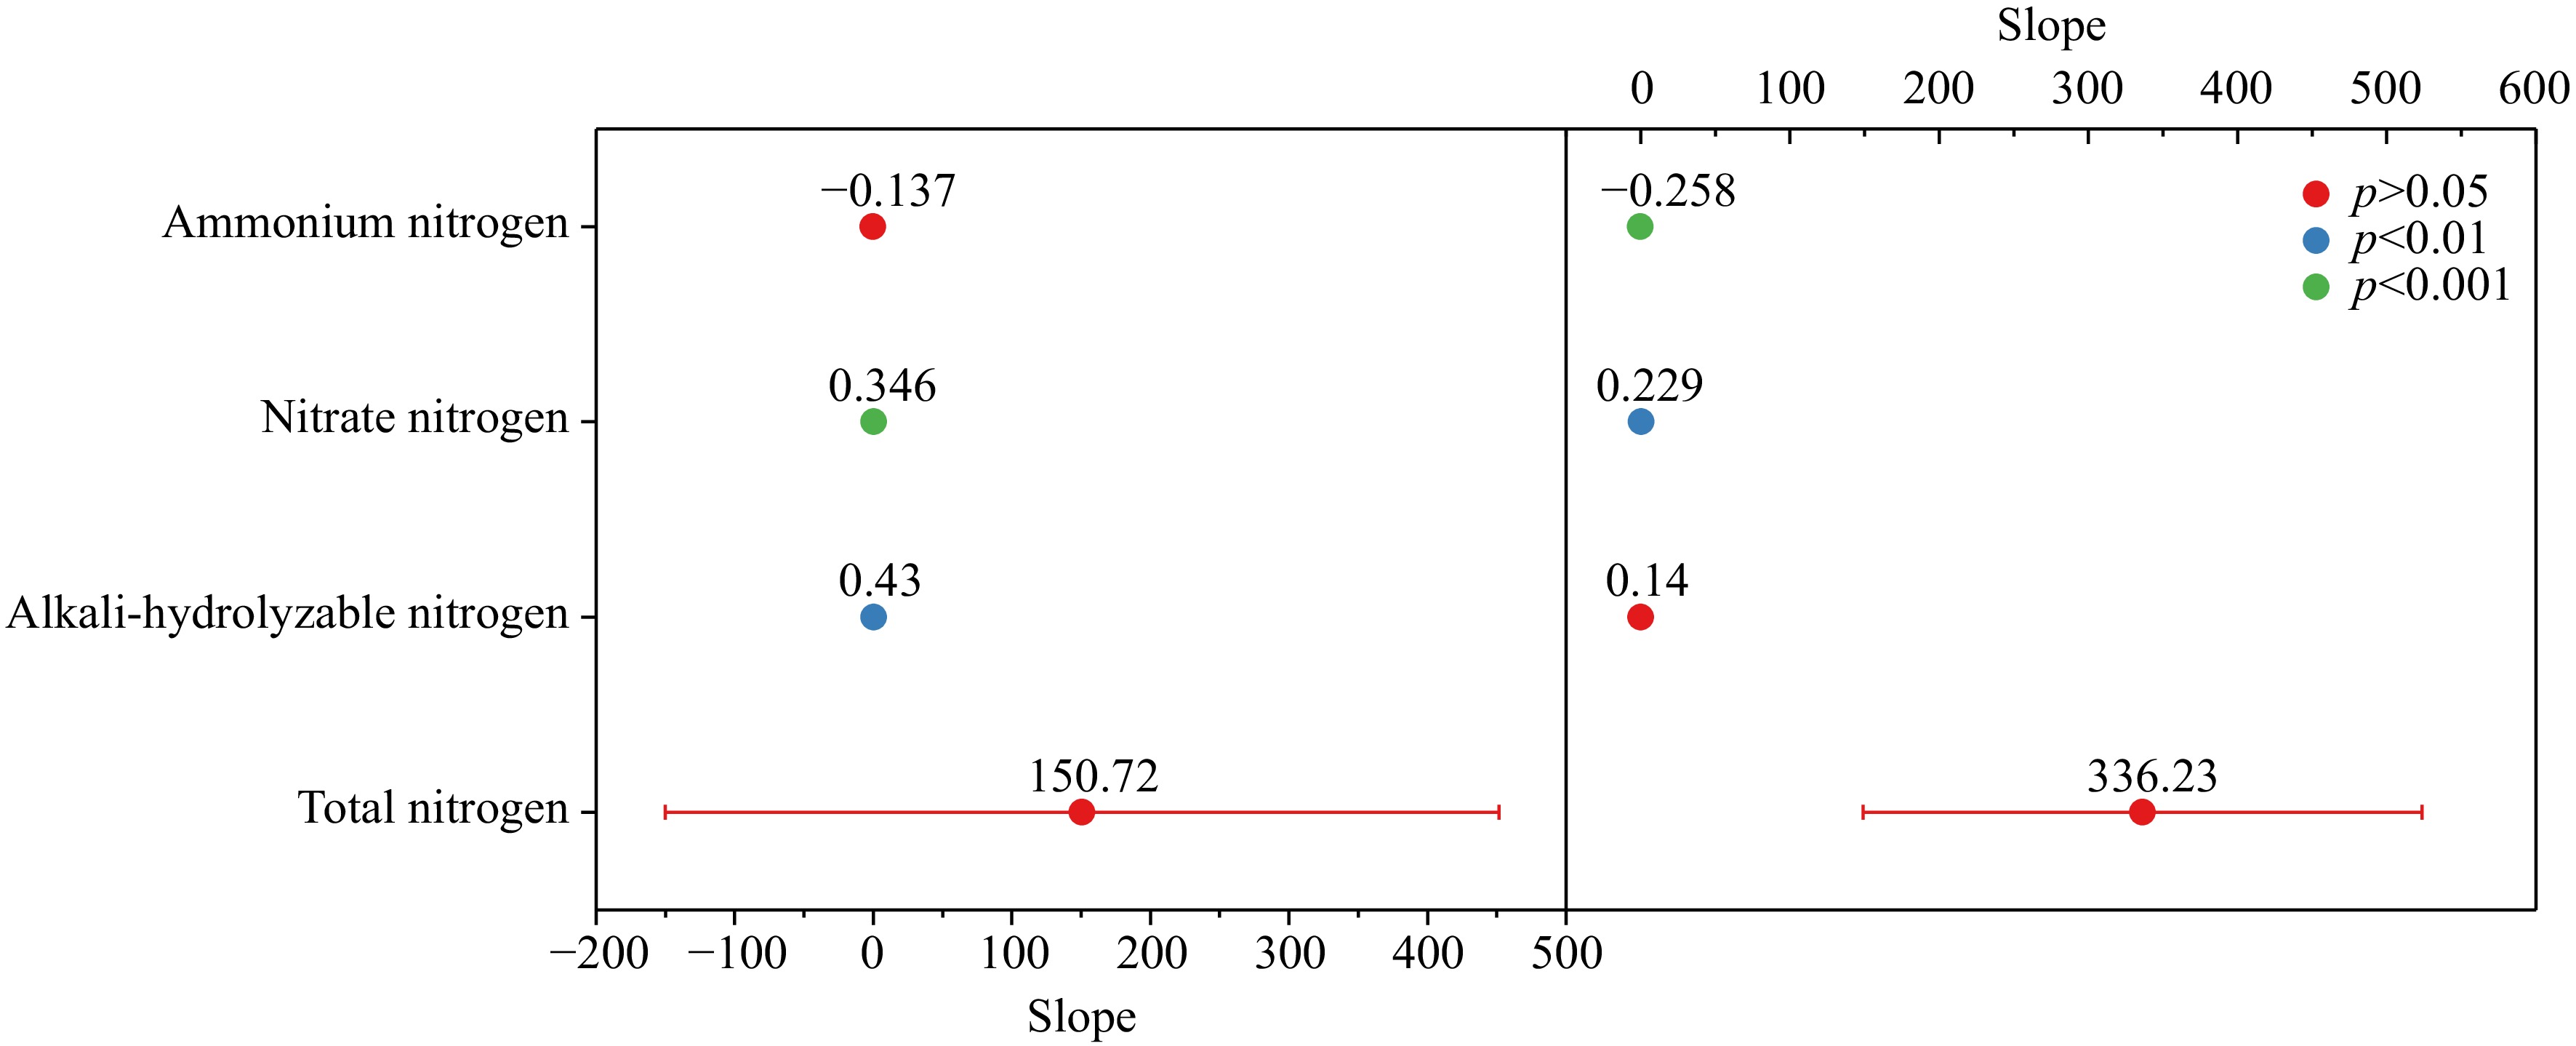
Figure 4.
Regression analysis on different forms of nitrogen content and nitrogen accumulation, absorption and utilization efficiency in soil.
-
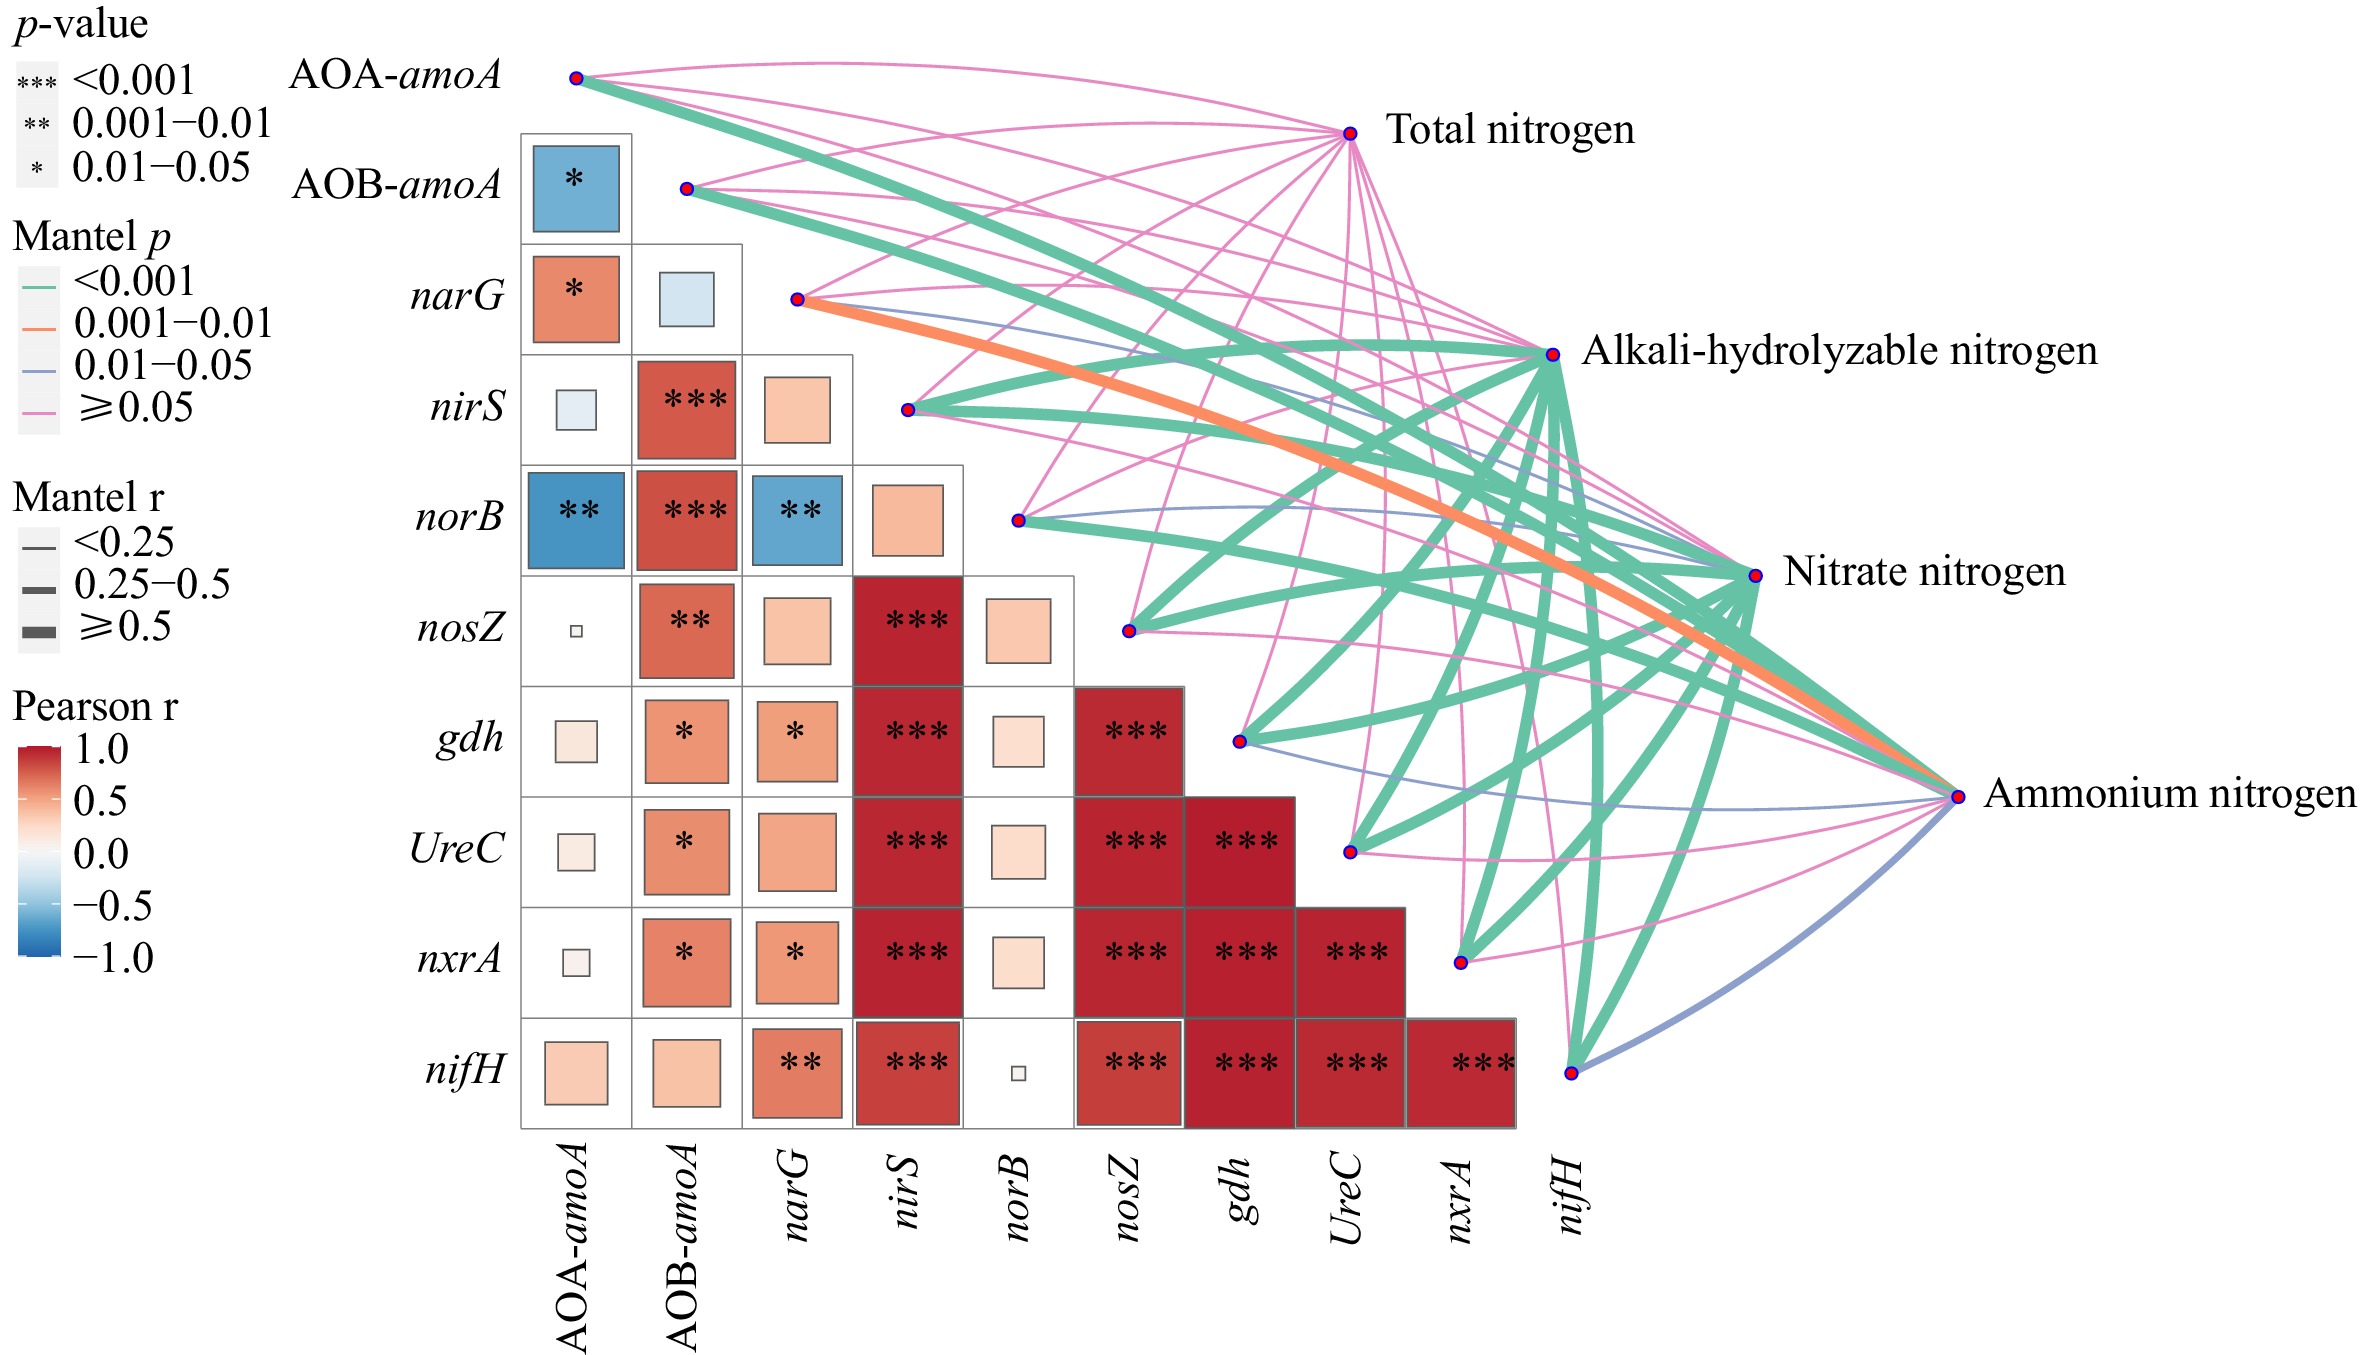
Figure 5.
Mantel test of different forms of nitrogen content and nitrogen cycle function gene abundance.
-
Year Treatment Leaf (kg·ha−1) Stem (kg·ha−1) Root (kg·ha−1) Whole plant (kg·ha−1) Nitrogen uptake efficiency (%) Nitrogen harvest index 2021 N0 20.98d 9.76d 9.12c 39.86f − − T0 34.56c 18.46c 21.04b 74.07e 26.83c 0.47c T1 55.80a 25.60a 29.76a 111.16a 55.93a 0.50b T2 56.17a 24.76a 23.18ab 104.06b 55.95a 0.54a T3 49.03b 24.31a 22.39b 95.73c 54.78a 0.51ab T4 42.80b 21.48b 20.78b 85.06d 50.64b 0.50b 2022 N0 19.21d 5.99c 6.04e 31.23e T0 32.68c 19.15ab 17.43c 69.26d 29.83d 0.47c T1 48.32a 23.20a 22.09a 93.61a 49.71a 0.52b T2 46.79a 20.35b 19.20b 86.33b 48.02a 0.54a T3 44.87a 18.66ab 17.56bc 81.10c 48.89a 0.55a T4 36.29b 18.10b 15.11d 69.49d 42.87c 0.52b Year(Y) ** ** ** ** ** ** Treatment (T) ** ** ** ** ** ** Y × T NS ** NS ** ** NS Note: Nitrogen uptake efficiency for the T0, T1, T2, T3, and T4 treatments was calculated using N0 as the control. Different lowercase letters in the same column of the table indicate the difference between treatments at 0.05 level in the same year (p < 0.05), the same was applied in Table 2 . '*' indicates a significant difference at 0.05 level; '**' indicates a highly significant difference at 0.01 level; NS indicates no significant differences at 0.05 level. Nitrogen accumulation in leaves includes nitrogen in the topped leaves. Table 1.
Effect of reduced nitrogen fertilizer application combined with biochar on nitrogen accumulation and utilization in flue-cured tobacco.
-
Year Treatment pH Soil organic matter
(g·kg−1)Bulk density
(g·cm−3)Porosity
(%)Field moisture capacity
(%)2021 T0 4.96c 29.07b 1.34a 49.44b 33.70b T1 5.16a 31.98a 1.14b 57.19a 49.00a T2 5.18a 31.32a 1.12b 57.99a 47.33a T3 5.16a 31.48a 1.13b 57.34a 46.89a T4 5.15a 31.40a 1.12b 57.74a 44.23a 2022 T0 4.98c 28.89b 1.37a 48.43b 34.57b T1 5.15a 31.76a 1.18b 55.45a 47.00a T2 5.14a 31.93a 1.17b 55.98a 47.66a T3 5.17a 31.41a 1.14b 56.79a 46.56a T4 5.17a 31.15a 1.13b 57.22a 43.90a Table 2.
Effect of reduced nitrogen fertilizer application combined with biochar on physicochemical properties in flue-cured tobacco cultivated soils.
-
Dependent variable Explanatory variable R2 P-value AOA-amoA Bulk density, pH 0.78 <0.01 AOB-amoA Organic matter 0.75 <0.01 narG pH, field moisture capacity 0.85 <0.01 nirS NA norB pH 0.68 <0.01 nosZ NA gdh Organic matter 0.41 <0.05 UreC NA nxrA Organic matter, bulk density, porosity 0.56 <0.01 nifH Organic matter 0.47 <0.01 Only explanatory variables with p < 0.05 are shown in the table. NA represents no best fit model, and R2 represents the proportion of variance explained by the model. Table 3.
Soil physicochemical factors significantly related to the abundance of nitrogen cycle functional genes (screened by stepwise multiple regression).
Figures
(5)
Tables
(3)