-
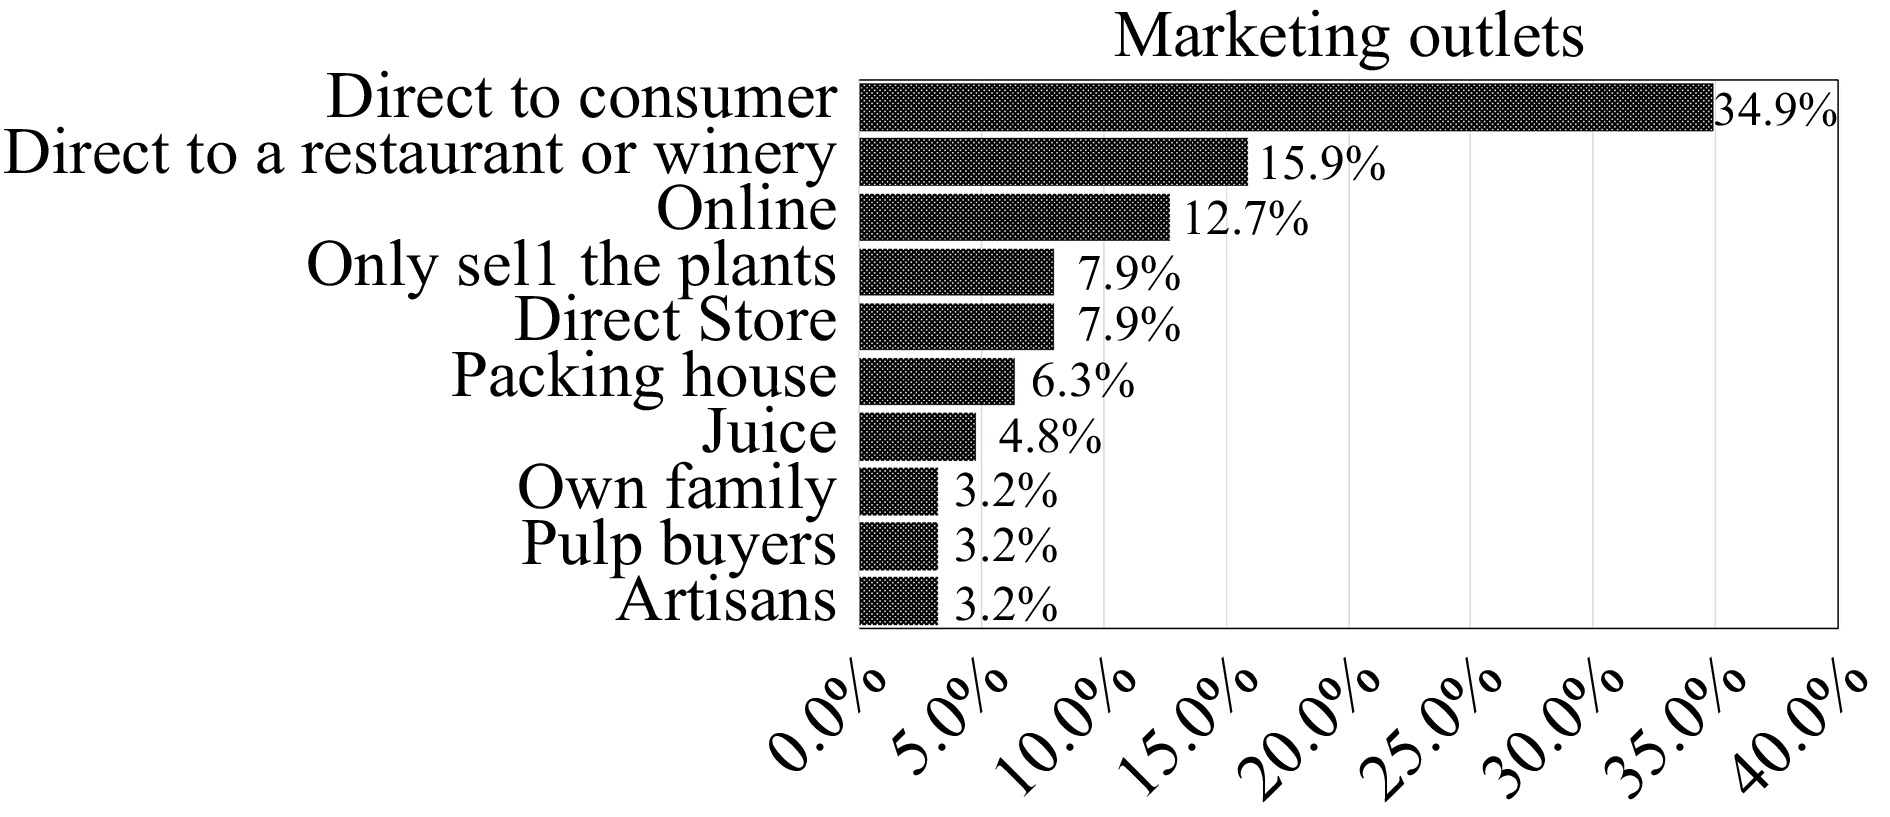
Figure 1.
Point of sale for passion fruit grown in the US ranked in order of greatest to least by percentage of the total sales market.
-
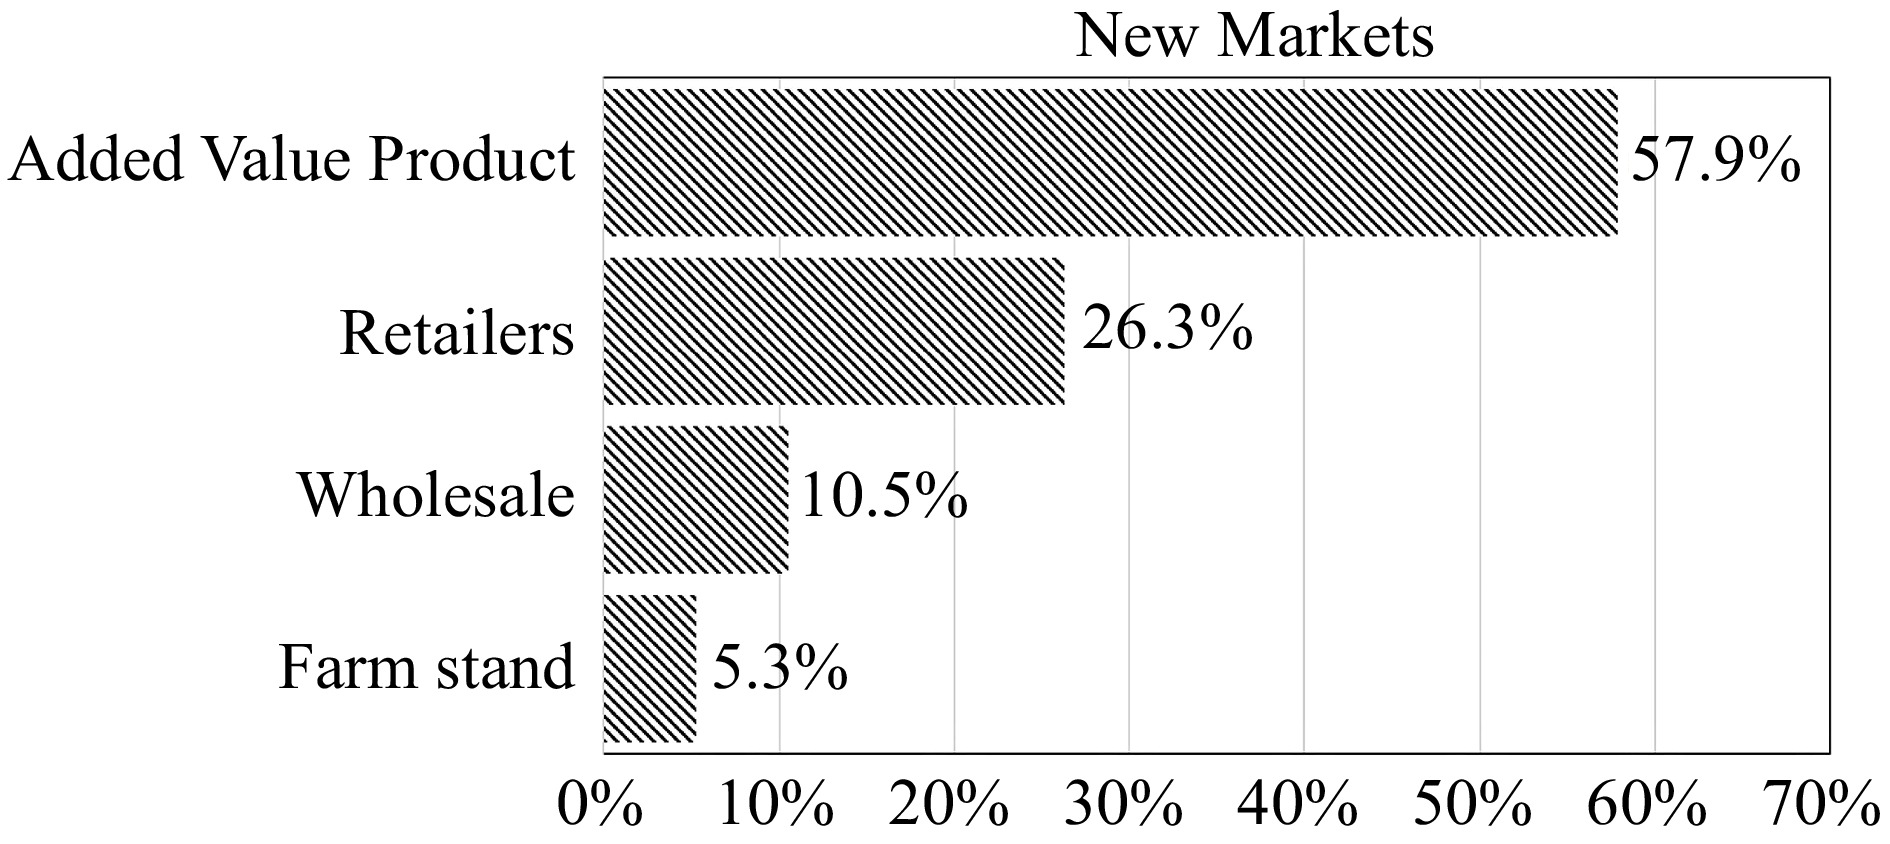
Figure 2.
New markets are being considered for passion fruit sales by US producers.
-
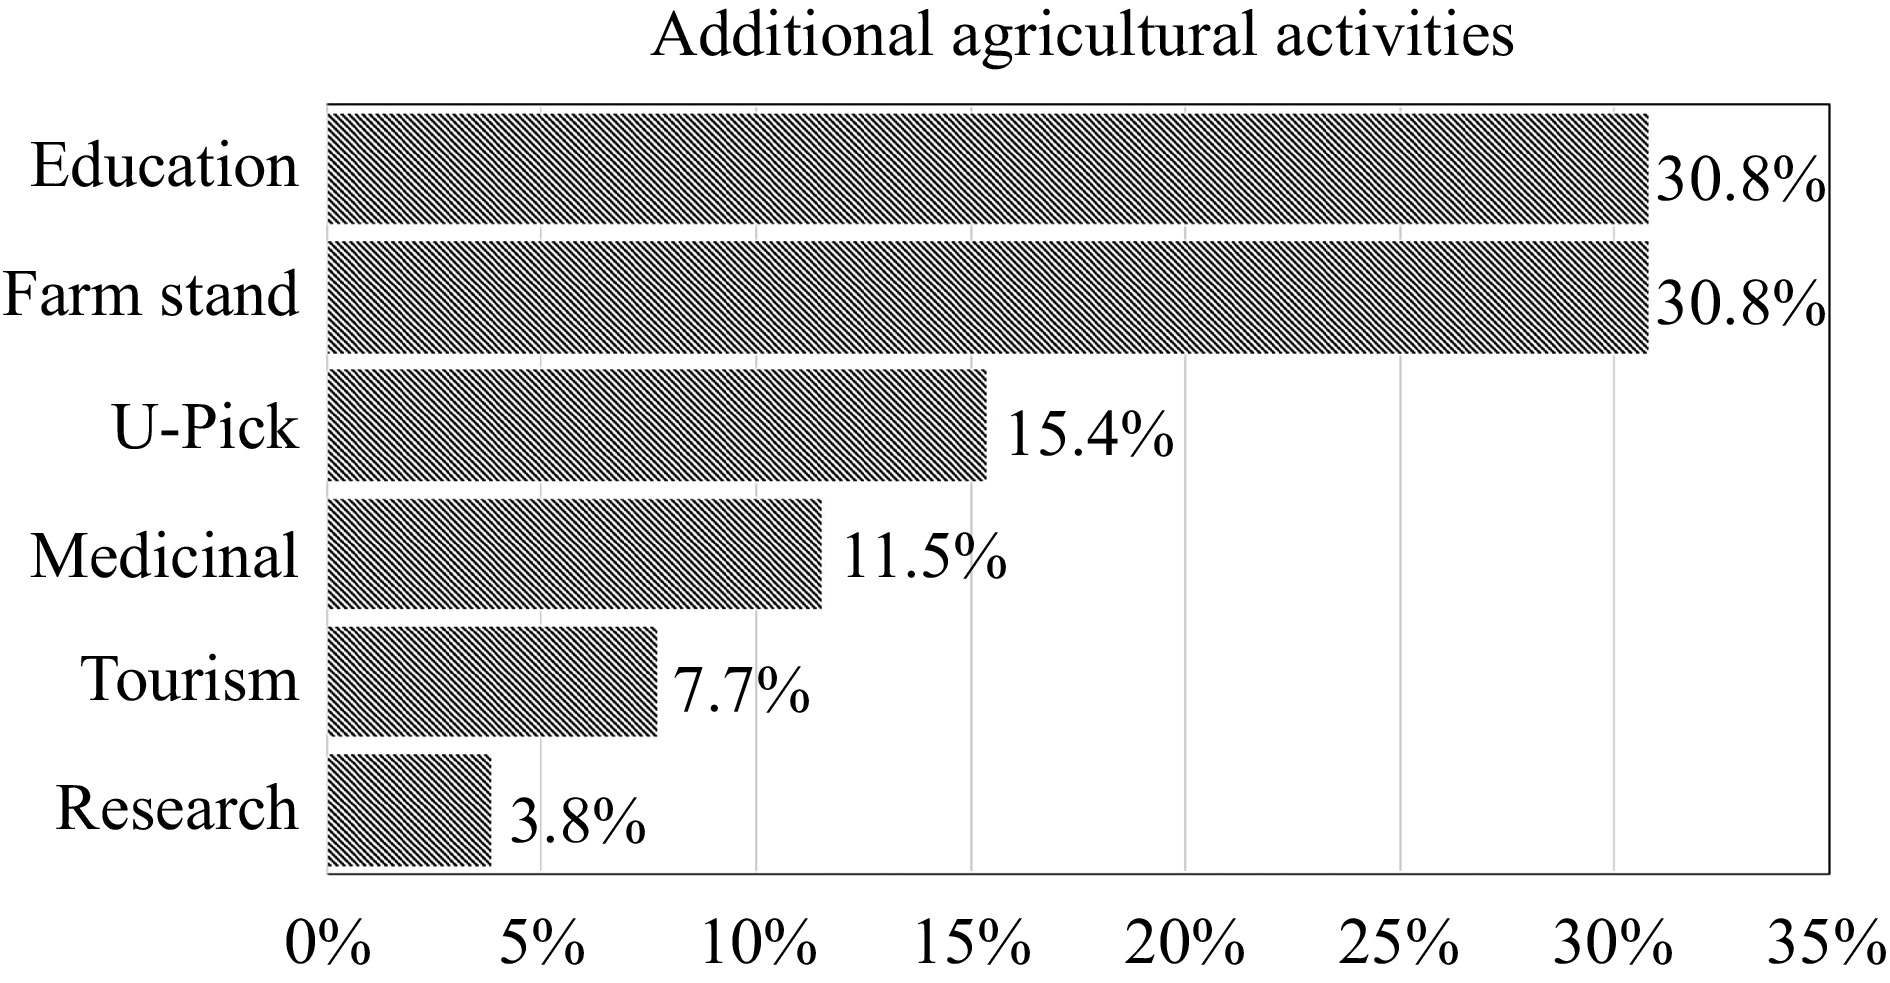
Figure 3.
Participation in additional agricultural activities by US passion fruit producers.
-
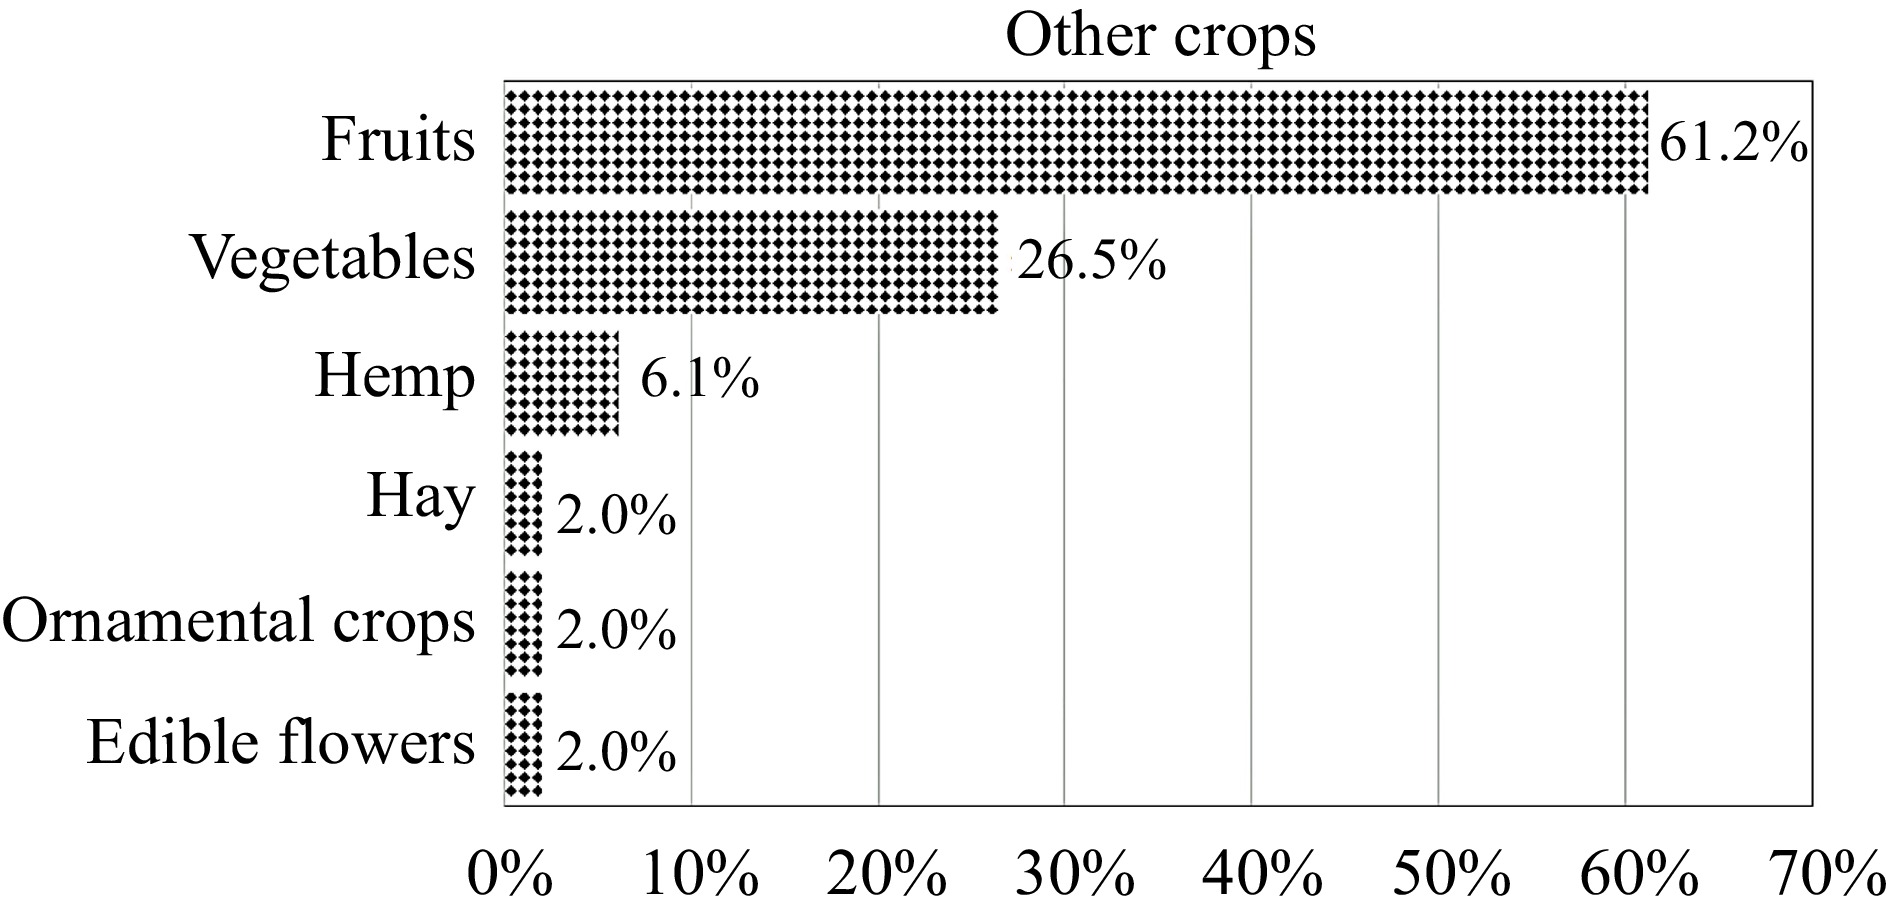
Figure 4.
Other crops are grown by passion fruit producers on their farms.
-
Region Farms (No.) Proportion (%) Florida 21 47.7 California 6 13.6 Puerto Rico 13 29.6 Others 4 9.1 Total 44 100.0 Table 1.
Distribution of passion fruit farms by region and state based on a national survey conducted in 2022.
-
Region Total farm acresns Acres available for expansionns Mean Std. Dev. Mean Std. Dev. Florida 159.5 473.3 9.3 21.8 California 78.0 108.5 3.5 5.2 Puerto Rico 25.4 39.7 3.7 4.5 Others 41.1 55.9 10.1 7.9 Total 98.0 331.7 6.9 15.6 ns – not statistically significant (α = 0.05). Table 2.
Total farm acres and acres available for expansion.
-
Region Acres devoted to passion
fruit in 2019nsAcres devoted to passion
fruit in 2020nsMean Std. Dev. Mean Std. Dev. Florida 2.9 6.6 3.7 10.0 California 0.3 0.4 0.6 0.9 Puerto Rico 0.7 0.8 0.8 0.9 Others 0.5 0.0 0.5 0.0 Total 1.7 4.7 2.1 6.9 ns – not statistically significant (α = 0.05). Table 3.
New acres dedicated to passion fruit in 2019 and 2020.
-
Region The average price received per box or flat in 2021( ${\$} $ Mean Std. Dev. Florida 3.97 2.69 California 2.50 0.0 Puerto Rico 2.48 1.59 Others − − Total 3.08 2.03 ns – not statistically significant (α = 0.05). Table 4.
Average price received by grower per box or flat of passion fruit produced in the 2021 growing season across several US locations.
-
Region Percent of harvested passion fruit sold as freshns Percent of farms that produced value-added products* Mean Std. Dev. Florida 87.5 18.9 44.4 California 73.8 11.1 16.7 Puerto Rico 82.5 13.7 83.3 Others 90.0 0.0 50.0 Total 82.9 13.6 52.5 * – statistically significant at 0.05. Table 5.
Percent of harvested passion fruit sold as fresh and percent of farms that produced value-added products.
-
Region Meanns Std. Dev. Frequency Florida 55.2 15.3 12 California 55.0 15.3 6 Puerto Rico 50.2 12.2 13 Others 53.5 22.0 2 Total 53.2 13.9 33 ns – not statistically significant (α = 0.05). Table 6.
The average age of passion fruit respondents.
-
Race Frequency Percent White 23 62.1 Multiple 6 16.2 American Indian 4 10.8 Asian 3 8.11 African American 1 2.7 Total 37 100.0 Table 7.
Distribution of respondents by racial origin.
-
Independent variable Coefficient Robust standard error Region California*** 9093.805 1719.473 Puerto Rico* 5814.651 3015.328 Fruit-bearing acres in 2021** 503.081 135.941 Constant −622.038 574.196 Number of observations 23 Probability (3,19) 0.000 R-squared 0.391 *** - significant at 0.01, ** - significant at 0.025, * - significant at 0.10. Table 8.
Regression results with the yield per farm in 2021 (in pounds per acre) as the dependent variable.
Figures
(4)
Tables
(8)