-
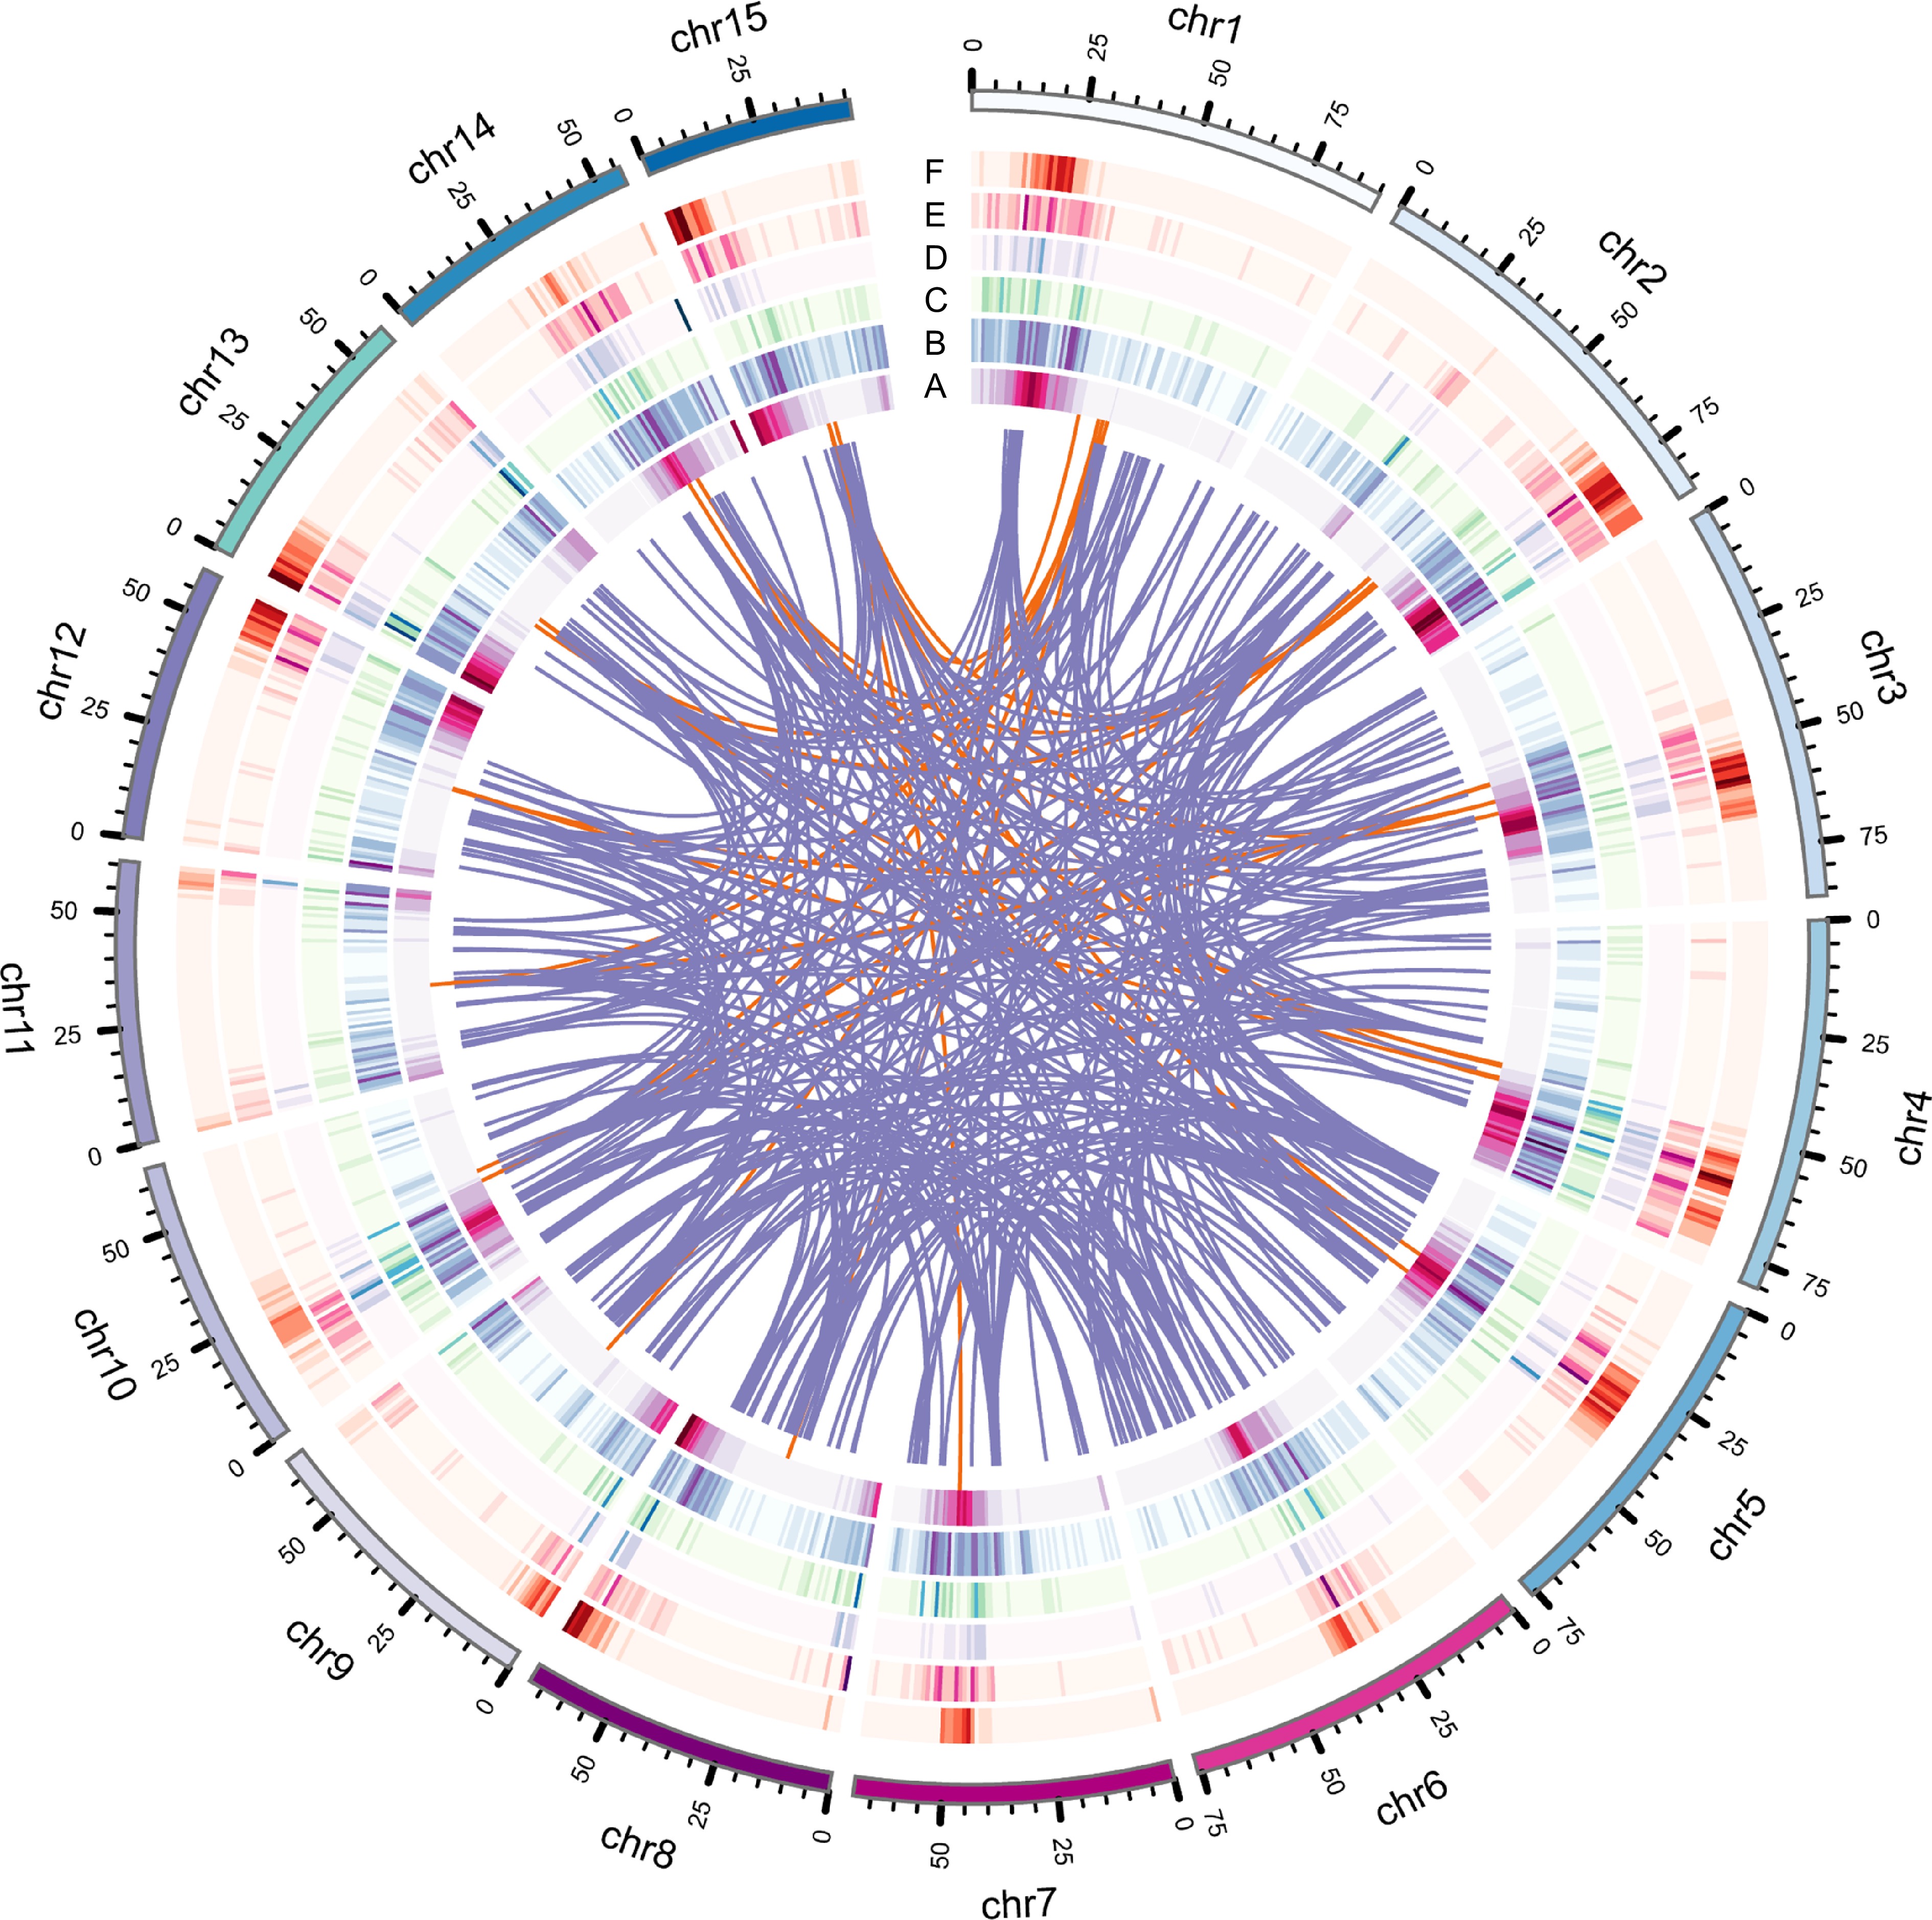
Figure 1.
Genome features of IPC, including various types of gene duplications. (a) Circles represent gene density, (b) DSD, (c) PD, (d) TD, (e) TRD, and (f) WGD duplicated gene densities. The innermost circle represents gene density, while the other circles represent the density of different types of gene duplications.
-
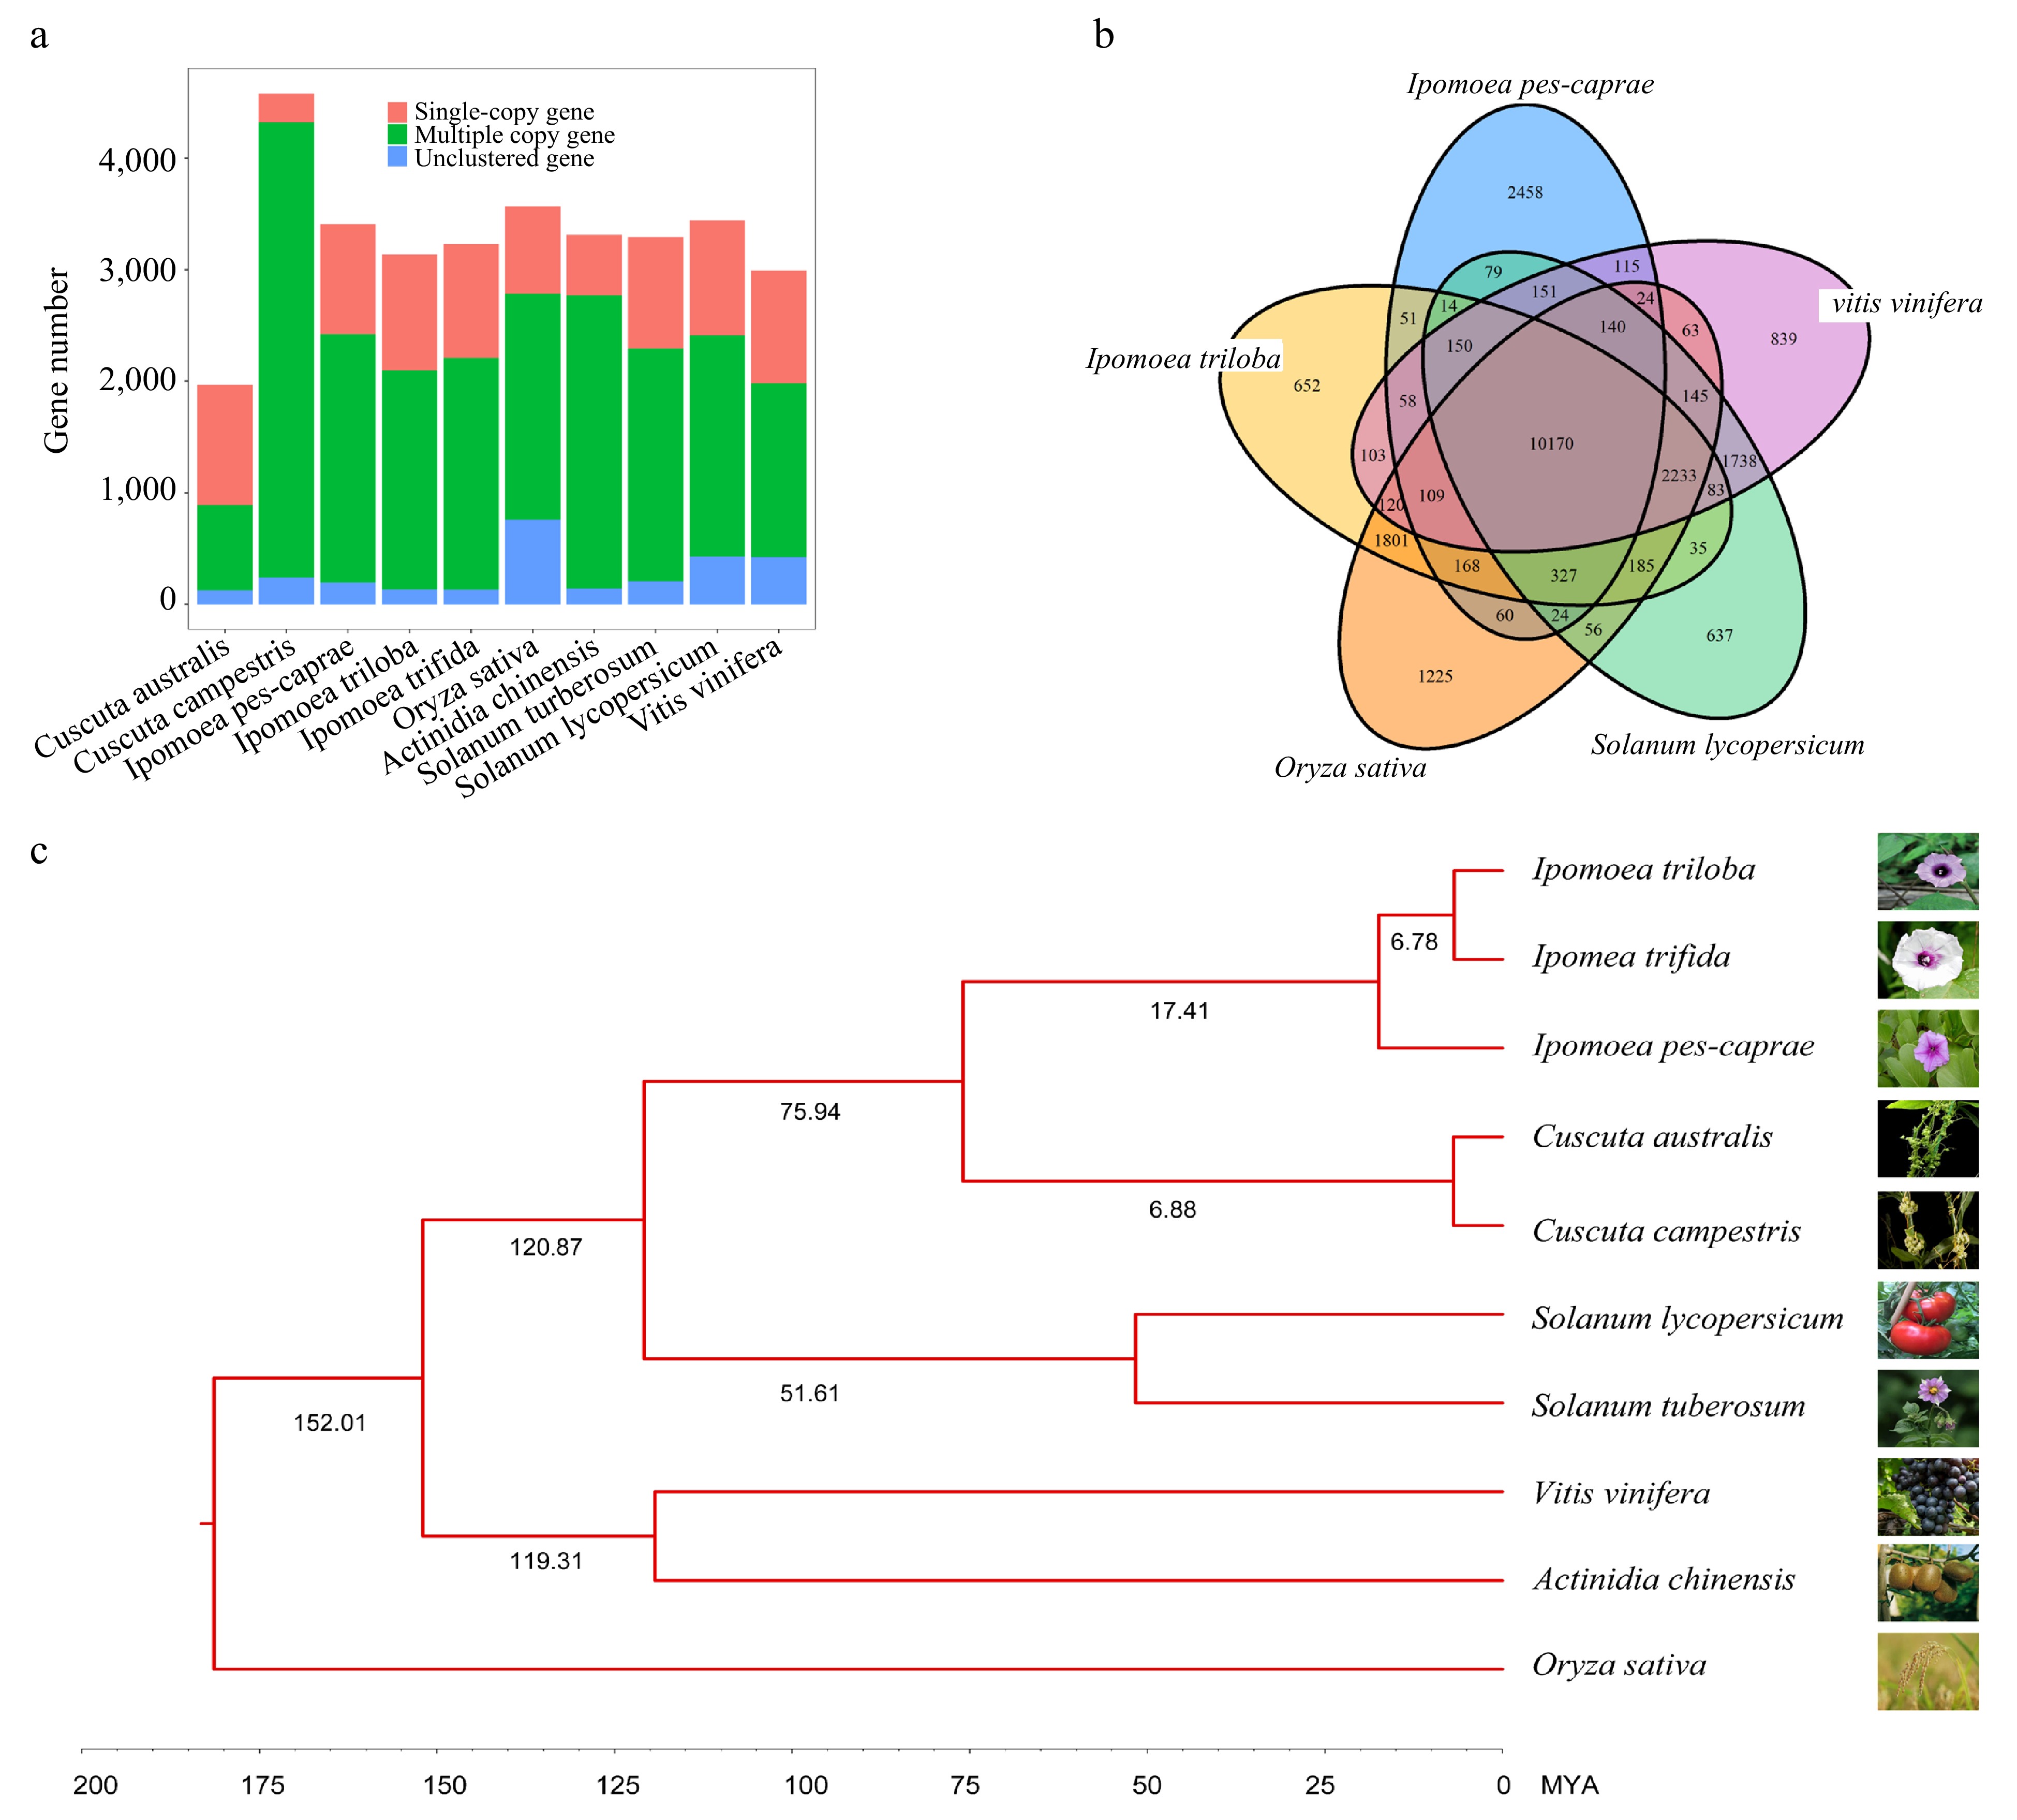
Figure 2.
Comparative analysis of the IPC genome and its close relatives. (a) Copy number analysis of IPC in comparison to nine other species. (b) Venn diagram showing the unique and shared gene families among IPC and four other species. (c) Phylogenetic relationships and estimated divergent times among IPC and nine other species.
-
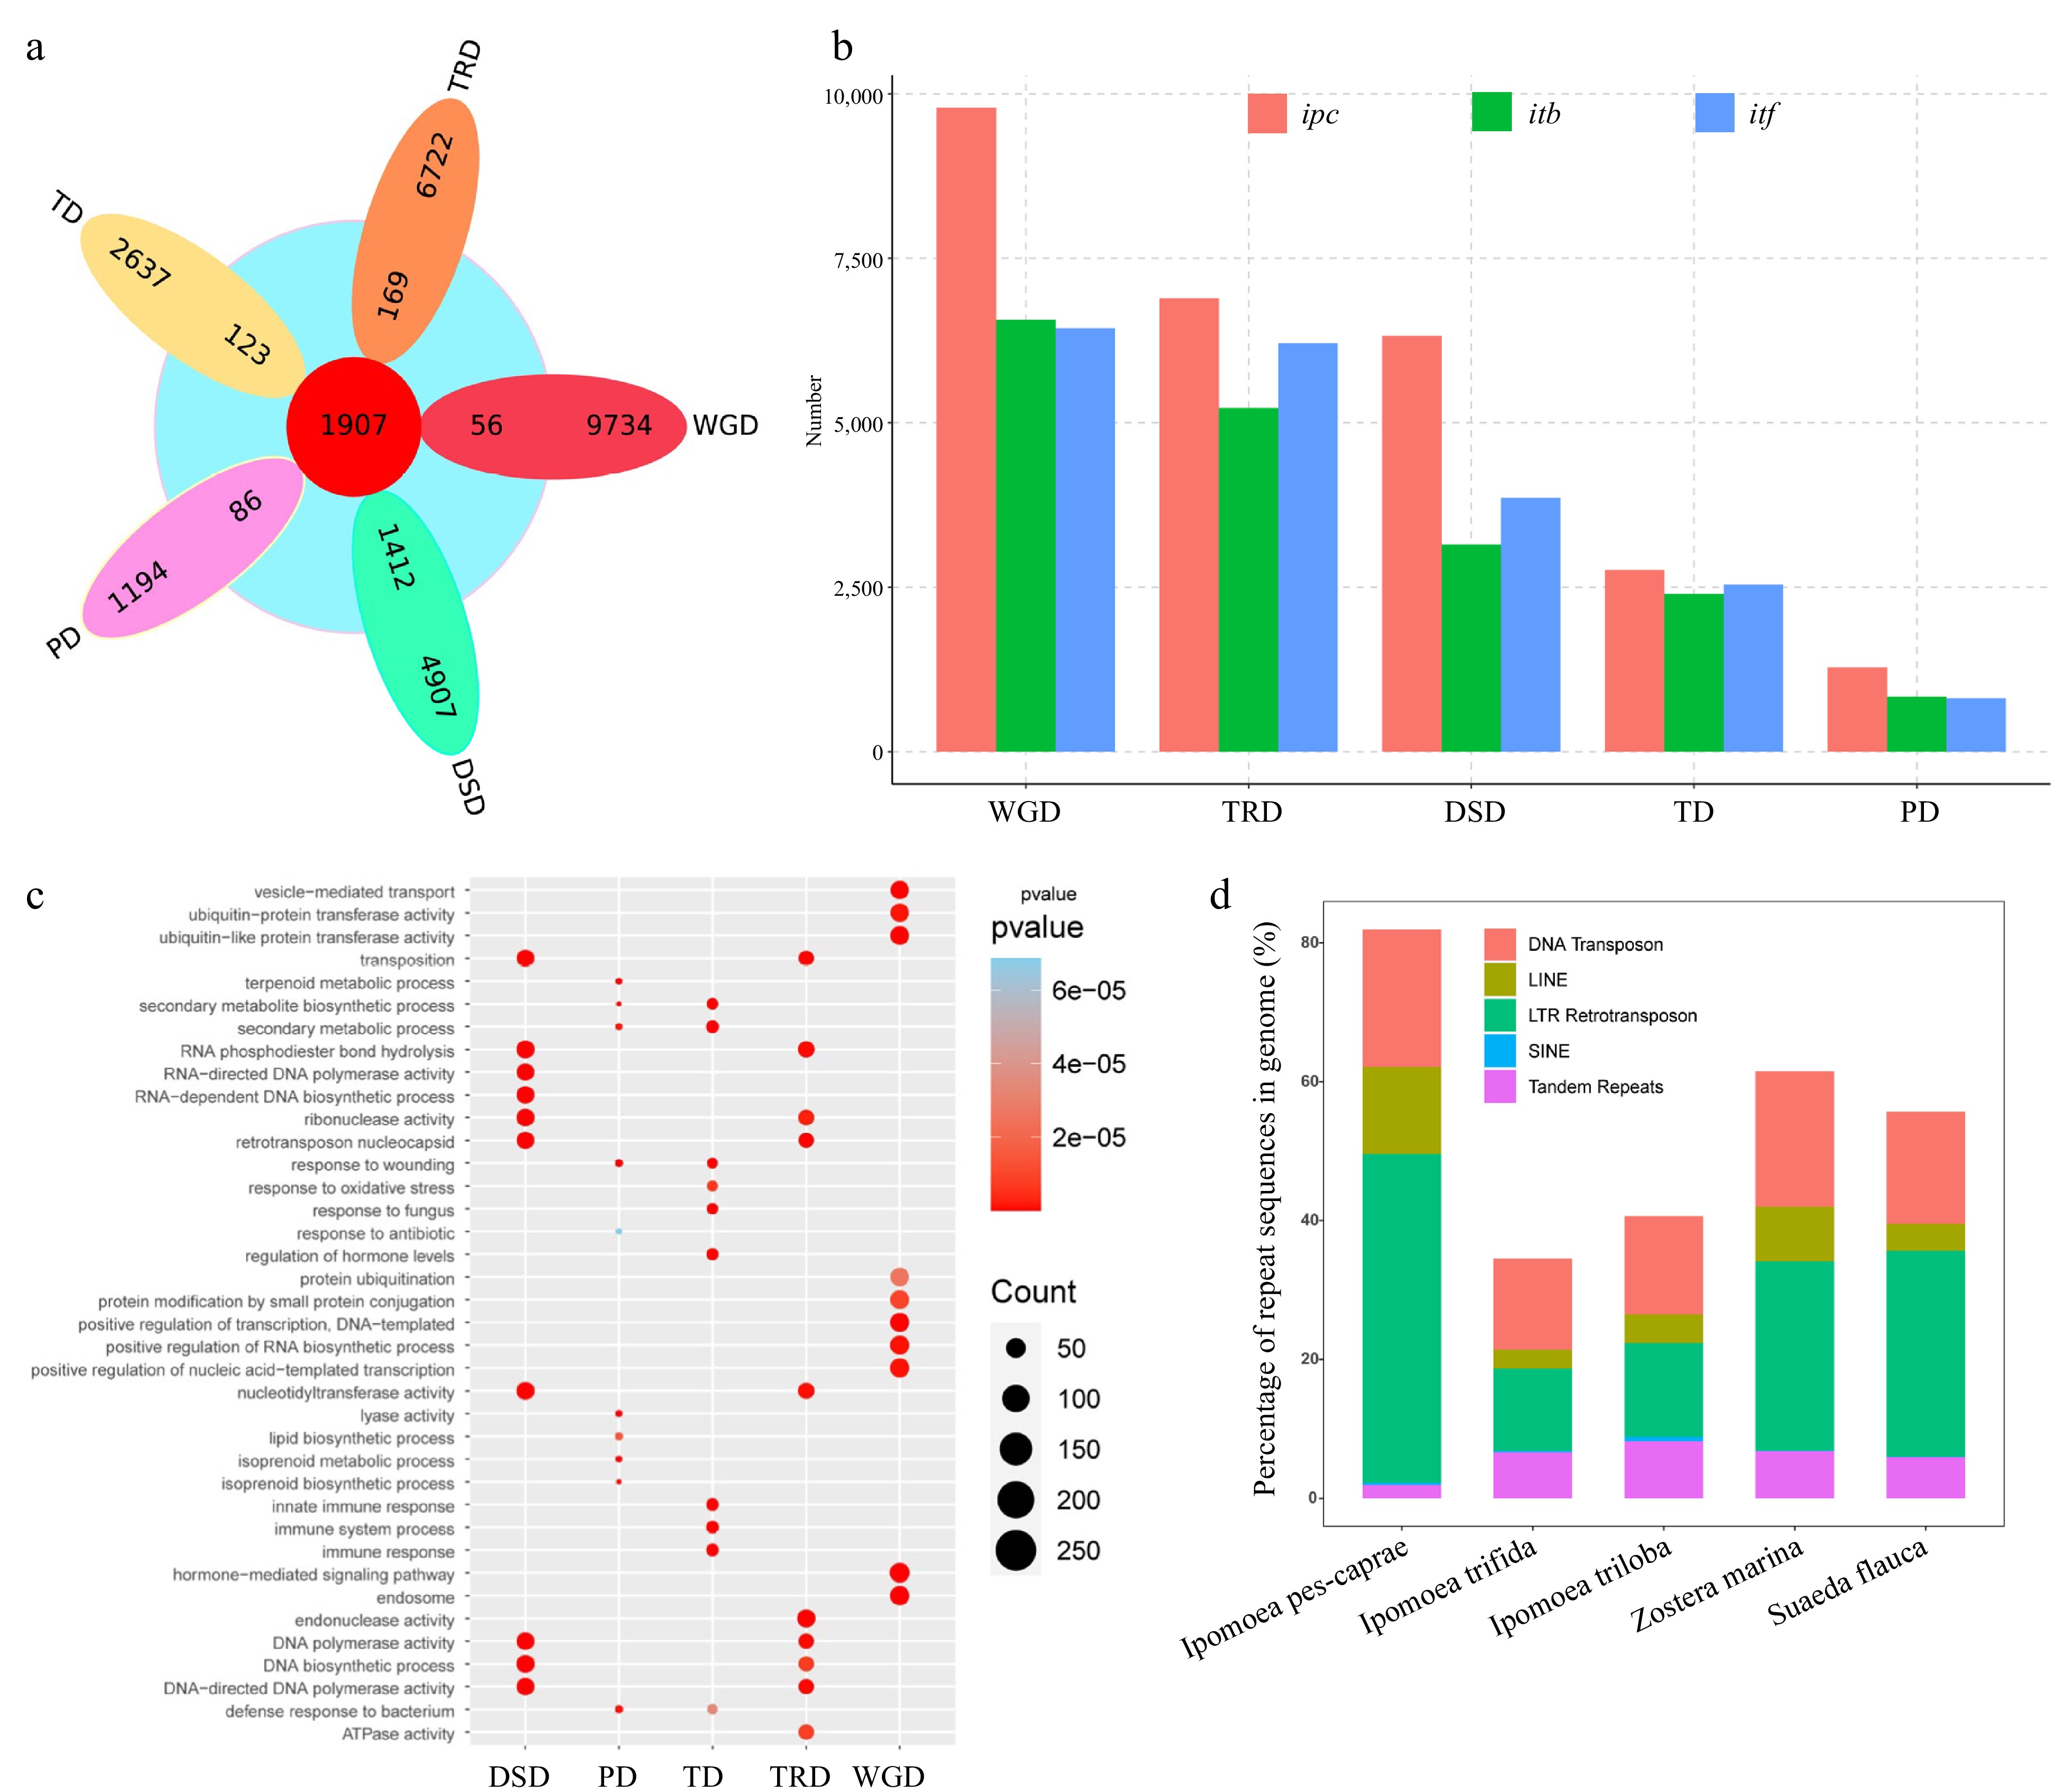
Figure 3.
Analysis of genome sequence repeats and gene repeats in IPC. (a) Venn diagram showing the overlap between expanded gene families and repeat gene families from different duplication events (WGD, TD, PD, TRD, and DSD). (b) Statistics of repeat genes from the five duplication modes in Ipomea pes-caprae (ipc), Ipomoea triloba (itb), and Ipomea trifida (itf). (c) Gene ontology (GO) terms enriched in different types of duplication genes. (d) Proportions of different repeat types in the genomes of the five species.
-
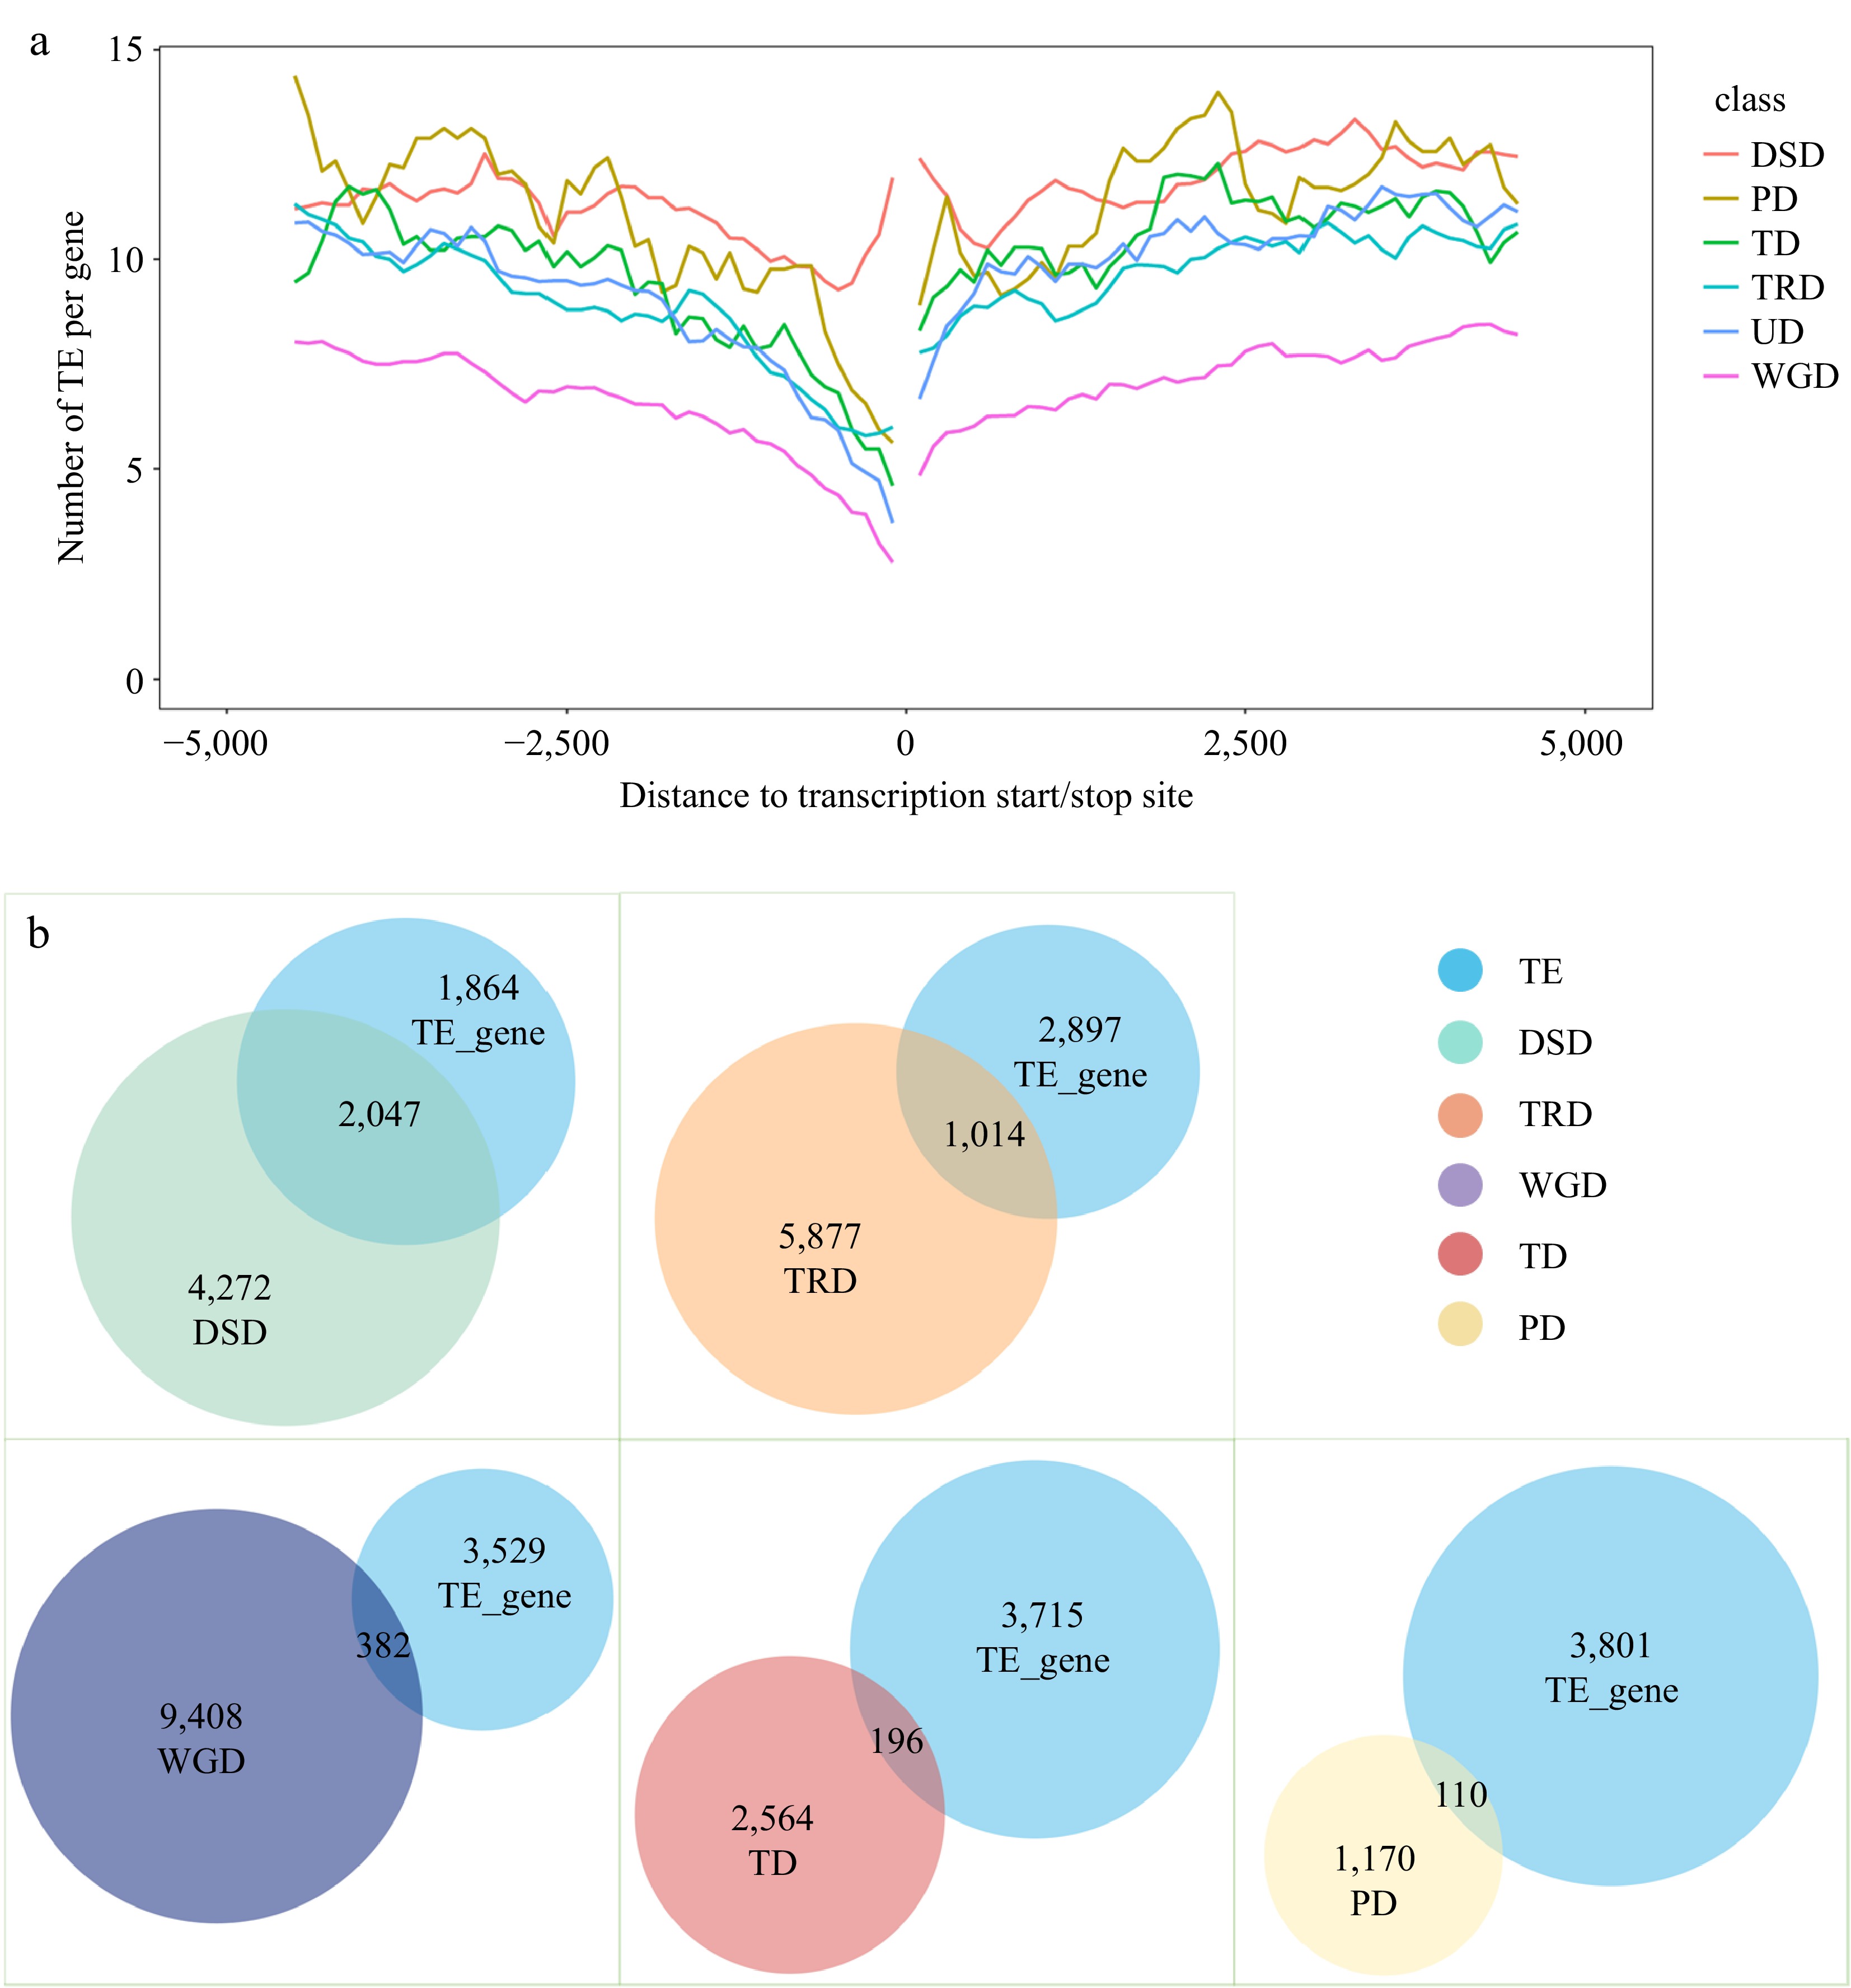
Figure 4.
Analysis of transposable element (TE) events associated with different types of repeat genes. (a) TE distribution in the upstream and downstream regions of coding sequences (CDS) for different types of duplicate genes. (b) Overlap of TE-associated genes with repeat genes of different duplication types.
-
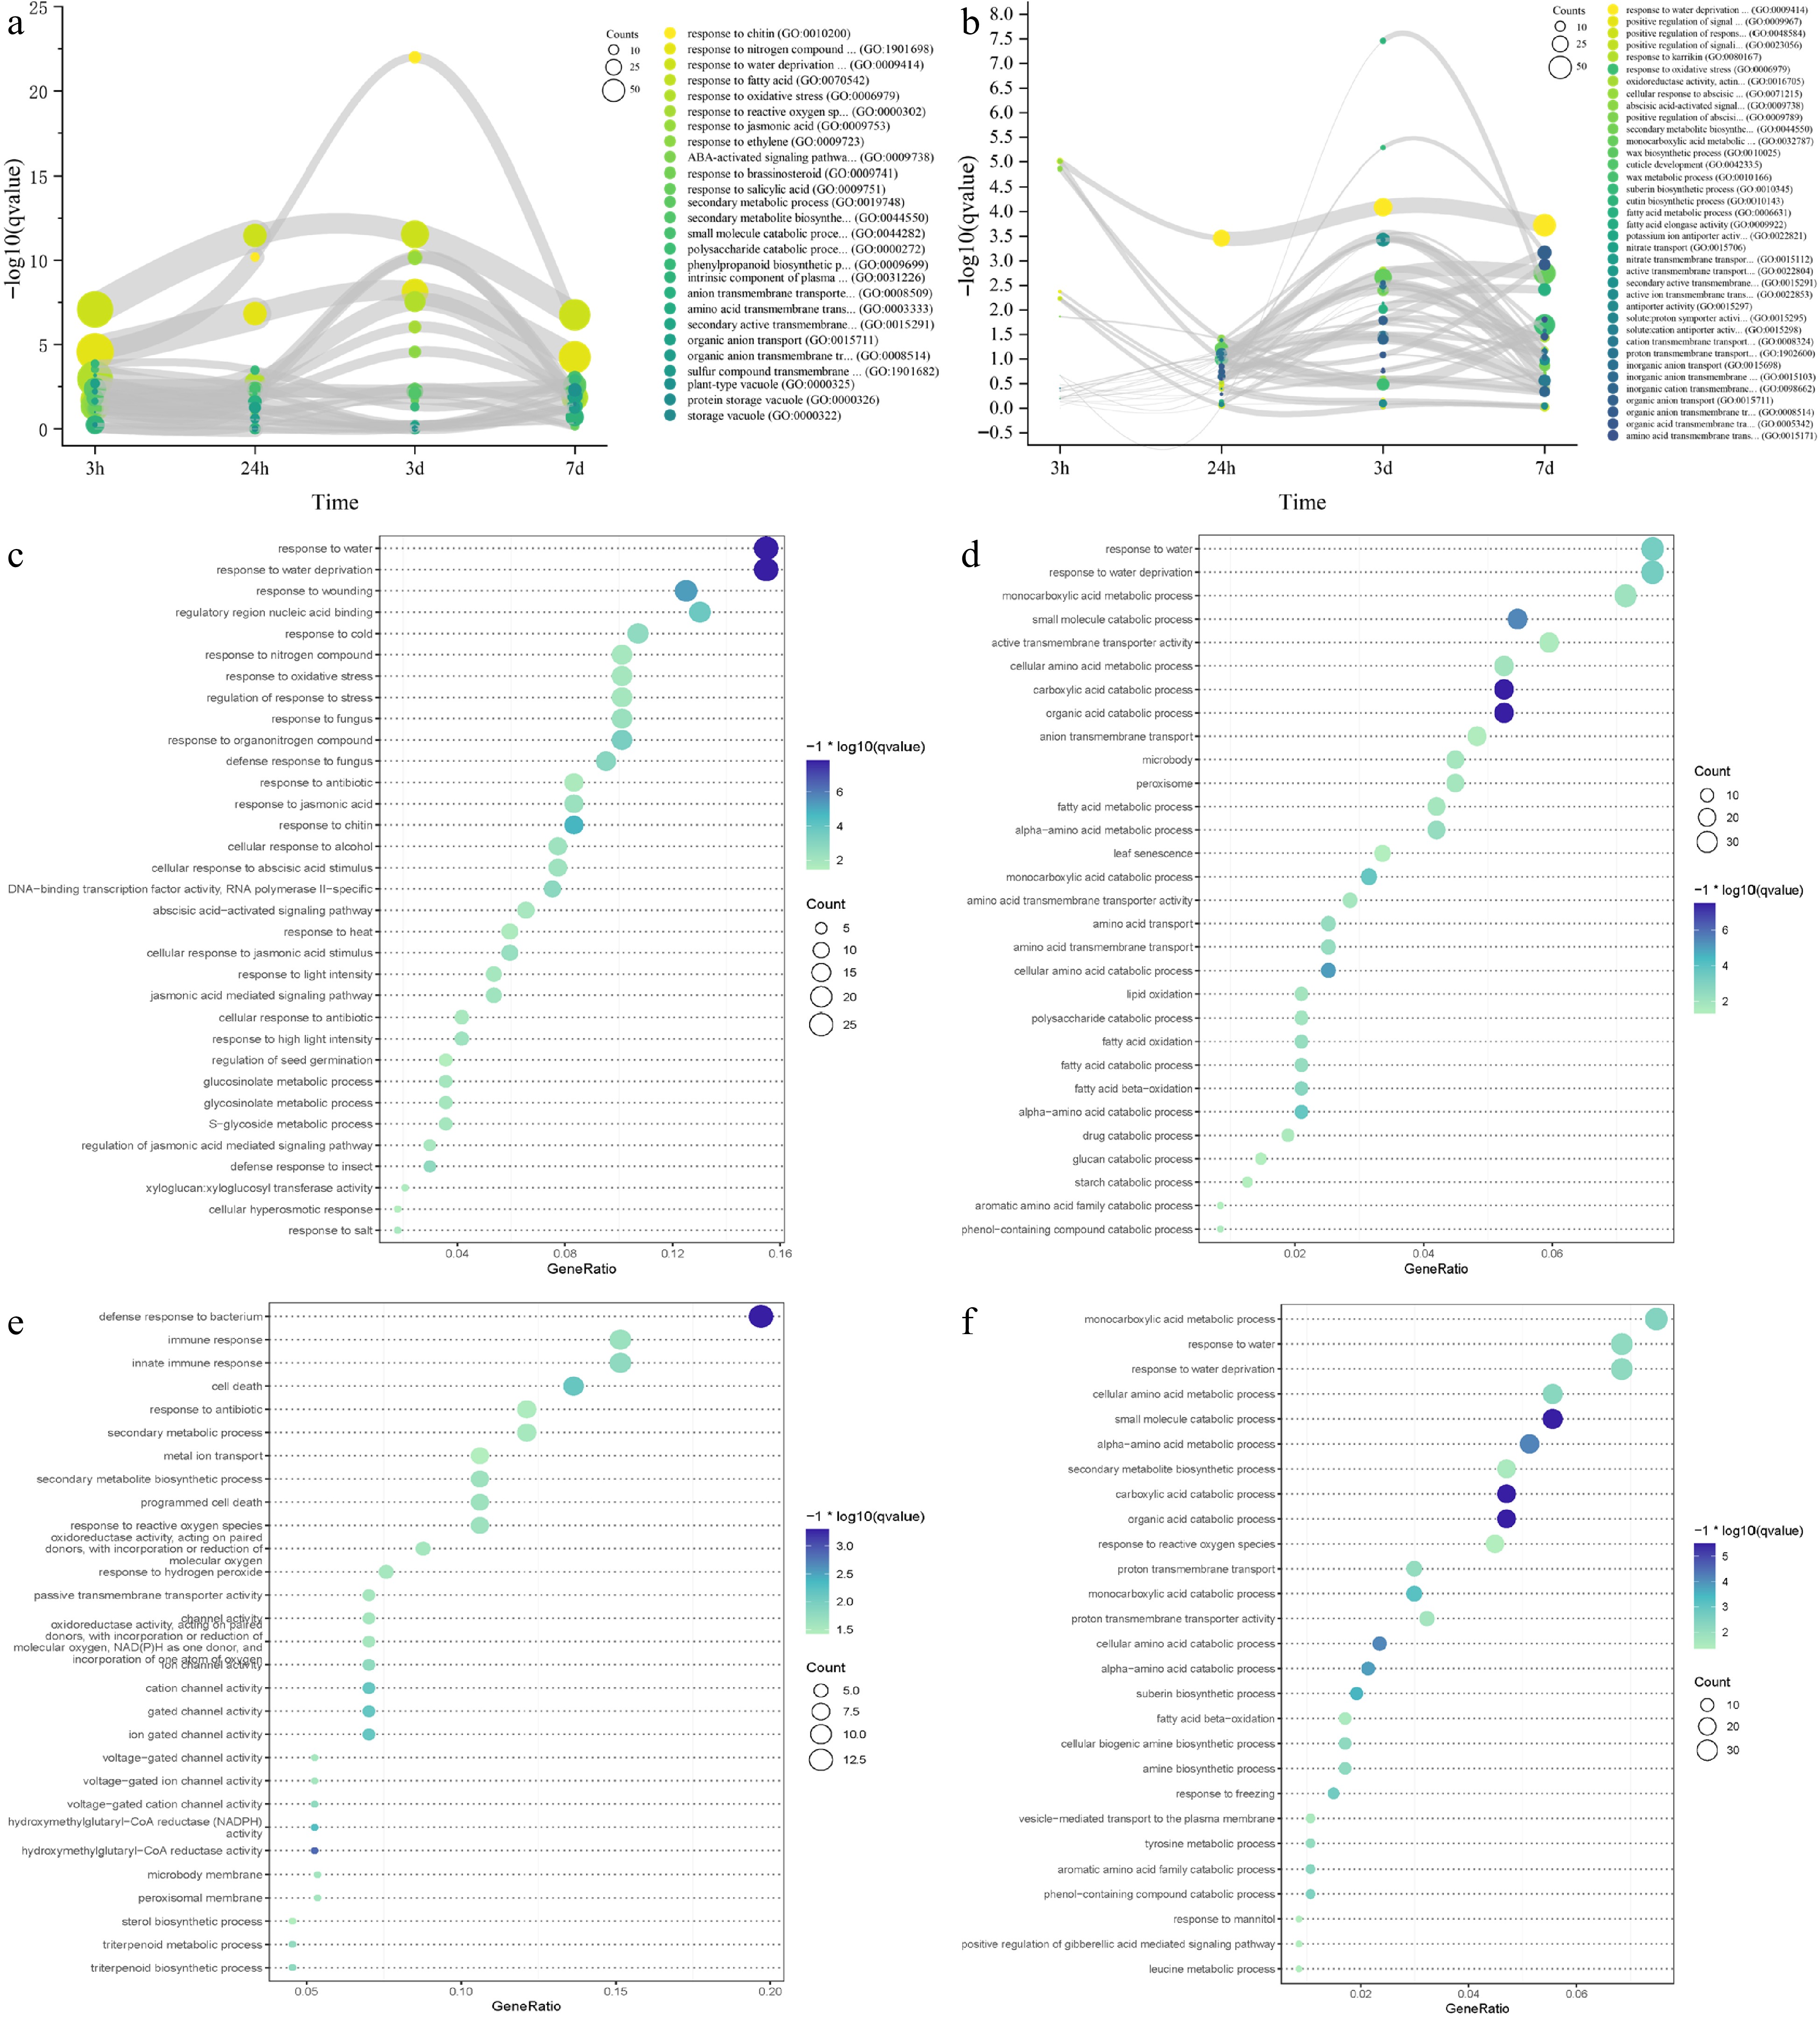
Figure 5.
Time-course RNA-seq analysis of IPC roots and leaves under salt treatment. (a, b) Gene ontology (GO) terms enriched in differentially expressed genes (DEGs) at 3 h, 24 h, 3 d, and 7 d of salt treatment in roots (a) and leaves (b). The circle size represents the number of DEGs, and the Y axis represents the p-value of the enrichment analysis. (c−f) Significantly enriched GO terms for transient-up (c, e) and transition-up (d, f) regulated genes in roots (c, d) and leaves (e, f) under salt treatment. Circle size indicates the number of DEGs used for enrichment analysis, and color indicates the significance of enrichment.
-
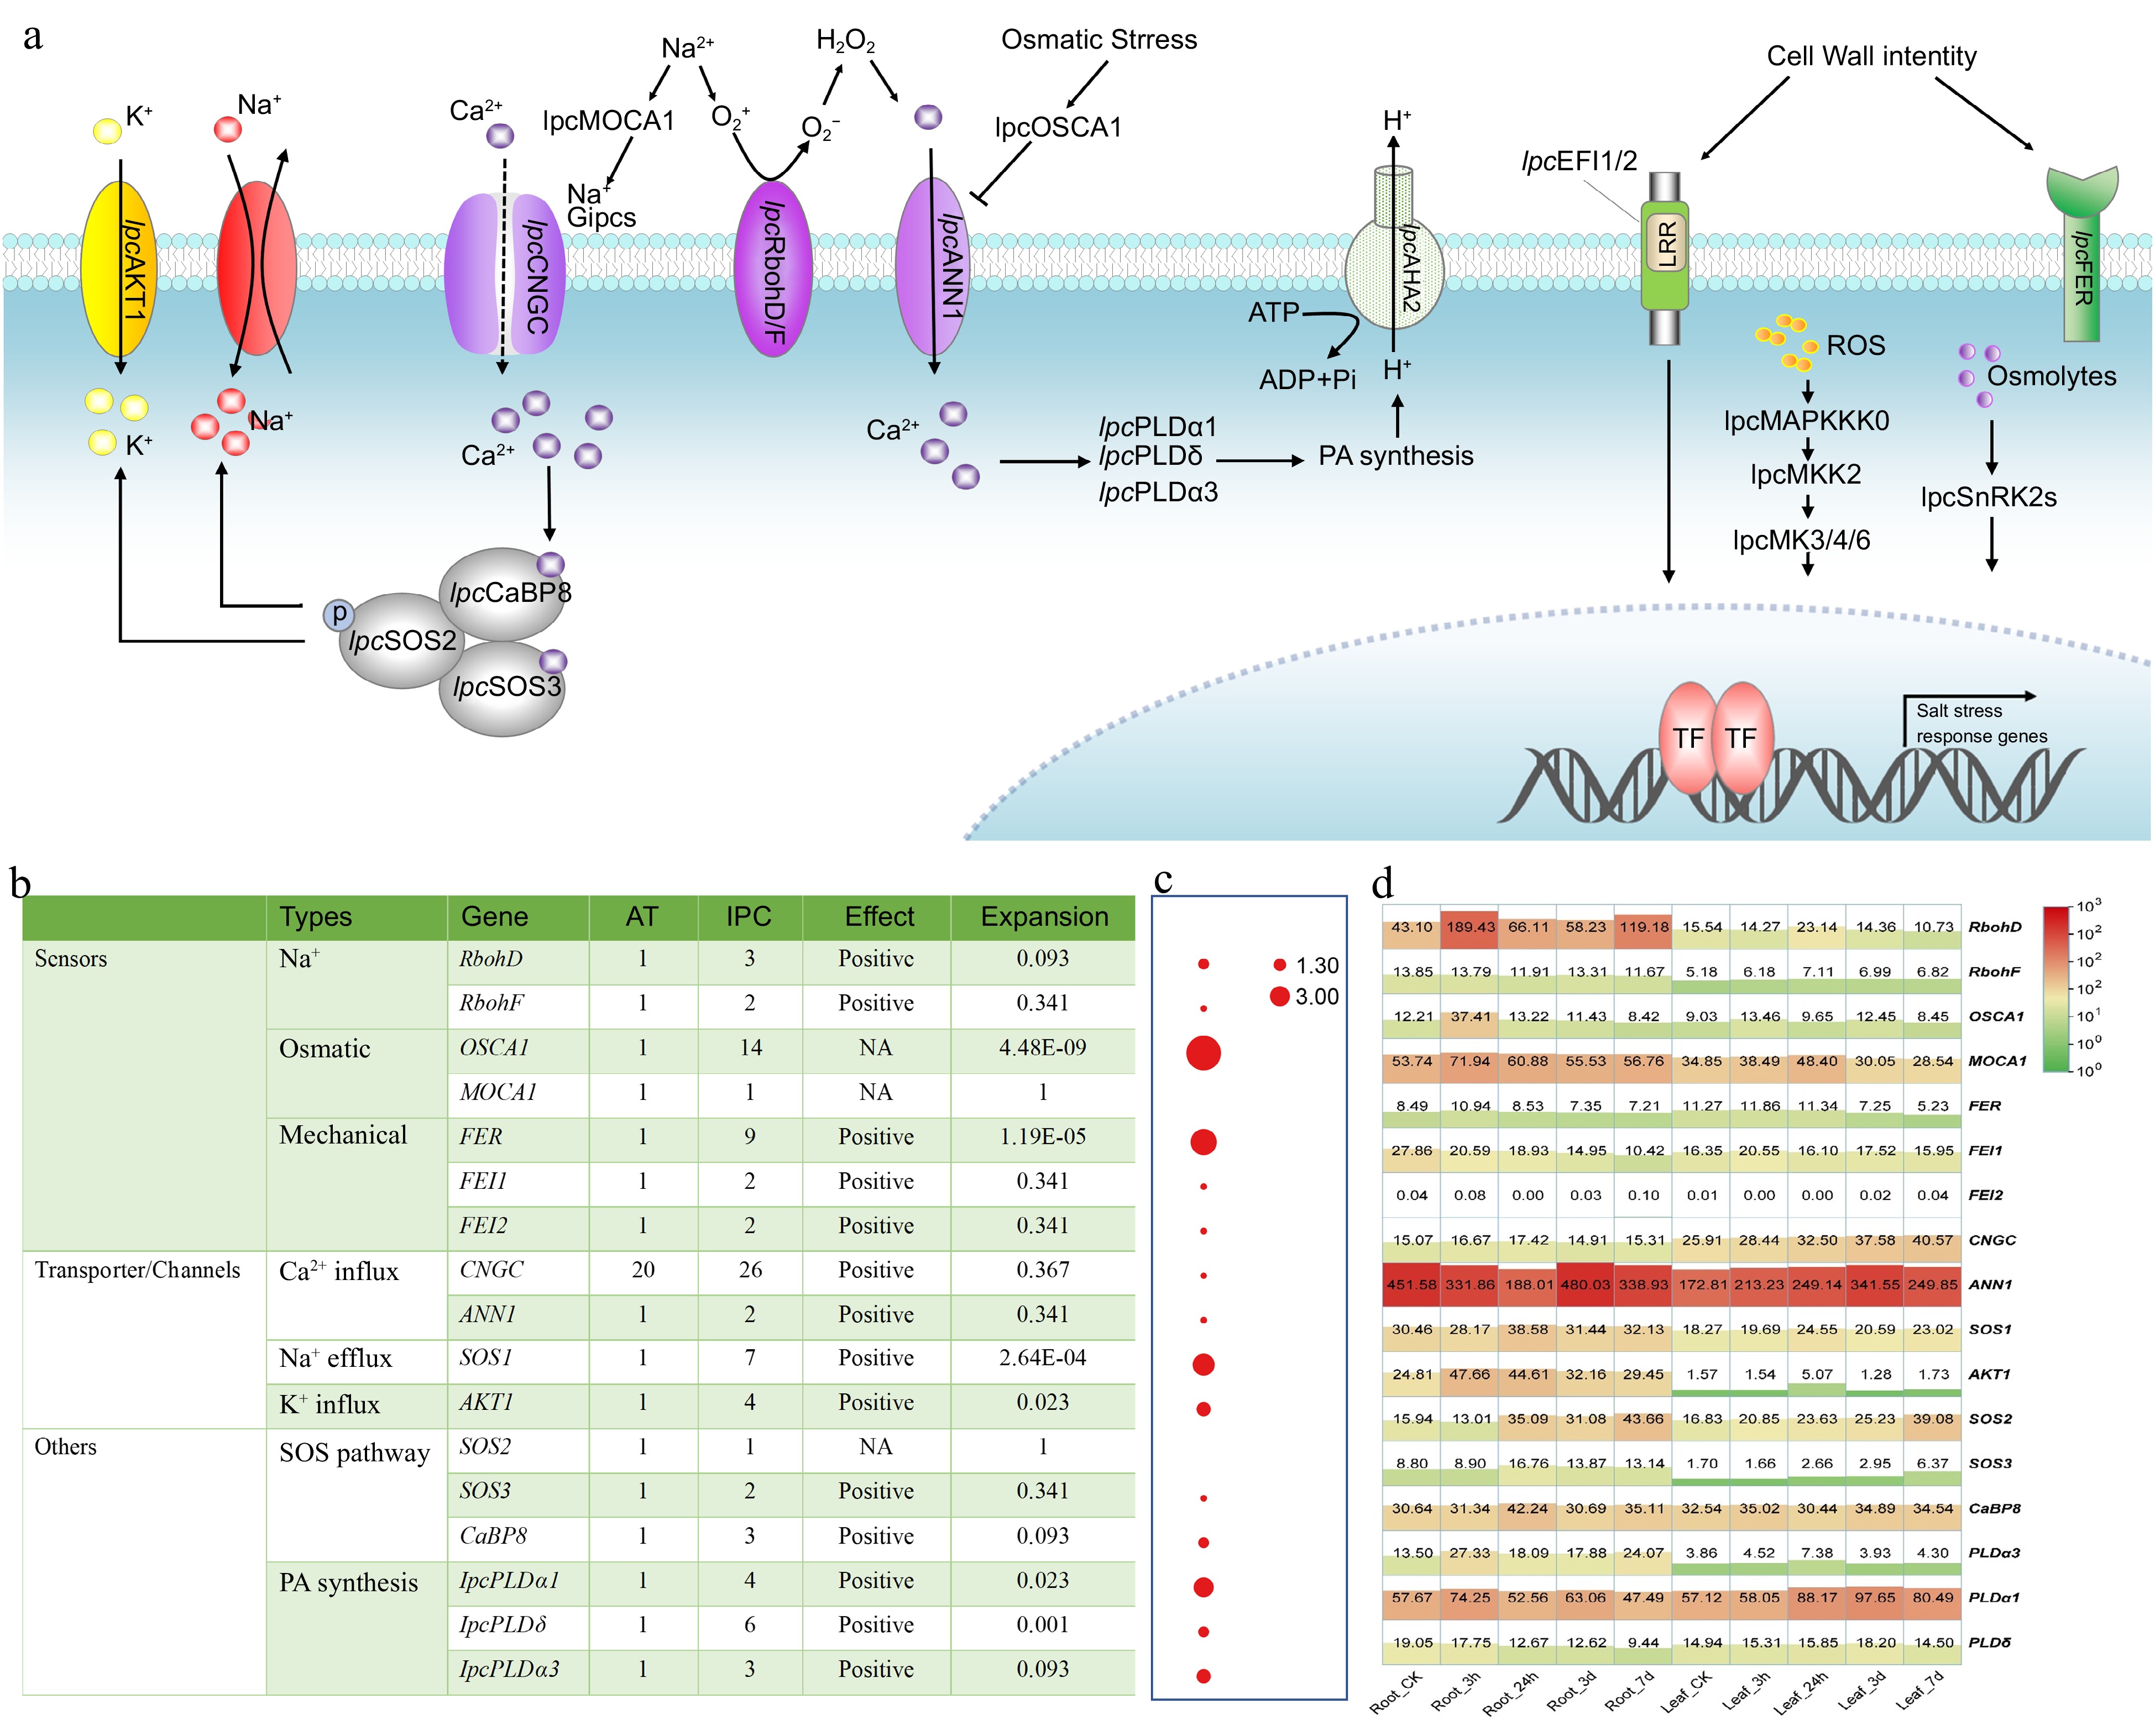
Figure 6.
Identification and expression of genes involved in stress perception, signal transduction, and responses to salinity in IPC. (a) Schematic model of the putative mechanisms of salinity perception, signal transduction, and response in IPC. (b) The number of genes involved in these processes identified in IPC and a comparison of gene numbers with Arabidopsis. (c) Significance of gene expansion in IPC compared to its relatives. (d) Expression levels of the genes involved in stress perception, signal transduction, and response in roots and leaves at different time points under salt treatment. Gene expansion in IPC is denoted by a significant, corrected p-value (p < 0.01), determined through a Chi-square test for overrepresentation, using all annotated genes as the background.
-
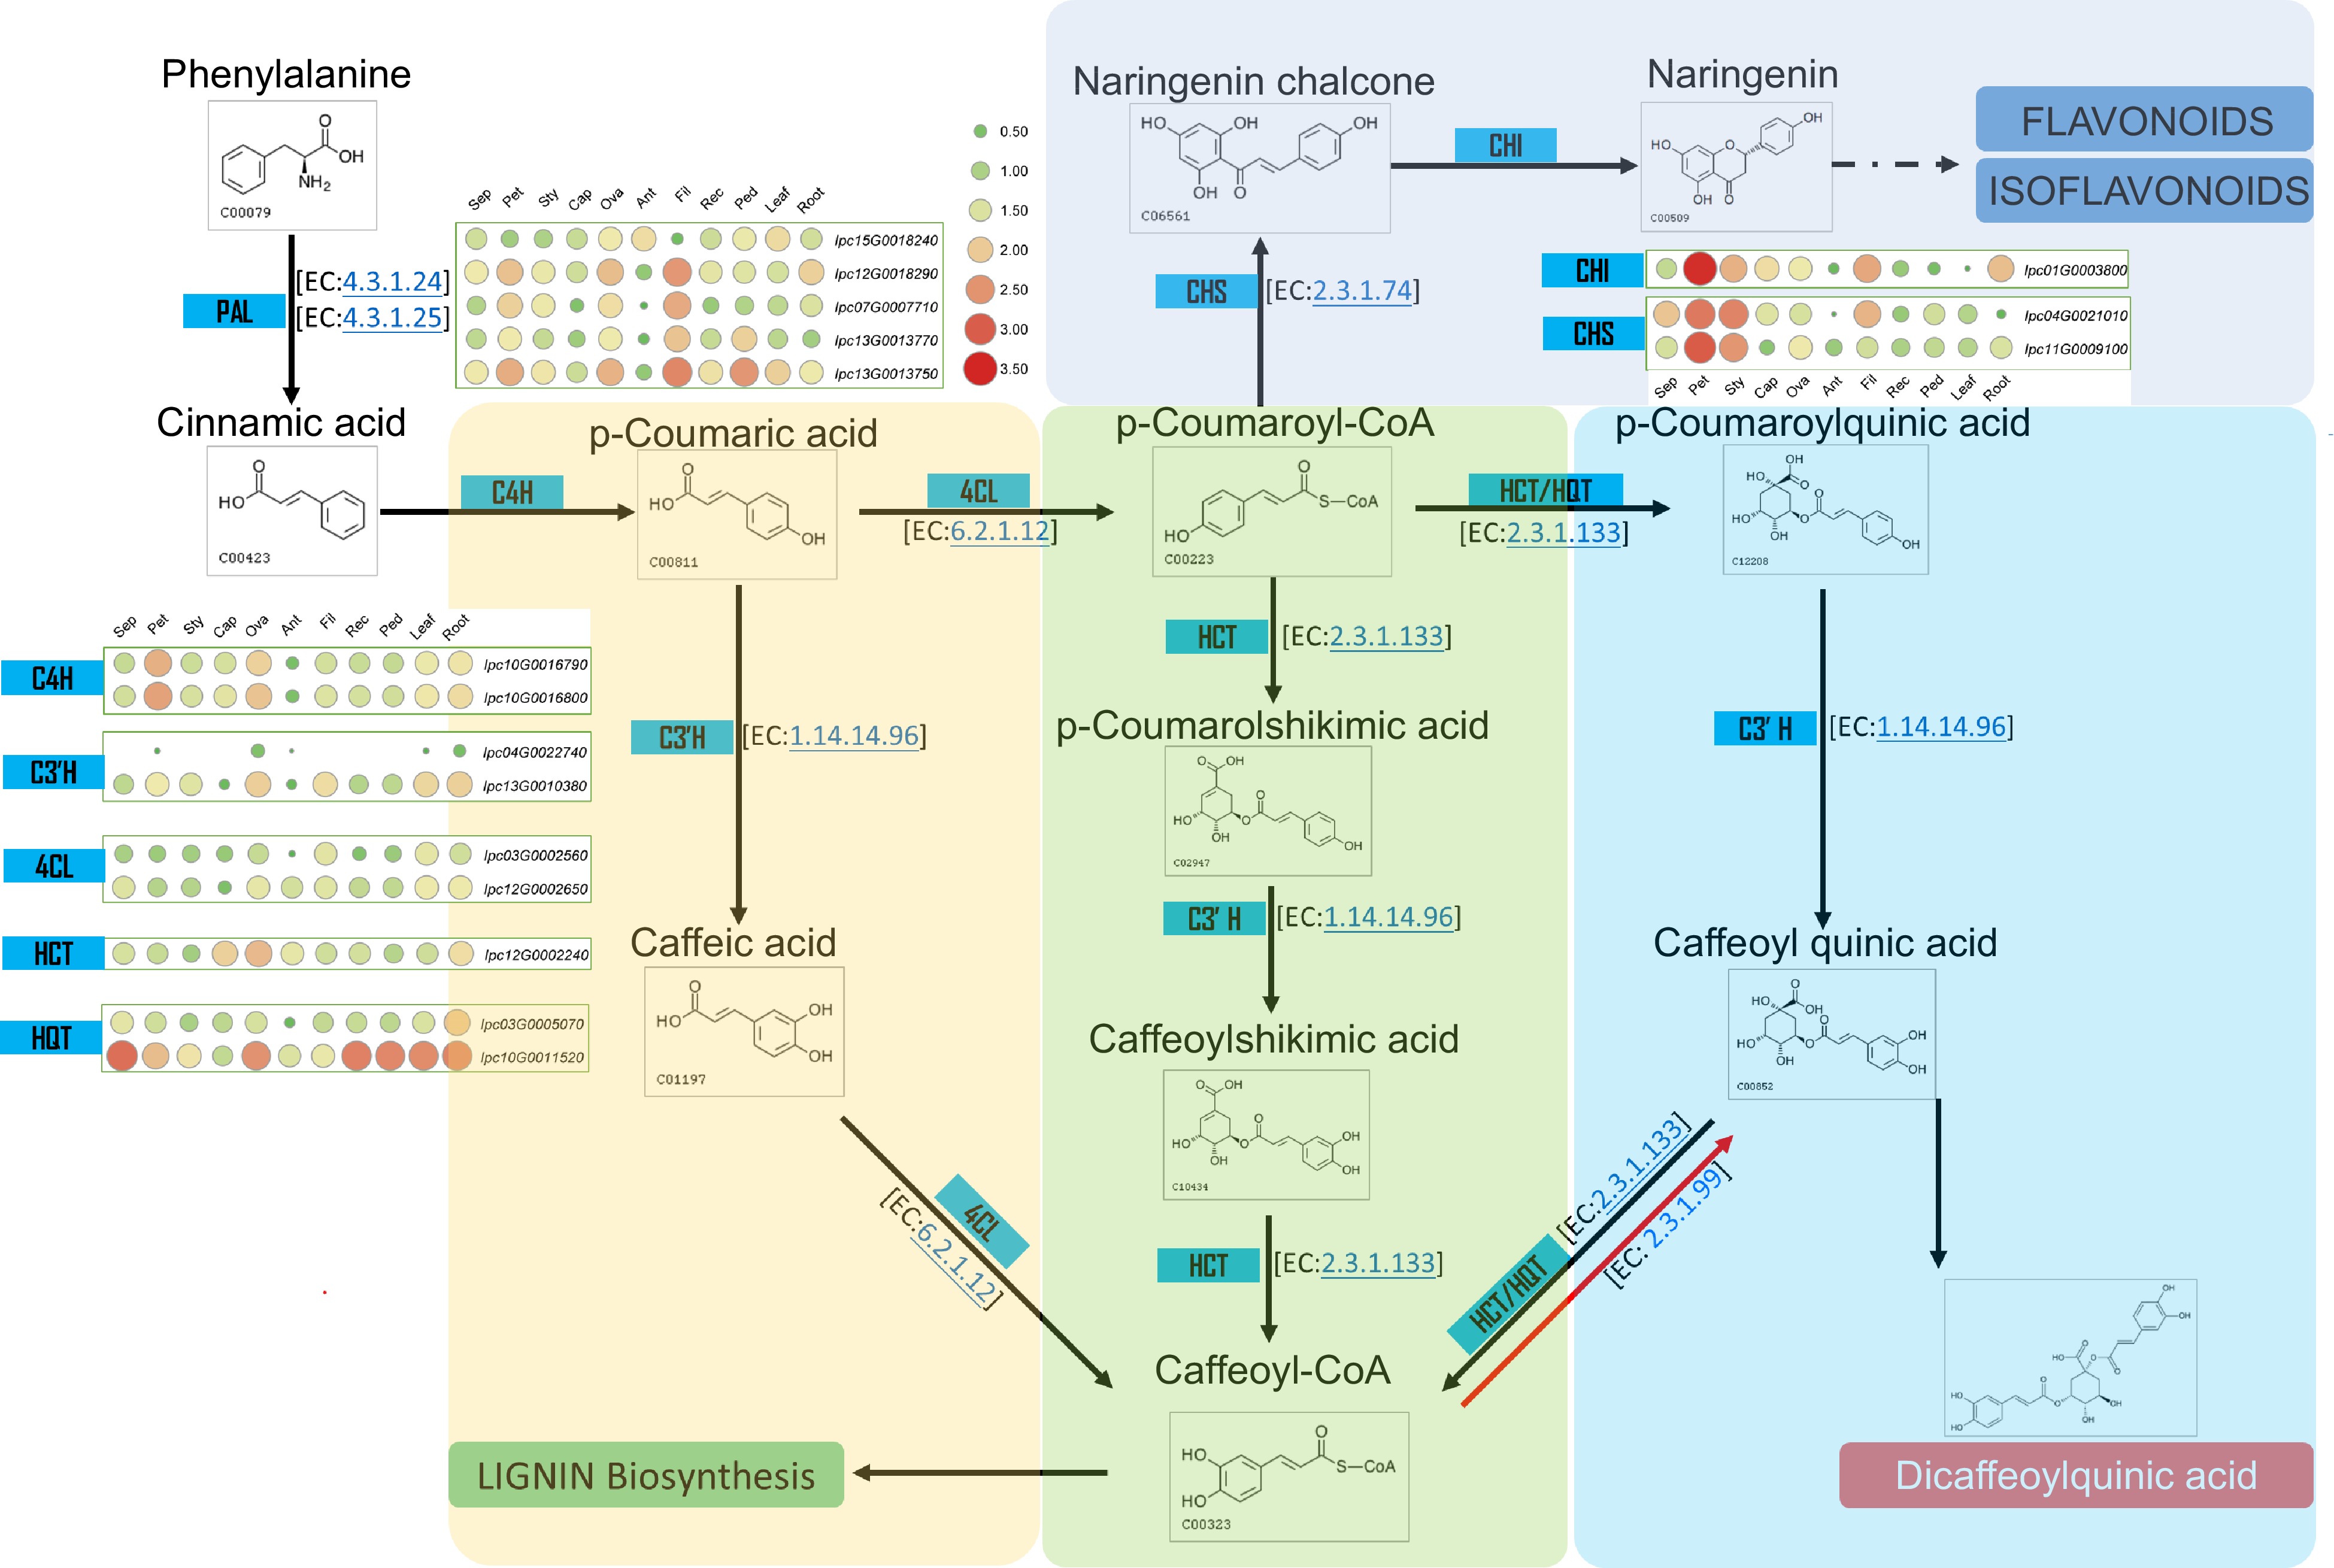
Figure 7.
Metabolic pathway and gene expression in CQA metabolism. This figure illustrates the metabolic pathway for CQA synthesis and displays the expression levels of genes encoding the relevant enzymes in various IPC tissues (Sep: sepal, Pet: petal, Sty: stigma, Cap: carpel, Ova: ovary, Ant: anther, Fil: filament, Rec: receptacle, Ped: pedicel).
-
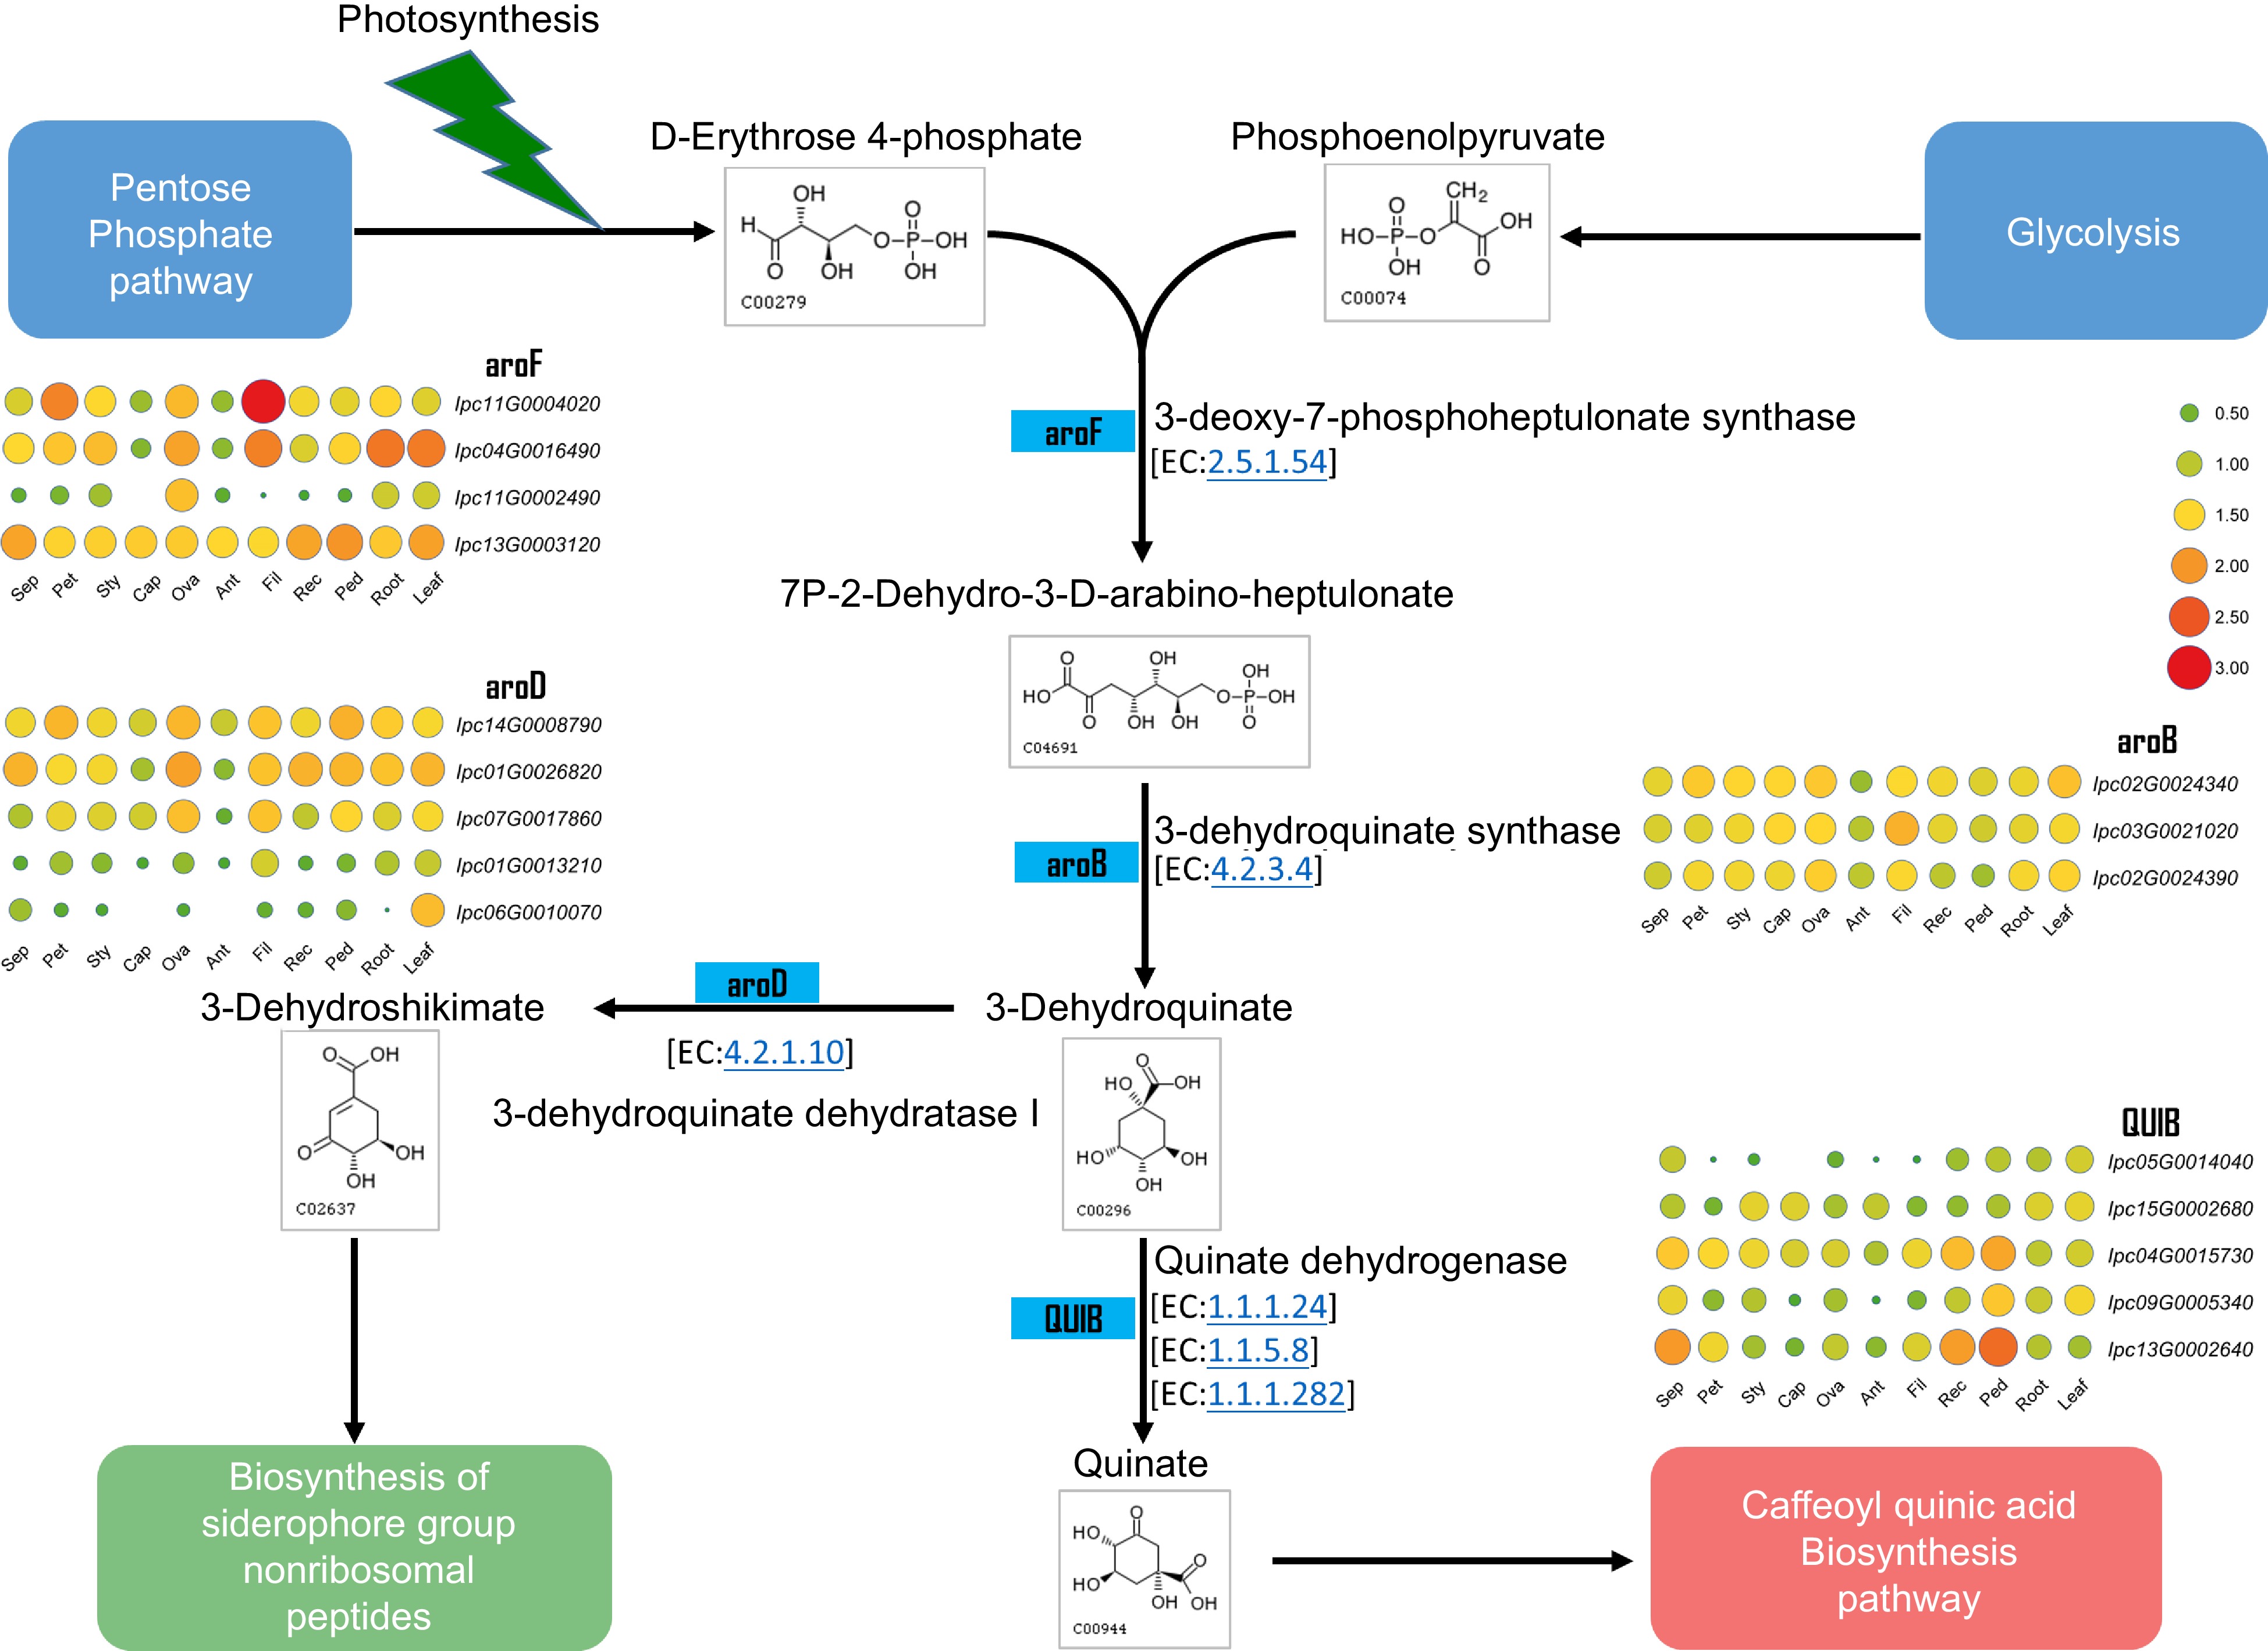
Figure 8.
Metabolic pathway and gene expression in quinate metabolism. This figure illustrates the metabolic pathway for quinate synthesis and displays the expression levels of genes encoding the relevant enzymes in various IPC tissues (Sep: sepal, Pet: petal, Sty: stigma, Cap: carpel, Ova: ovary, Ant: anther, Fil: filament, Rec: receptacle, Ped: pedicel).
-
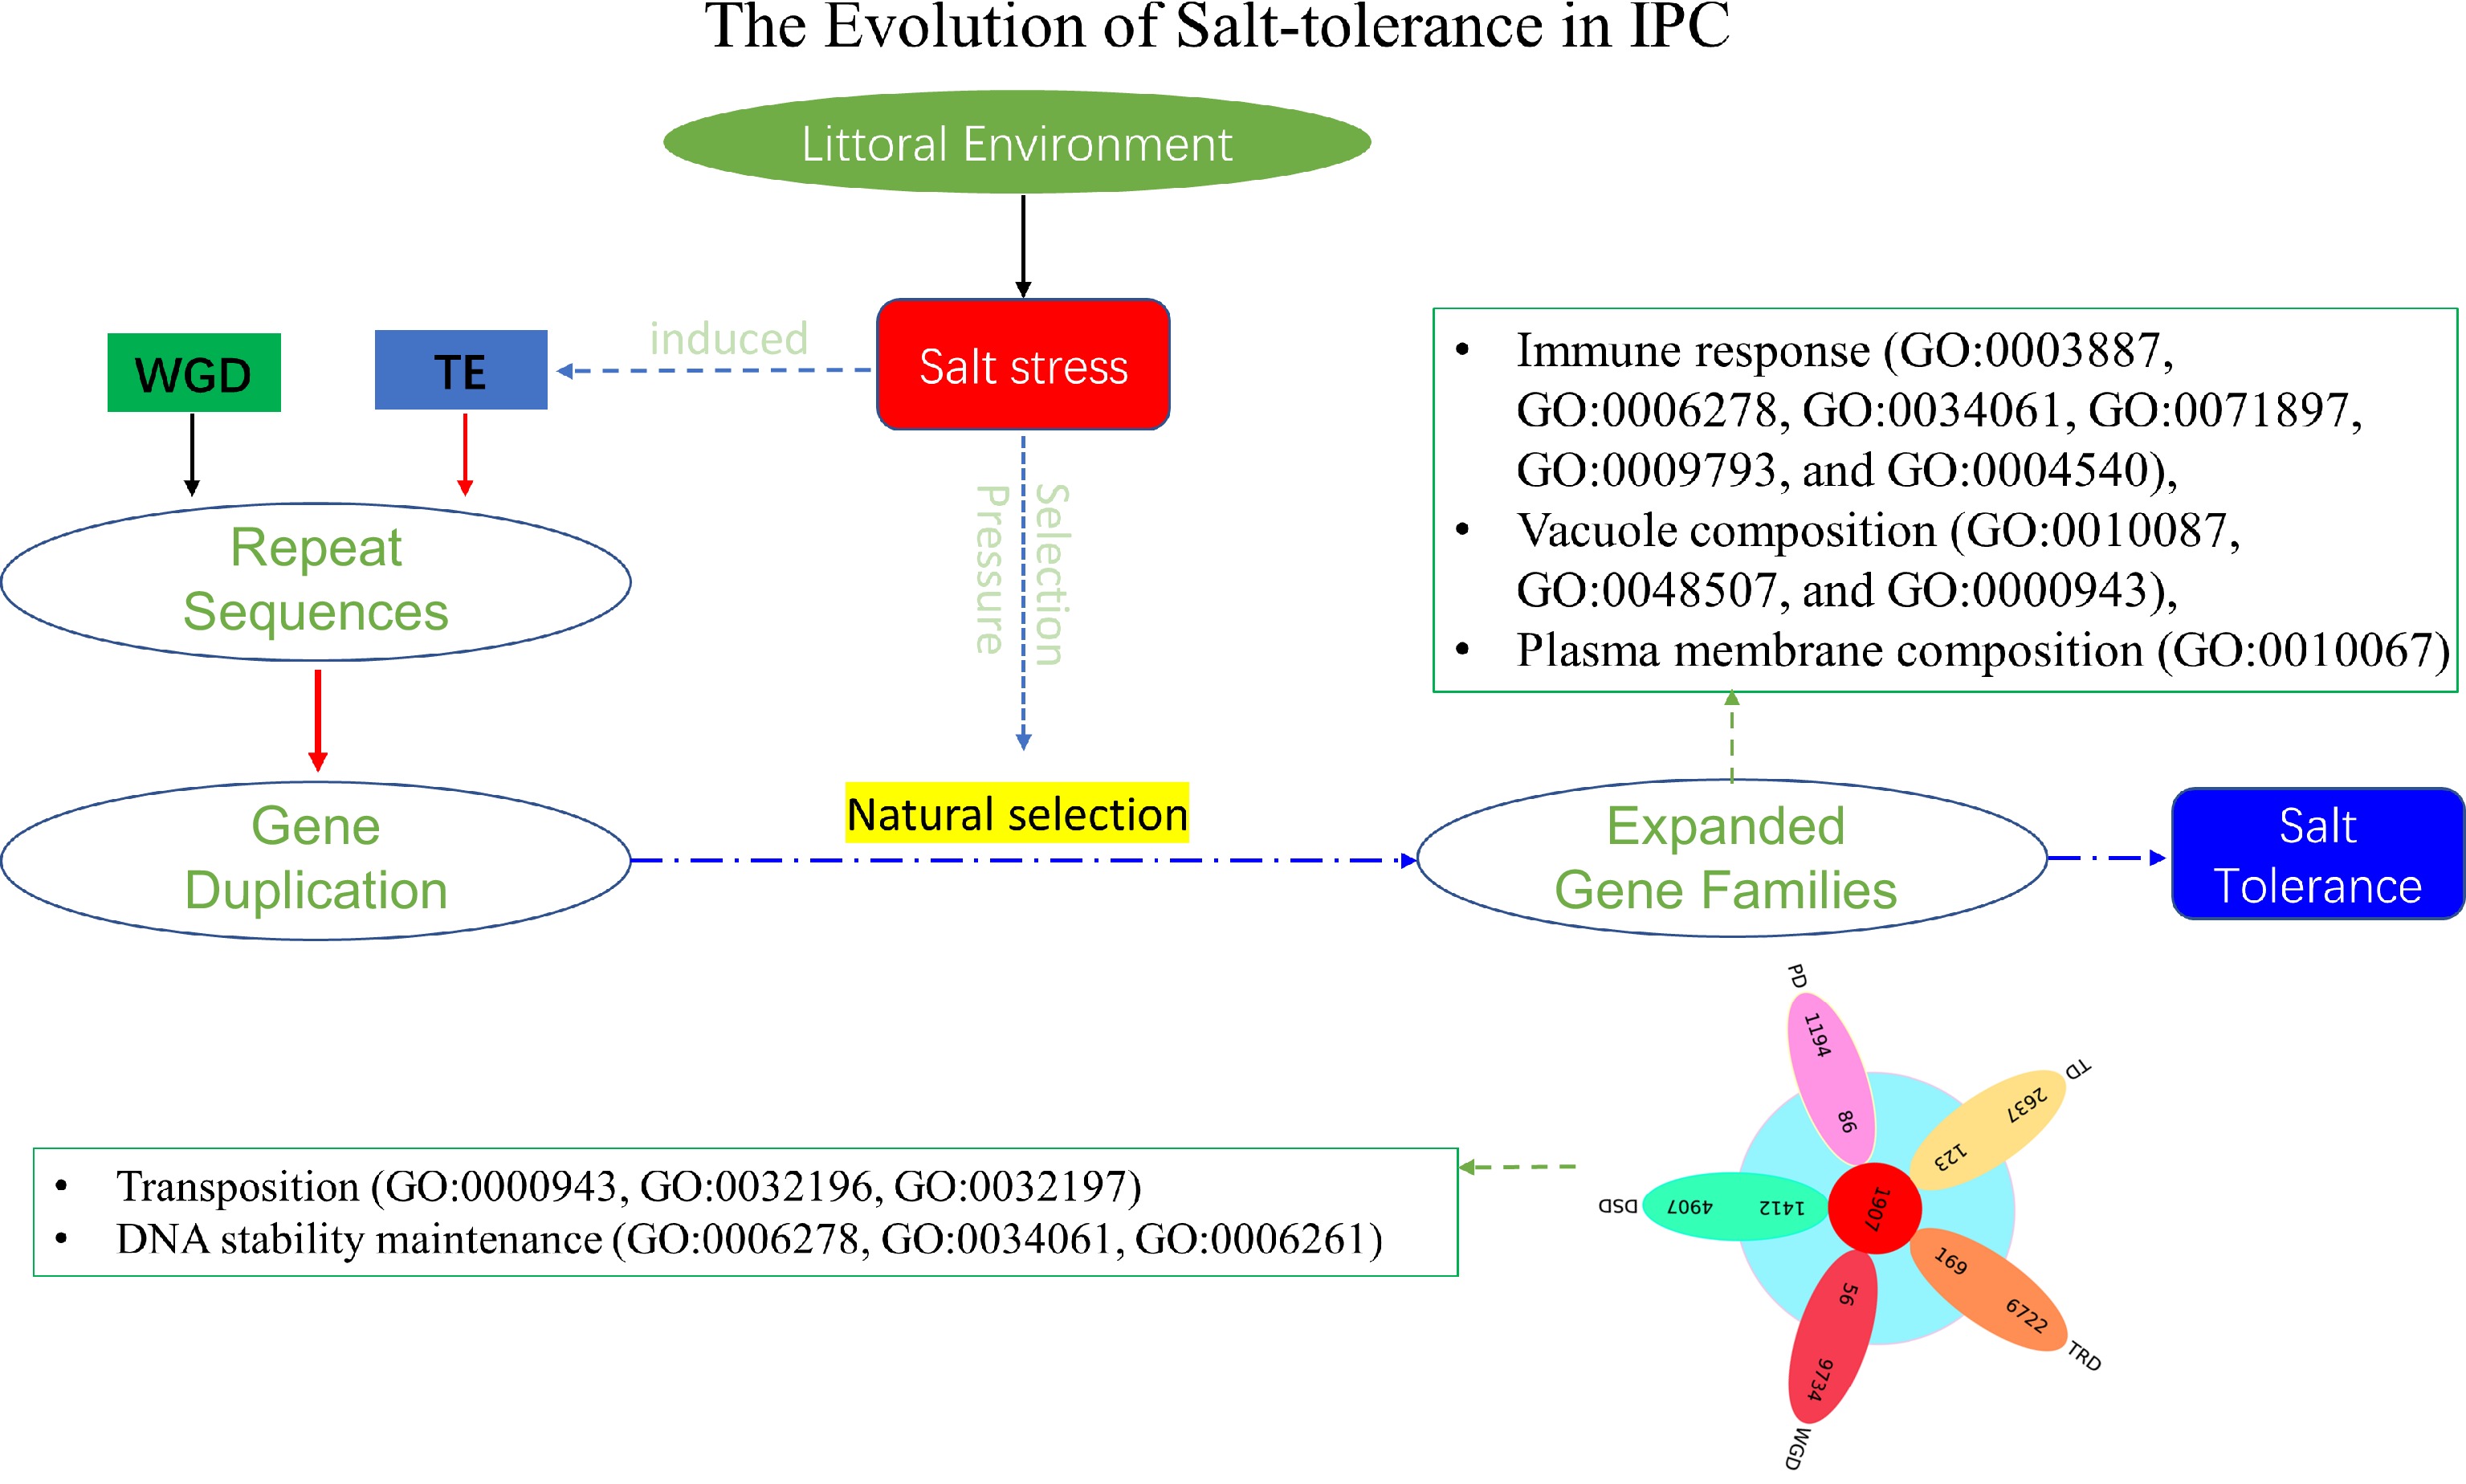
Figure 9.
The evolution of salt tolerance in IPC. The diagram illustrates the proposed mechanism of salt tolerance development as revealed by this study. Over a lengthy process of evolution, salt stress induces transposition events, resulting in repetitive gene duplications at the genomic level. These duplicated genes act as the raw materials for evolution. Furthermore, salt stress functions as a selective pressure, preserving genes that confer advantages in terms of salt tolerance through extended periods of natural selection. Most of these expanded genes contribute significantly to the salt tolerance of IPC. The listed GOs represent the enriched Gene Ontology categories associated with the significantly expanded genes, as well as the DSD-type significantly expanded genes in IPC compared to its salt-intolerant relatives.
Figures
(9)
Tables
(0)