-
-
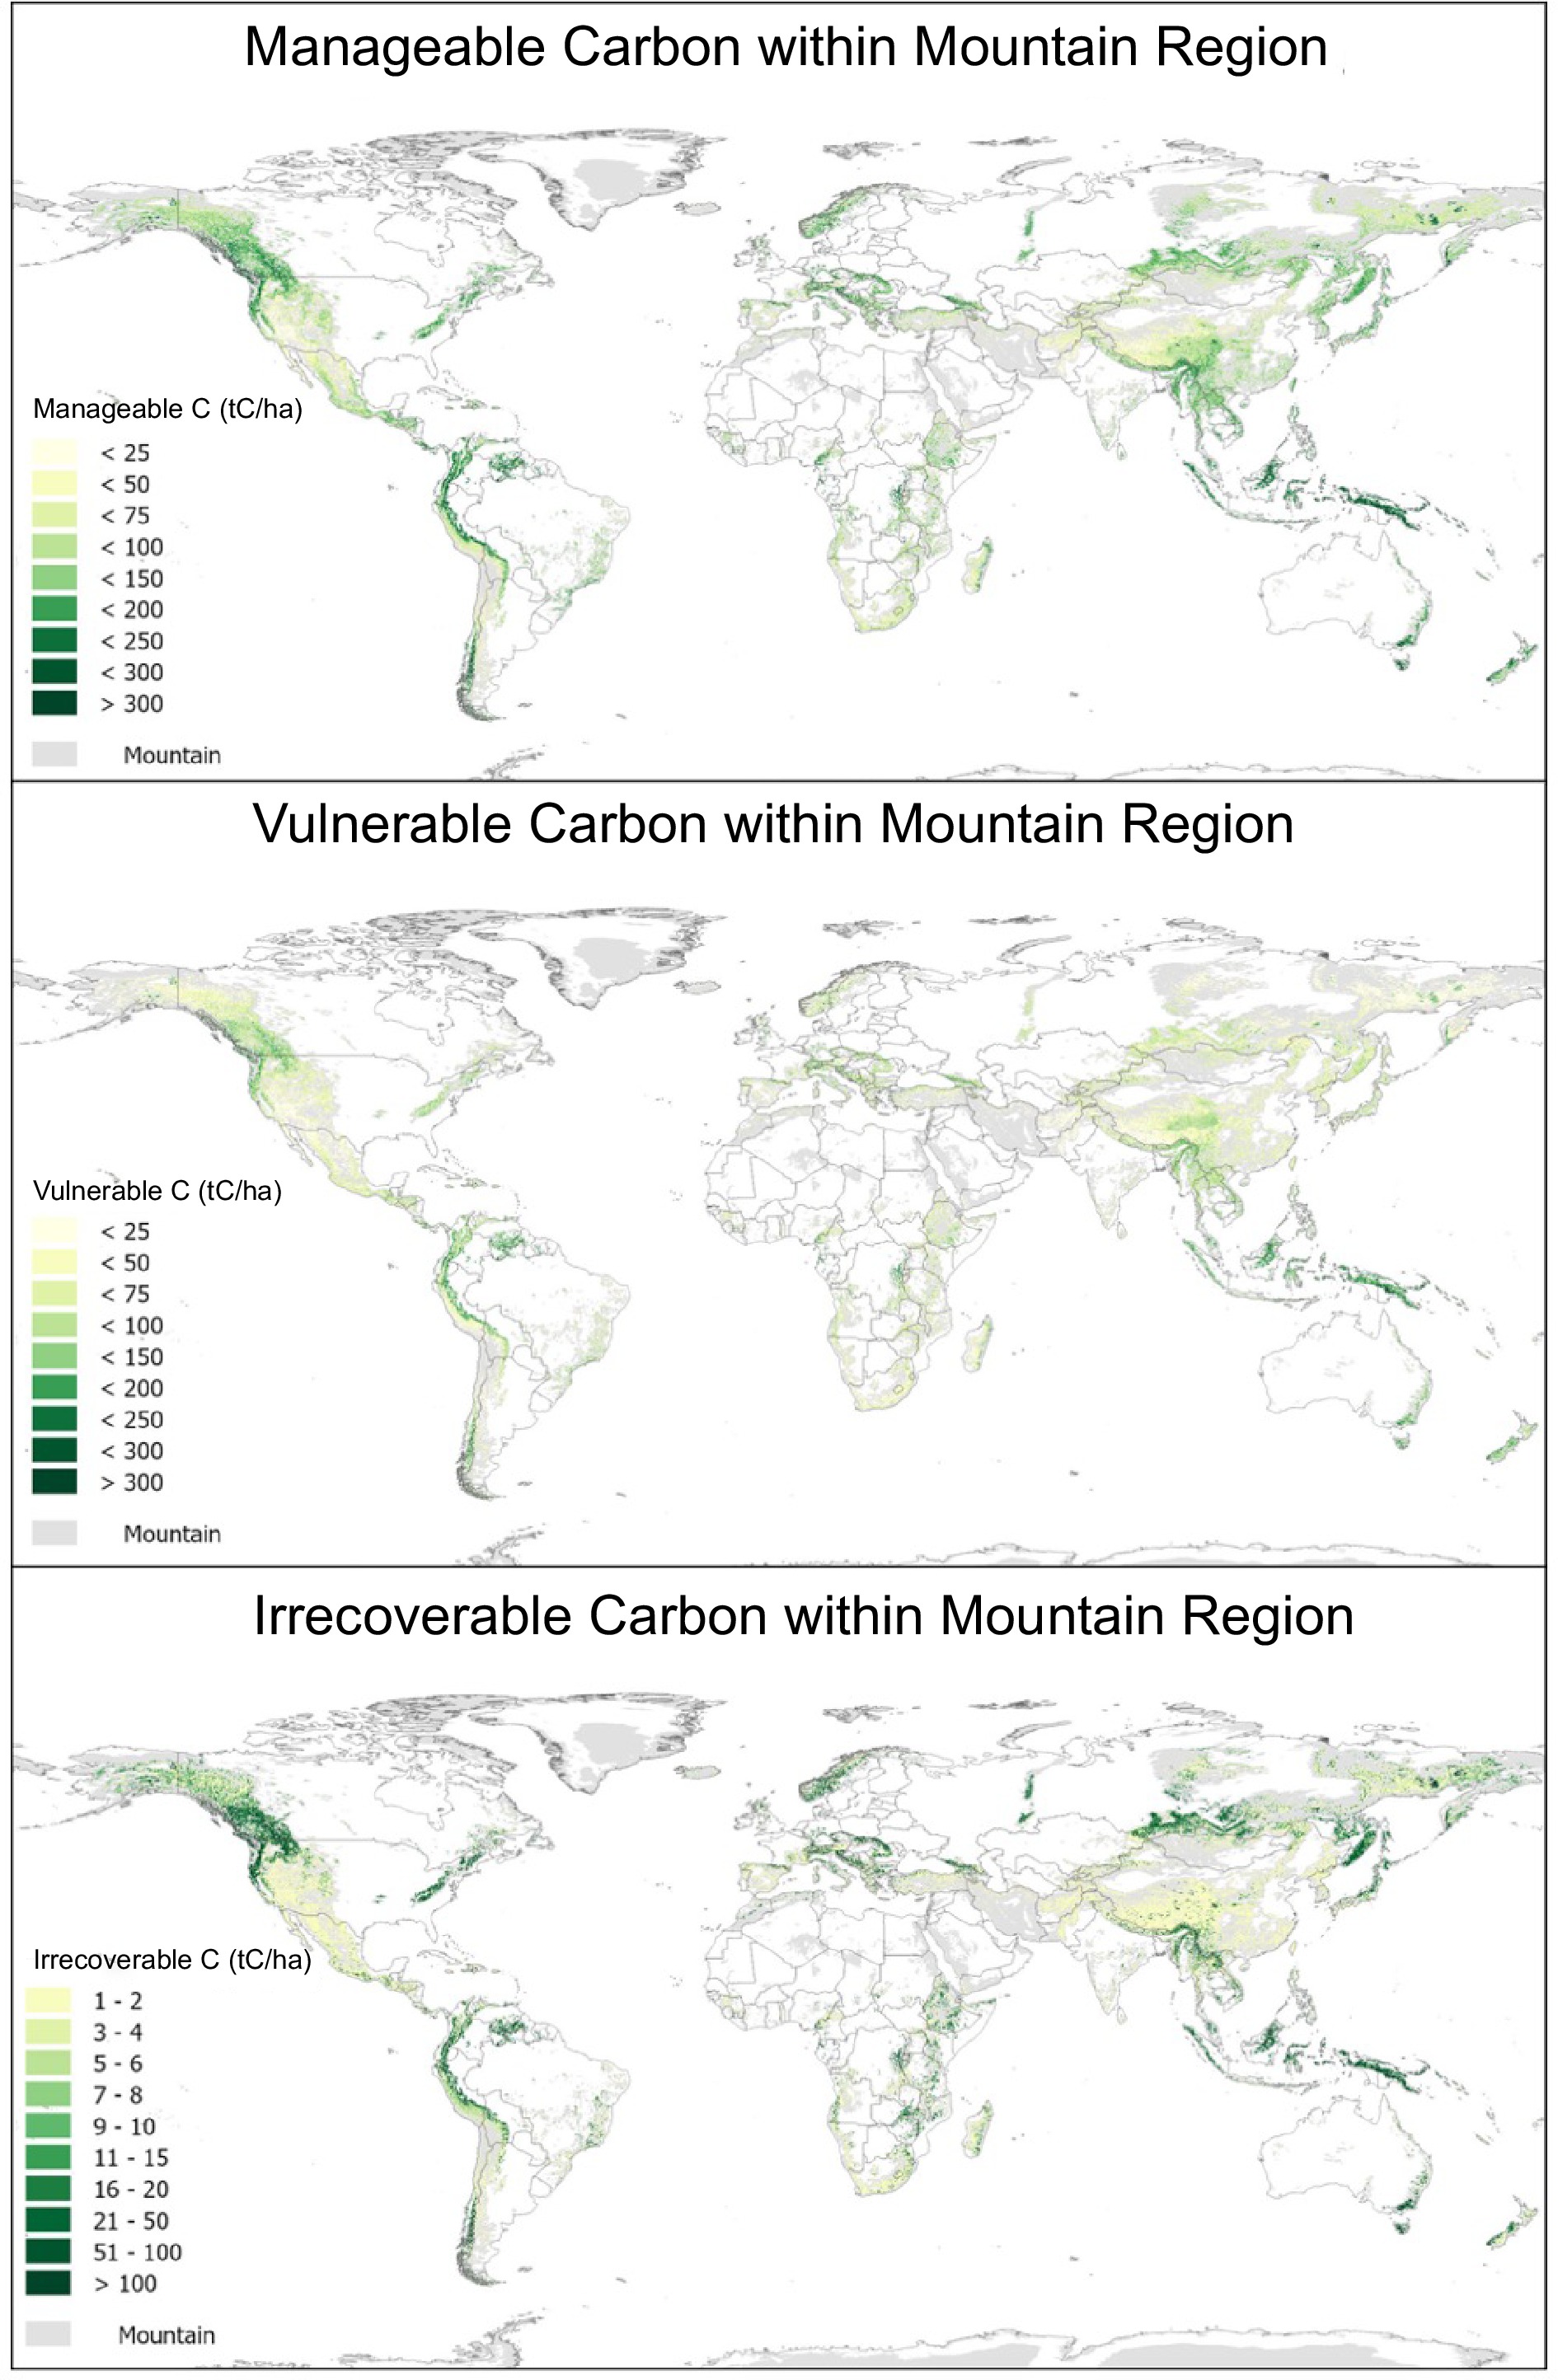
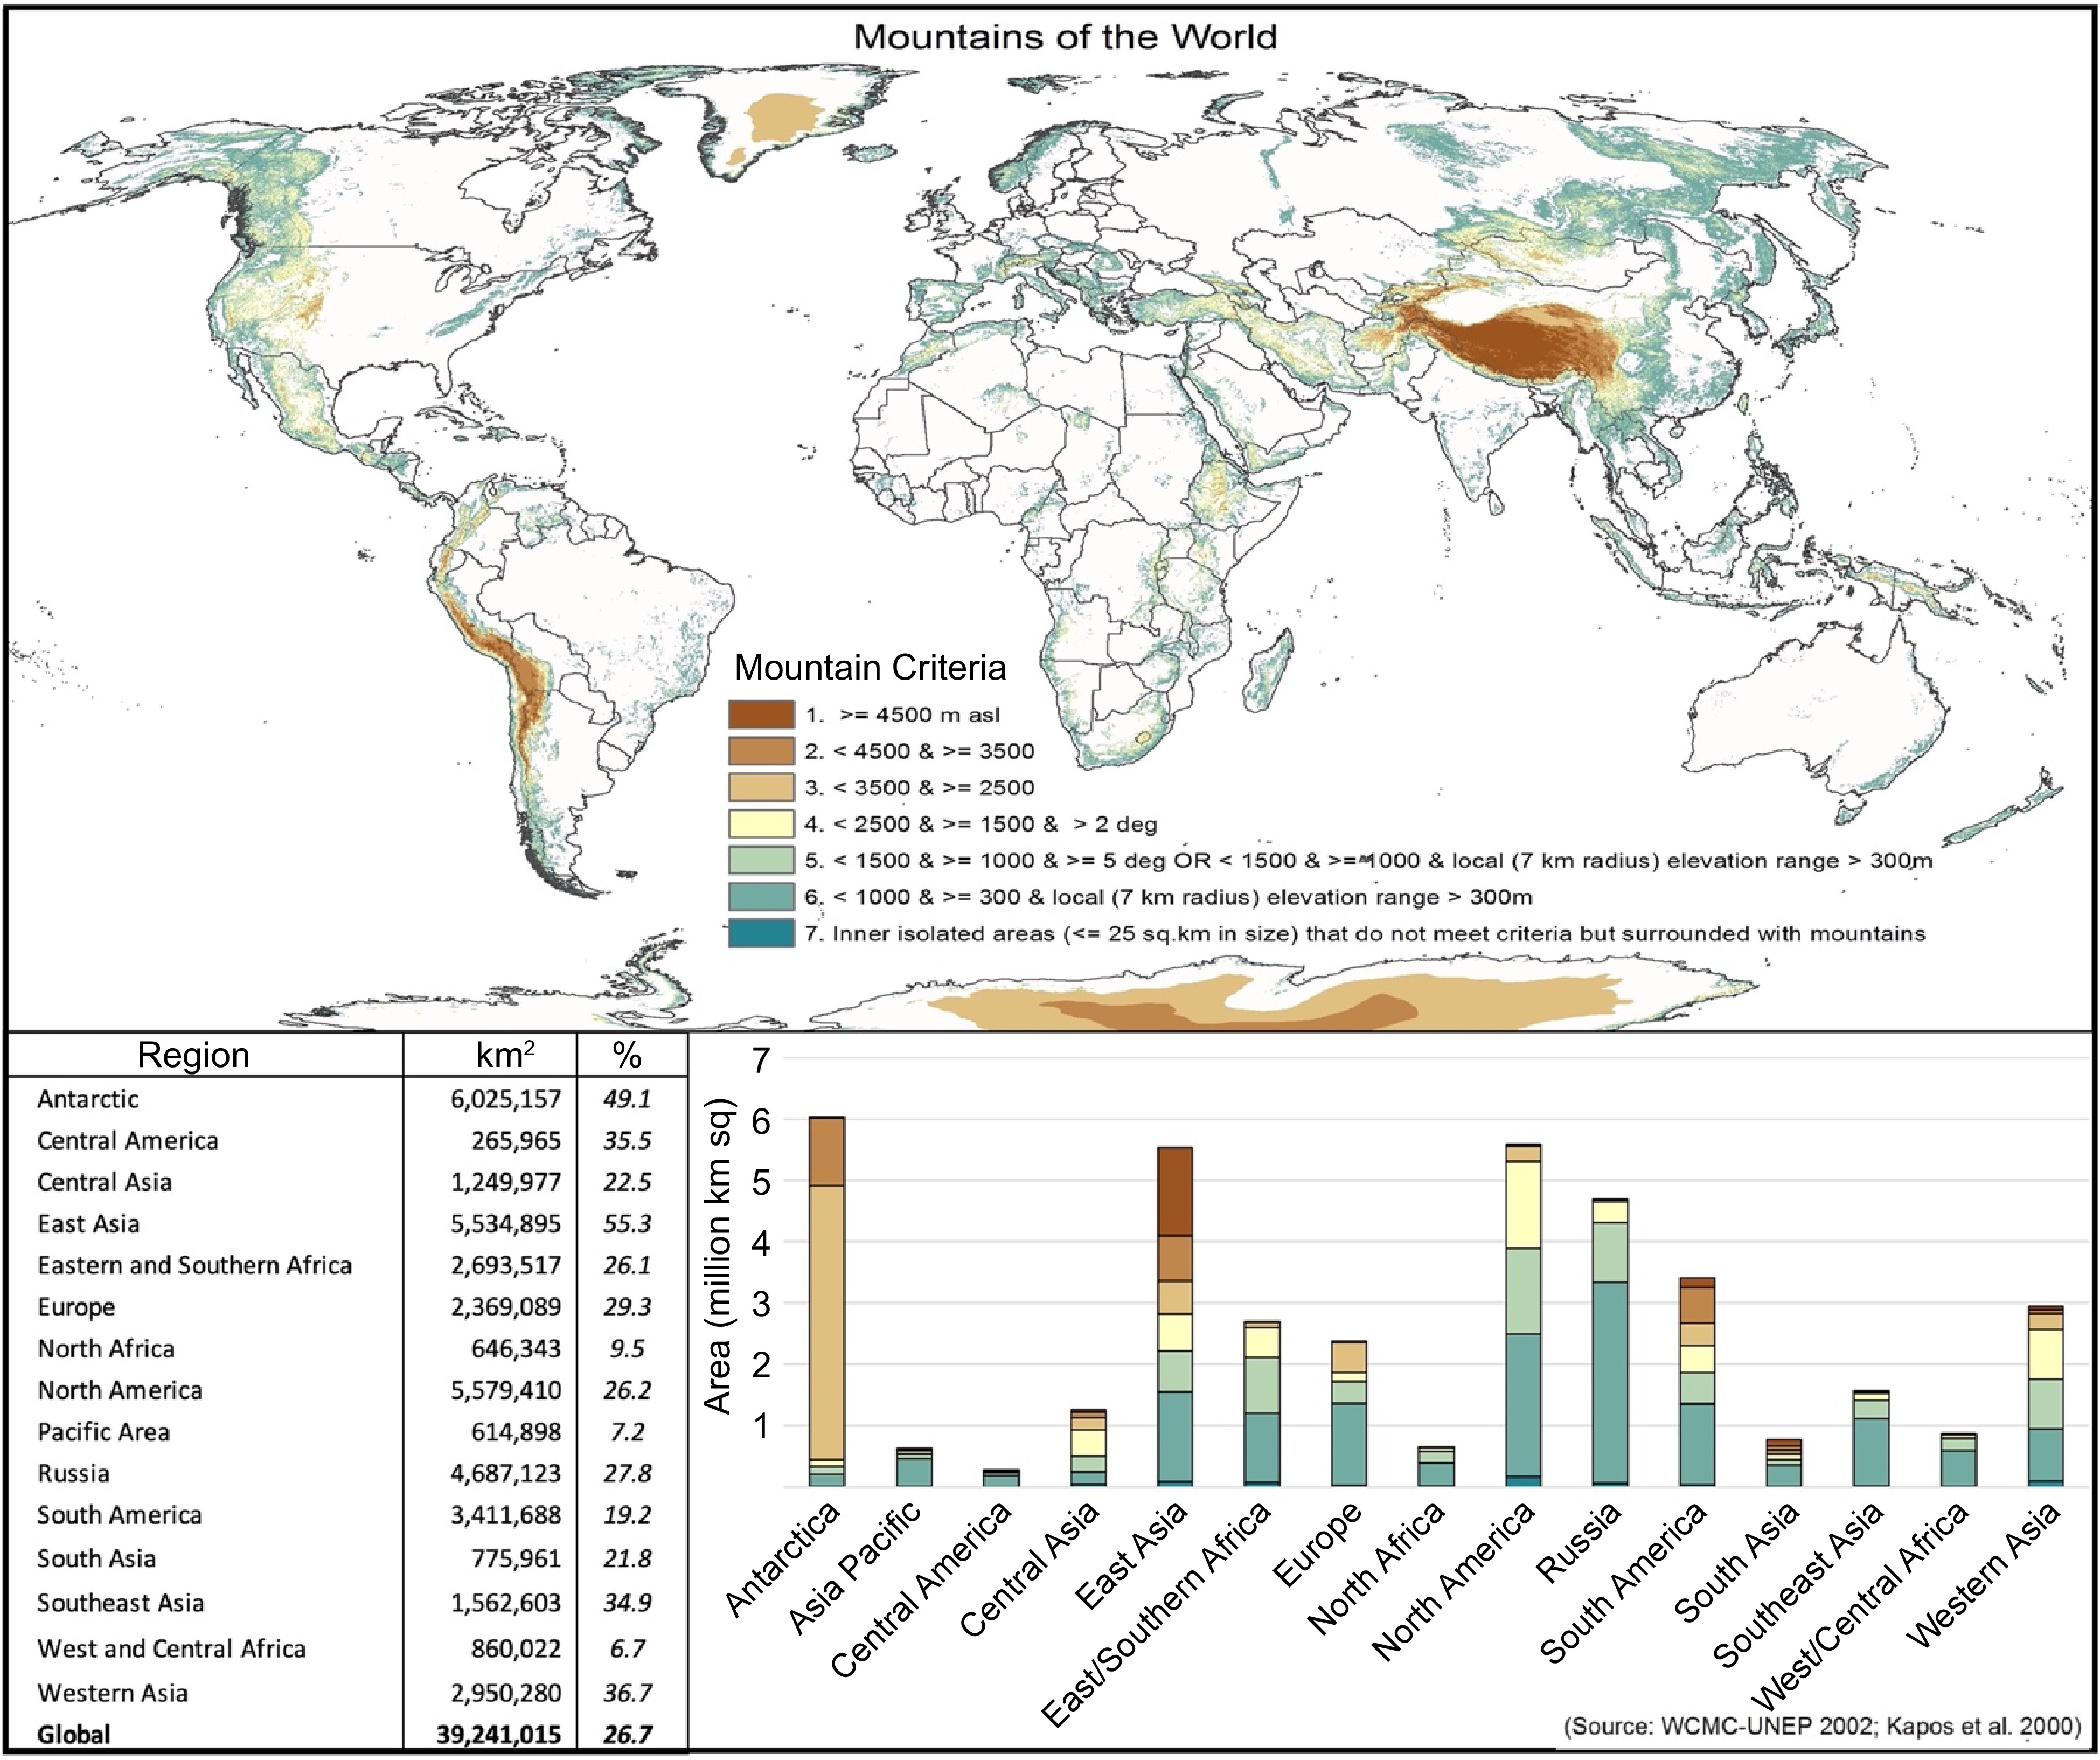
Figure 2.
Manageable, vulnerable, and irrecoverable carbon with mountainous regions, in tons of carbon per hectare (tC·ha−1), as per the year 2018[18].
-
-
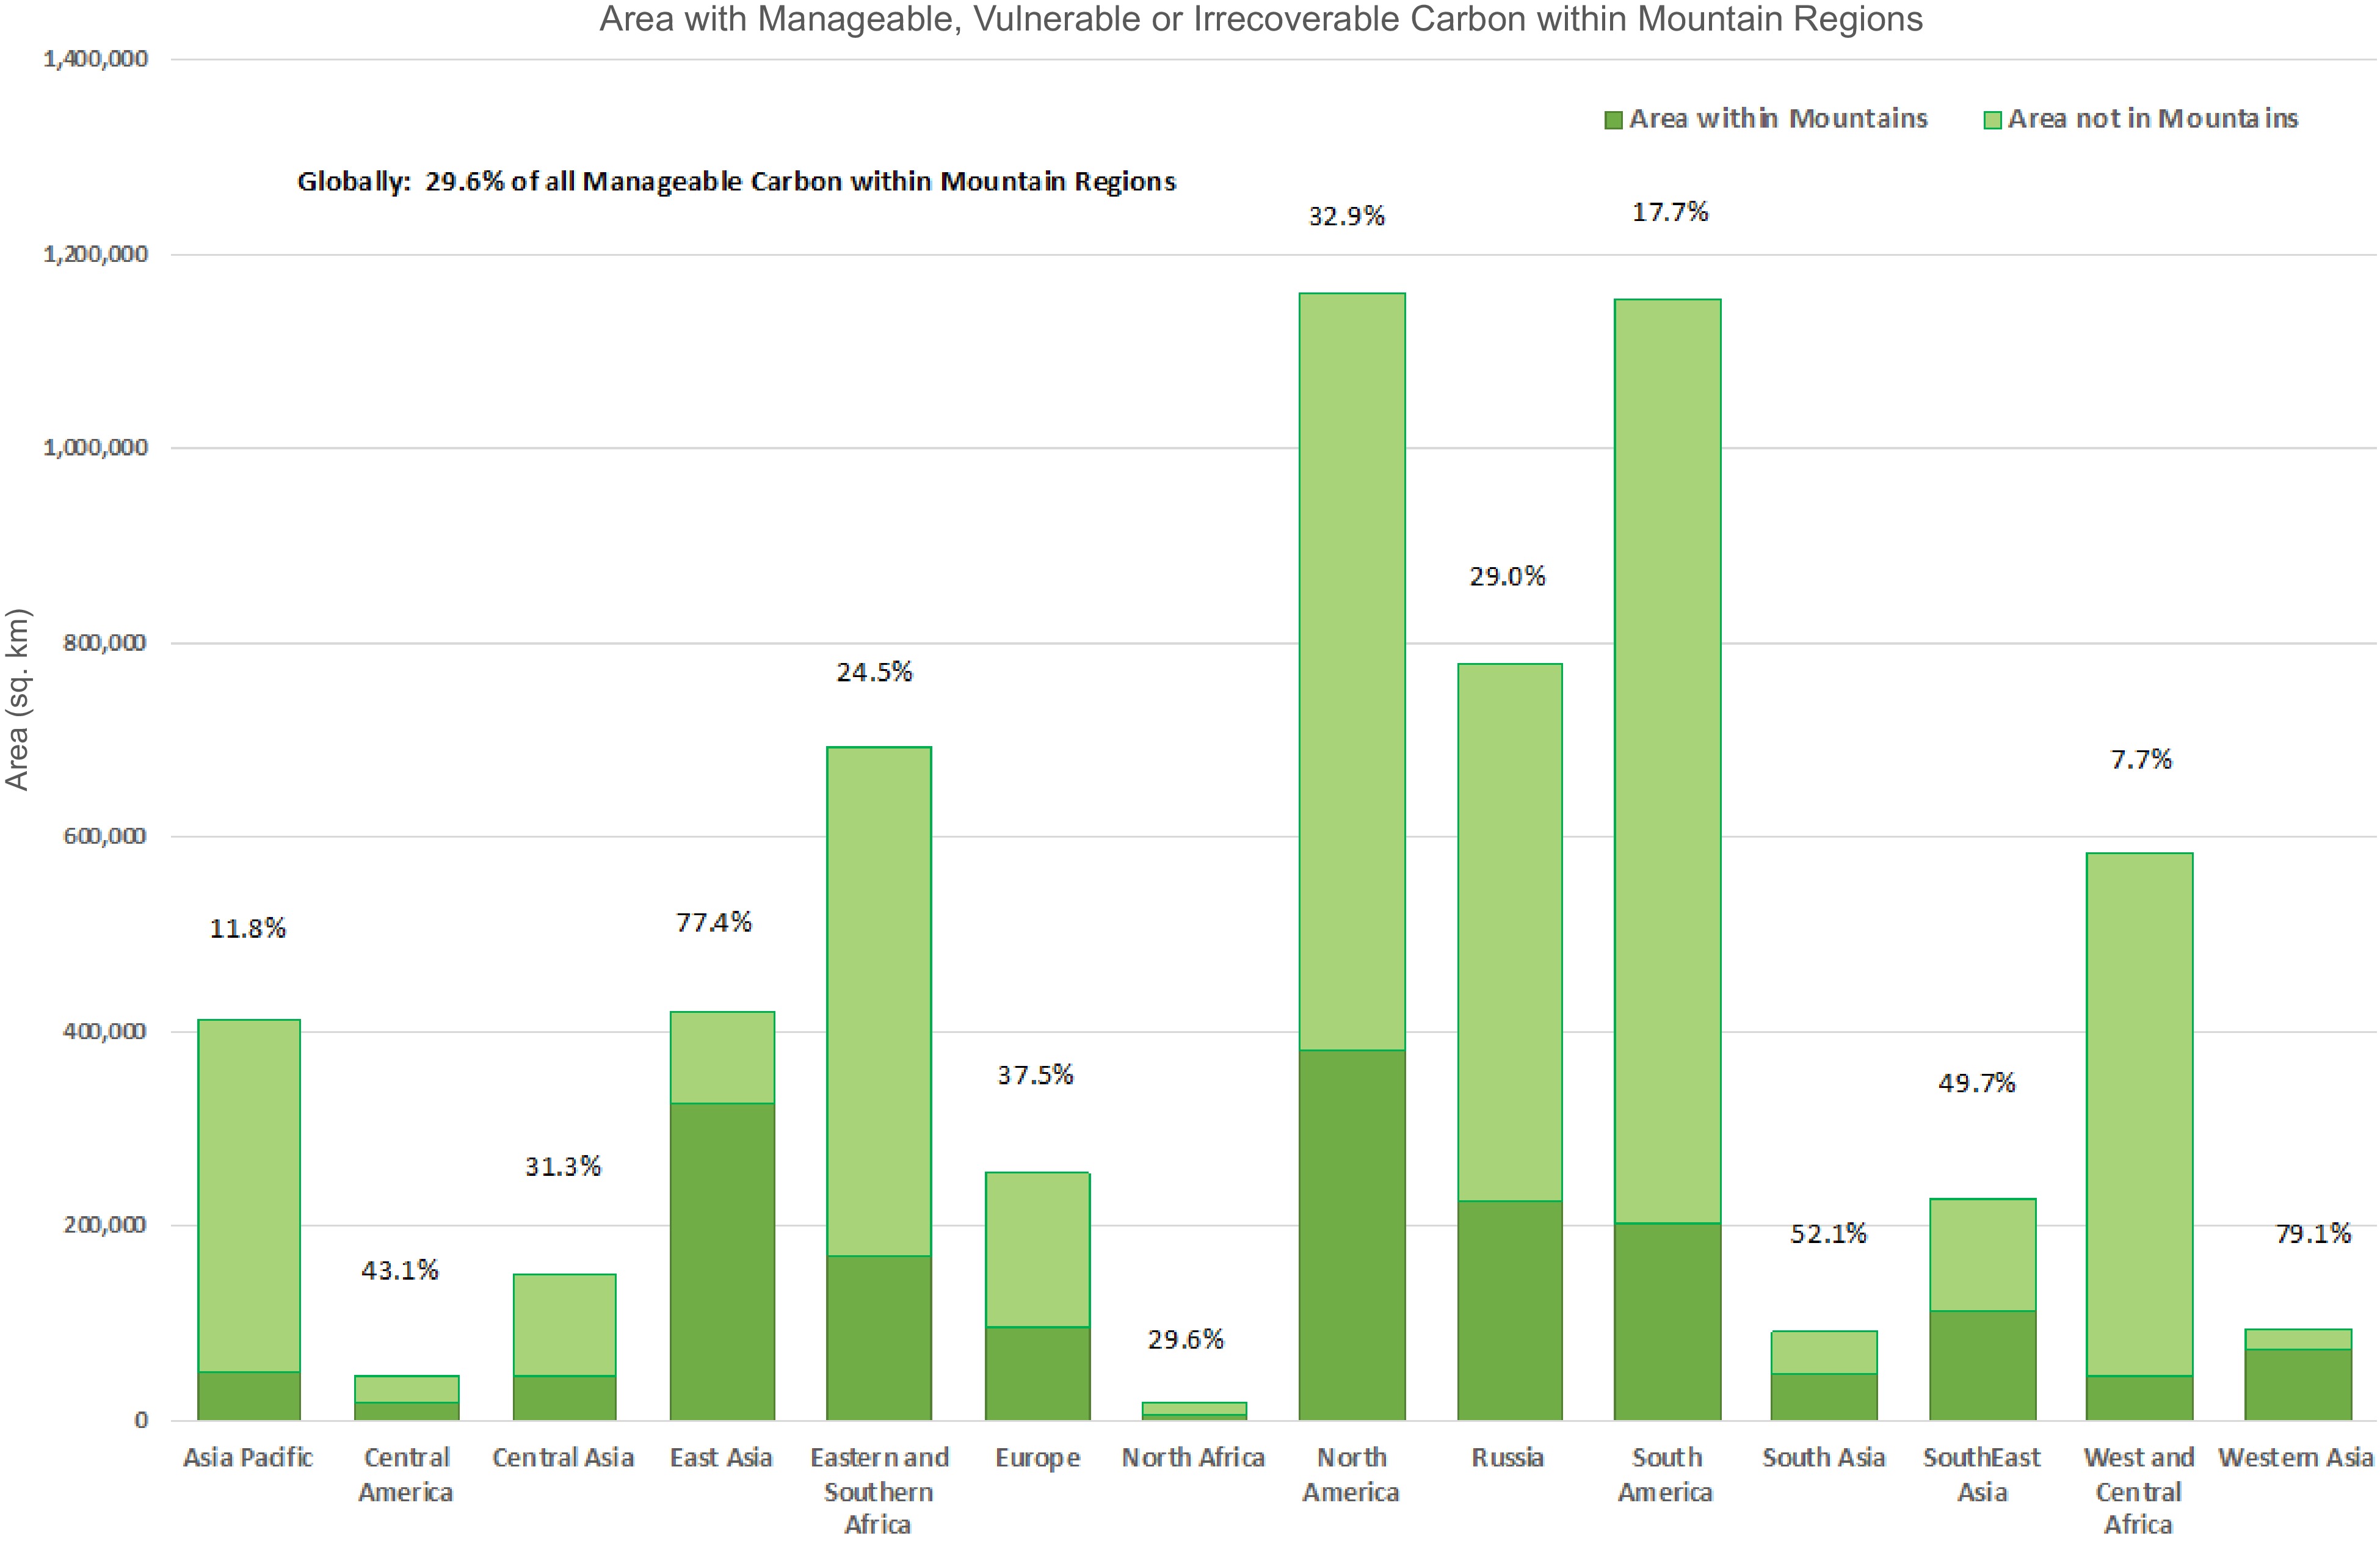
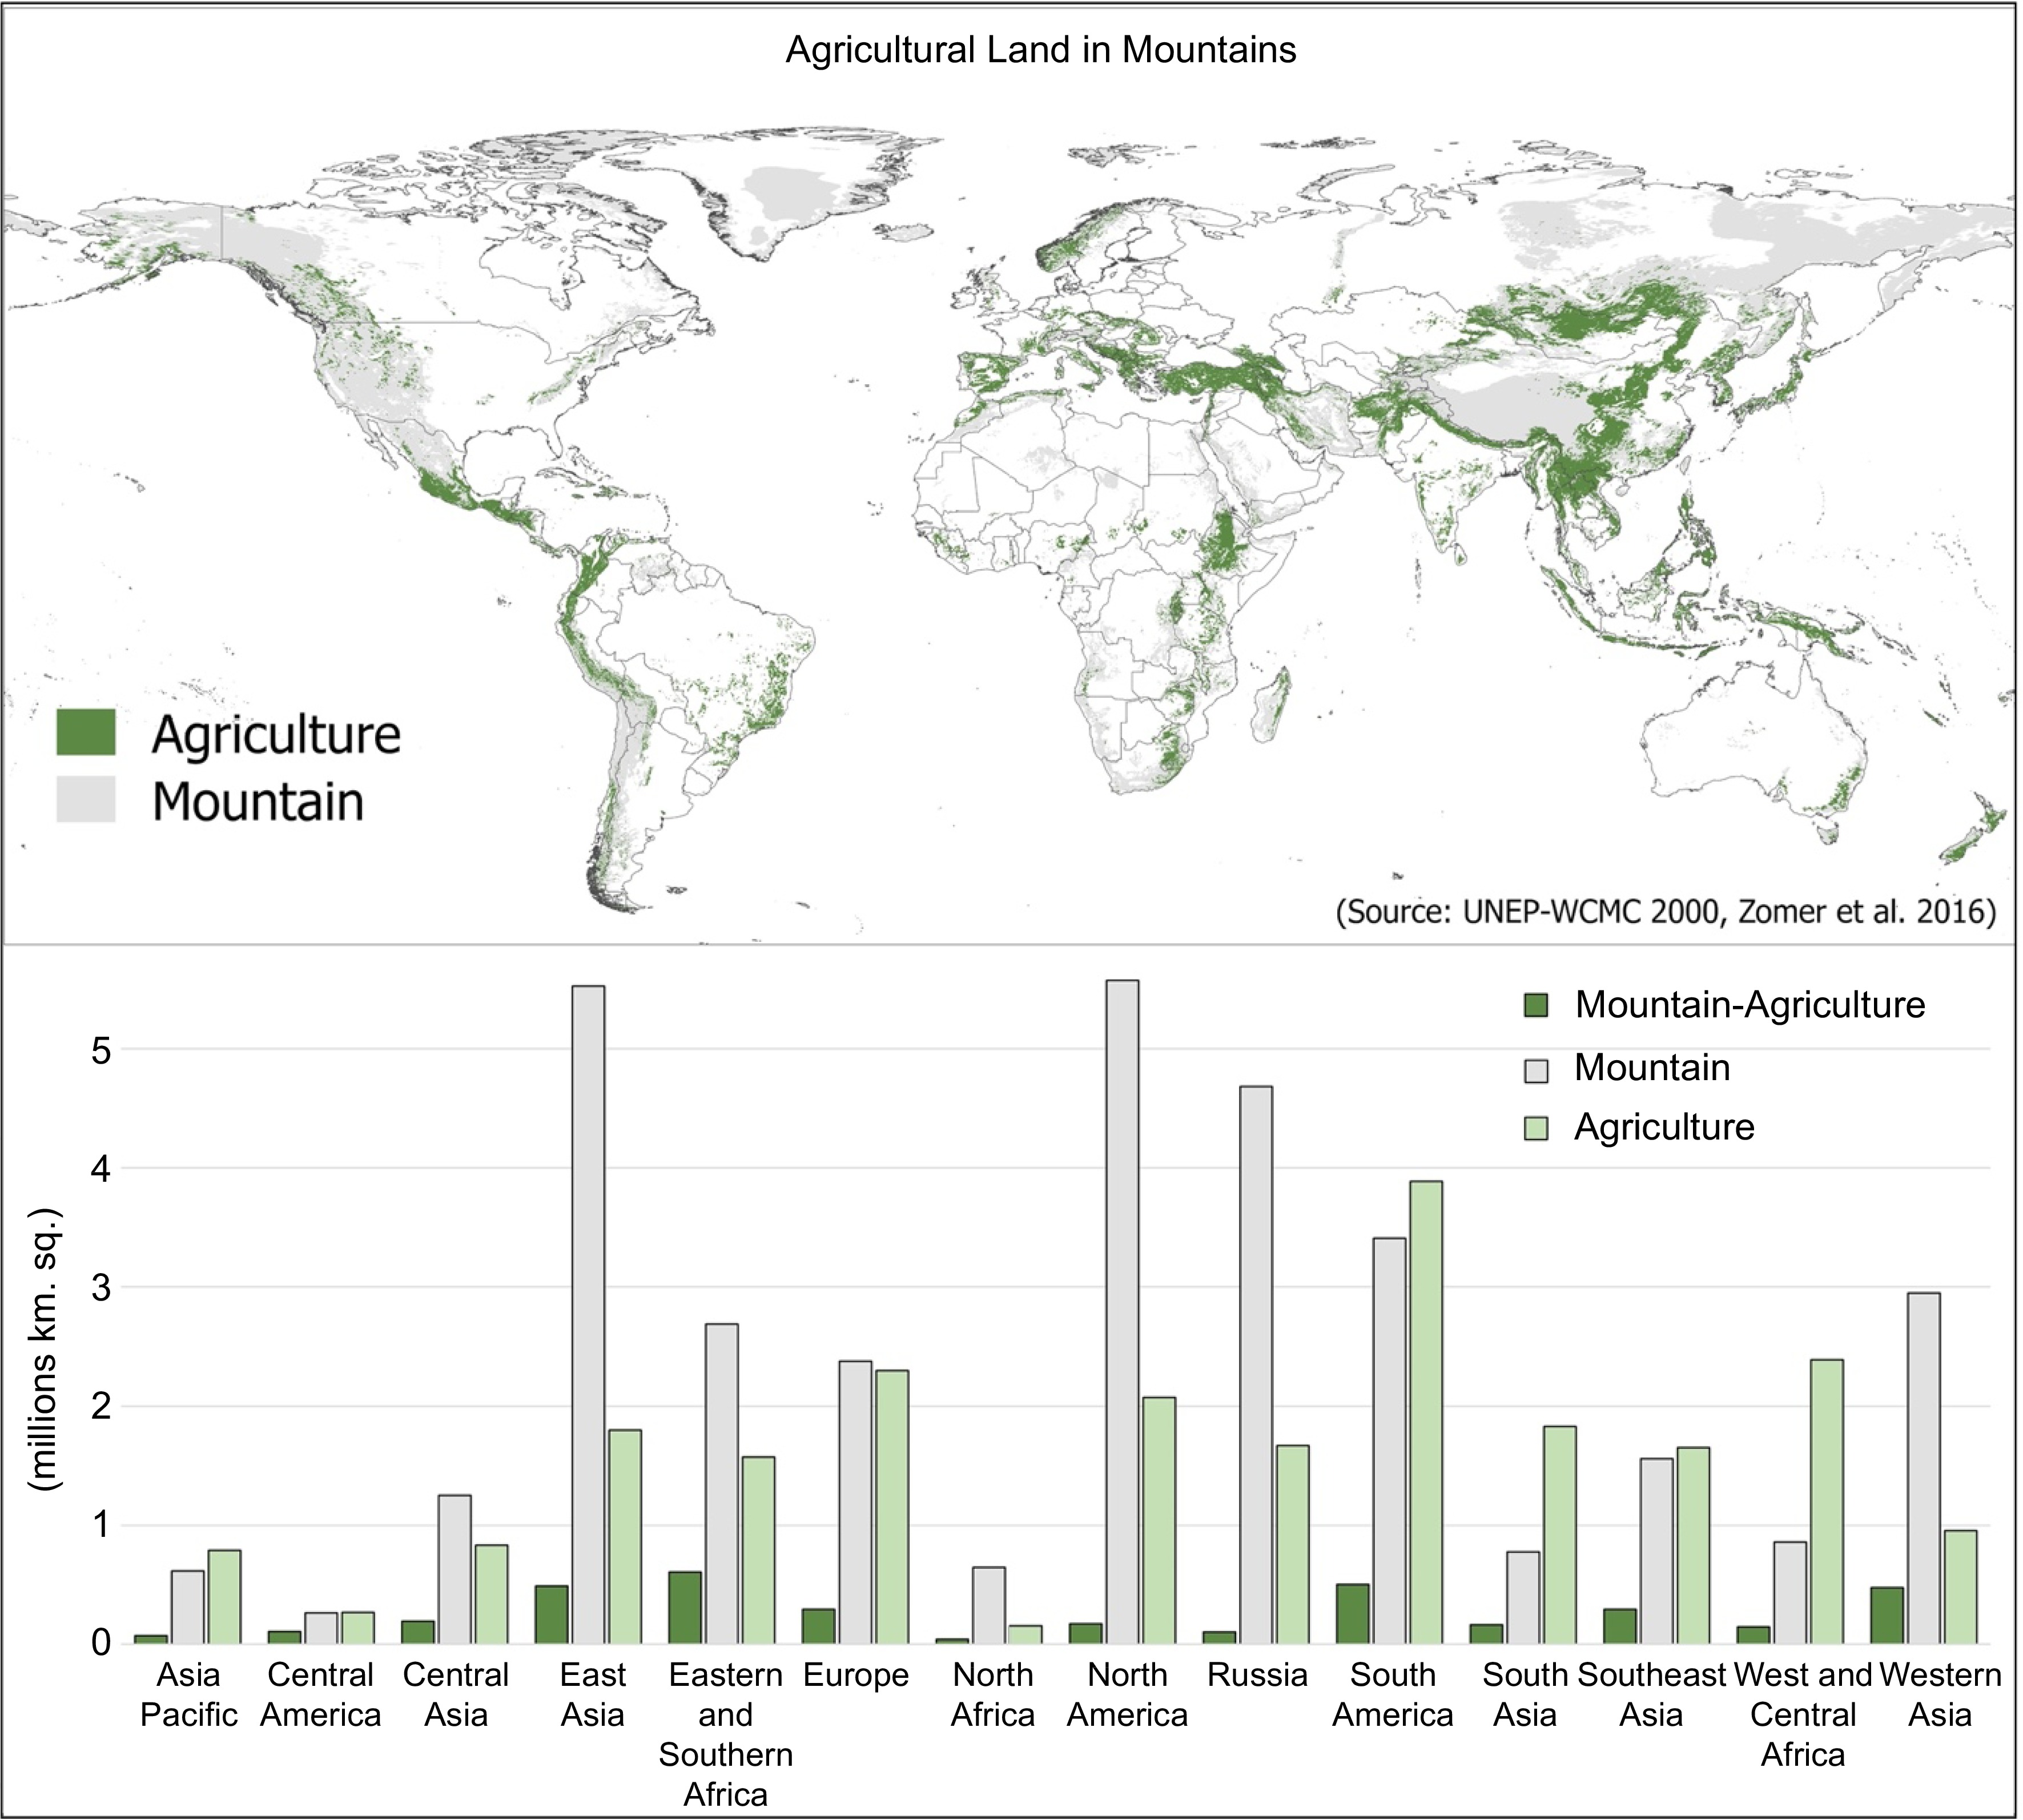
Figure 4.
Biomass carbon on agricultural land with mountainous regions, by scenarios. Incremental change represented by two subsets of the first scenario: a) 10% increase in tree cover on all land under the median (50th percentile) for each respective strata (n = 495), and b) increase of all land under the median up to the median. A systemic transformative change to a agroforestry type system incorporating increased tree cover as a core production component is represented by a range of percentiles (60th−80th) of tree cover for each respective strata, with the 70th percentile assumed as an ecologically reasonable and attainable adoption level[5, 20, 41].
-
-
Region Manageable carbon Vulnerable carbon lrrecoverable carbon PgC % PgC % PgC % Asia Pacific 10.99 29.60 7.99 33.04 3.60 47.75 Central America 2.79 43.40 1.65 40.97 0.13 18.57 Central Asia 3.58 41.50 2.82 36.98 0.22 68.75 East Asia 28.03 80.86 17.50 80.79 1.38 72.63 Eastern and Southern Africa 15.78 29.12 9.84 28.08 1.98 35.74 Europe 10.86 33.00 6.14 32.00 2.33 32.45 North Africa 0.52 53.15 0.33 55.70 0.09 69.23 North America 40.66 32.92 22.08 33.43 6.85 35.38 Russia 28.21 24.02 10.90 20.77 4.91 15.52 South America 28.65 15.97 18.18 13.49 4.64 12.00 South Asia 5.68 64.36 3.42 64.40 0.47 61.84 Southeast Asia 21.59 48.62 14.86 44.83 3.72 32.86 West and Central Africa 5.84 8.16 3.90 7.37 0.61 5.33 Western Asia 4.89 86.14 2.55 86.00 0.25 80.65 Global 208.07 28.67 122.17 26.56 31.18 22.79 -
Region Mean percent tree cover (%) Area (km2) 2000 2010 Change 50th 60th 70th 80th Asia Pacific 28.4 32.5 4.1 36.3 38.0 40.1 42.9 71,989 Central America 36.1 38.4 2.3 43.4 45.4 47.9 51.7 105,827 Central Asia 5.6 5.4 −0.3 6.4 7.0 8.0 9.6 194.908 East Asia 18.1 20.9 2.8 22.2 23.1 24.8 27.4 490,326 Eastern and Southern Africa 11.9 11.7 −0.2 12.8 13.4 14.3 16.2 605,705 Europe 14.6 16.7 2.1 18.1 19.2 20.8 23.7 294,482 North Africa 2.5 3.3 0.8 3.6 3.6 4.1 5.5 43,300 North America 30.2 29.6 −0.5 32.3 33.7 35.8 39.0 173,494 Russia 14.6 15 0.4 16.8 17.8 19.4 22.1 105,035 South America 23.5 26 2.5 28.3 29.9 32.5 36.9 501,408 South Asia 20.1 21.3 1.2 23.7 25.2 27.7 31.6 163,323 Southeast Asia 42.8 43.6 0.8 48.1 50.4 53.2 56.8 293,696 West and Central Africa 14.9 14 −1.0 15.4 16.3 17.7 20.5 147,633 Western Asia 5.5 6.3 0.8 7.4 8.0 9.0 11.0 476,485 Global 19.2 20.3 1.1 21.3 22.4 24.1 26.9 3,667,611 -
Region Increase in biomass carbon by scenario and percentile (PgC) Biomass carbon (PgC) Incremental Systemic 2000 2010 10%/Median Median (50th) 60th 70th 80th Asia Pacific 0.4 0.45 0.48 0.49 0.52 0.54 0.57 Central America 0.63 6.6 0.71 0.74 0.77 0.81 0.87 Central Asia 0.13 0.13 0.14 0.14 0.14 0.15 0.16 East Asia 0.89 0.99 1.03 1.03 1.06 1.11 1.19 Eastern and Southern Africa 0.9 0.9 0.94 0.95 0.98 1.02 1.12 Europe 0.34 0.37 0.37 0.38 0.40 0.43 0.47 North Africa 0.03 0.03 0.03 0.03 0.03 0.03 0.04 North America 0.7 0.69 0.73 0.73 0.76 0.80 0.86 Russia 0.08 0.08 0.08 0.08 0.09 0.09 0.10 South America 1.65 1.79 1.91 1.92 2.00 2.15 2.39 South Asia 0.37 0.38 0.41 0.41 0.43 0.46 0.52 Southeast Asia 2 2.07 2.21 2.31 2.42 2.56 2.73 West and Central Africa 0.39 0.37 0.41 0.4 0.42 0.45 0.51 Western Asia 0.41 0.43 0.39 0.4 0.42 0.47 0.53 Increased Biomass Carbon / 0.43 0.52 0.67 1.10 1.73 2.71 Total Biomass Carbon 8.91 9.34 9.86 10.01 10.44 11.07 12.05 Table 3.
Biomass carbon on agricultural land within mountainous regions, by scenarios. Incremental change represented by two subsets of the first scenario: a) 10% increase in tree cover on all land under the median (50th percentile) for each respective strata (n = 495), and b) increase of all land under the median up to the median. A systemic transformative change to a agroforestry type system incorporating increased tree cover as a core production component is represented by a range of percentiles (60th−80th) of tree cover for each respective strata, with the 70th percentile assumed as an ecologically reasonable and attainable adoption level[5,20,41].
-
Increased biomass carbon (PgC) 2010 1% 10% Region Asia Pacific 0.45 0.01 0.11 Central America 0.66 0.02 0.16 Central Asia 0.13 0.01 0.07 East Asia 0.99 0.03 0.31 Eastern and Southern Africa 0.9 0.04 0.44 Europe 0.37 0.01 0.15 North Africa 0.03 0.00 0.03 North America 0.69 0.02 0.18 Russia 0.08 0.00 0.02 South America 1.79 0.06 0.57 South Asia 0.38 0.01 0.13 Southeast Asia 2.07 0.05 0.44 West and Central Africa 0.37 0.02 0.15 Western Asia 0.43 0.03 0.31 Global 9.34 0.31 3.07 Country China 0.918 0.030 0.297 Brazil 0.769 0.031 0.290 Ethiopia 0.410 0.021 0.208 Indonesia 0.885 0.021 0.185 Mexico 0.637 0.018 0.168 Turkey 0.206 0.015 0.143 Colombia 0.535 0.014 0.138 Philippines 0.434 0.009 0.104 India 0.251 0.009 0.098 Spain 0.078 0.006 0.059 Papua New Guinea 0.301 0.008 0.057 Afghanistan 0.047 0.006 0.057 Mongolia 0.090 0.005 0.049 Peru 0.116 0.005 0.047 lran 0.051 0.005 0.047 Madagascar 0.178 0.004 0.044 Honduras 0.168 0.005 0.040 Table 4.
Biomass carbon in 2010 (PgC), and potential increase in biomass carbon (PgC) on agricultural land within mountainous regions resulting from a 1% increase in tree cover, or shown as a 1% increase in tree cover per year for 10 years (10%), globally, by region, and by the top countries showing the highest potential biomass increase[5,20,41].
Figures
(5)
Tables
(4)