-
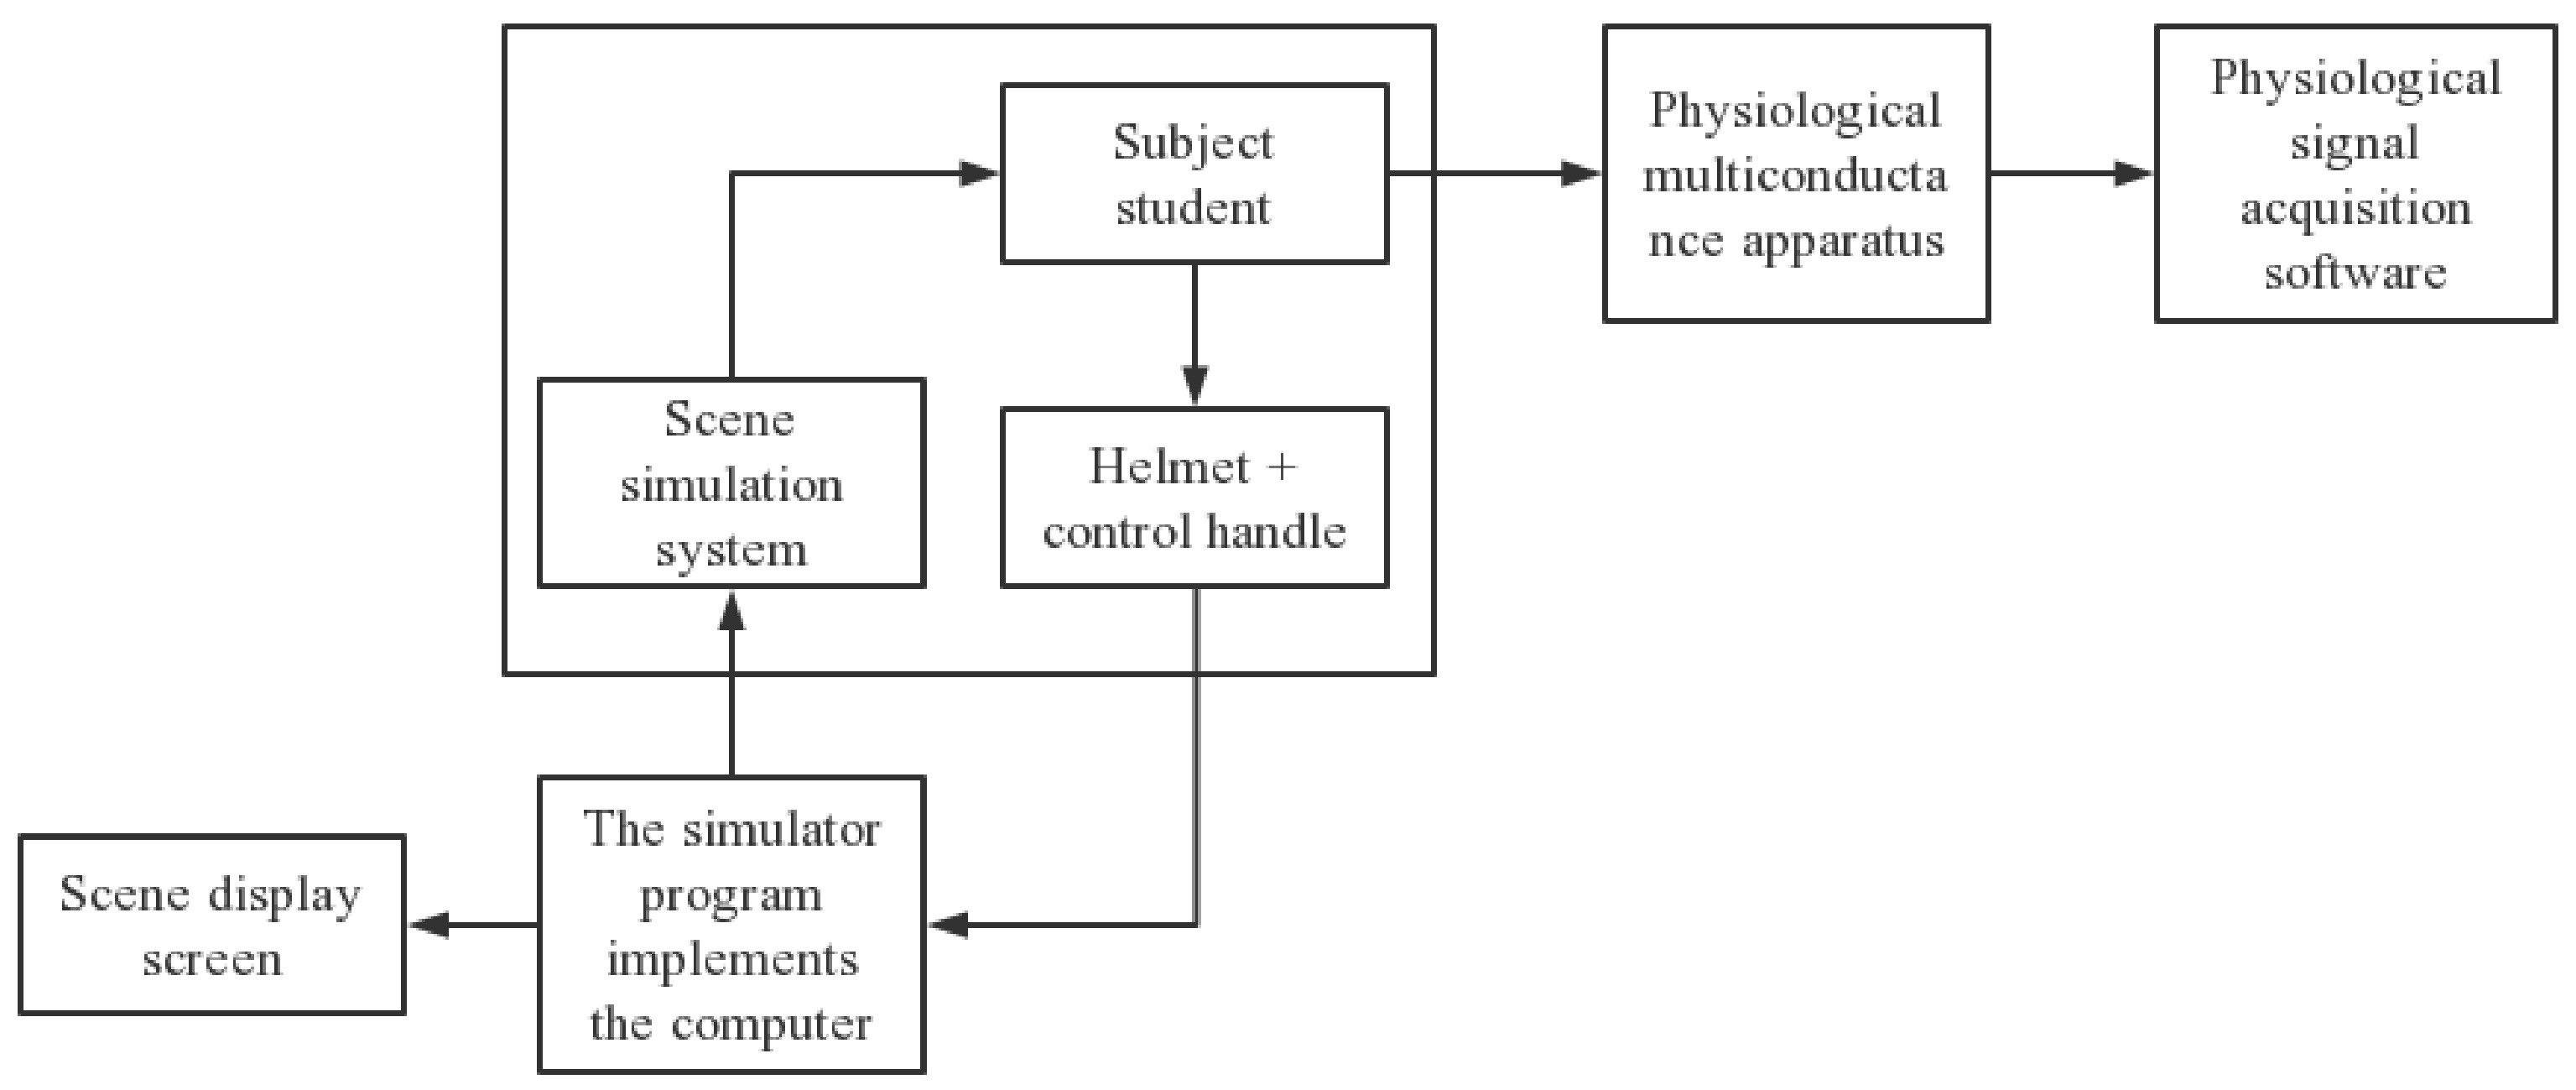
Figure 1.
Schematic diagram of Emergency Response Ability Experiment System for college students.
-
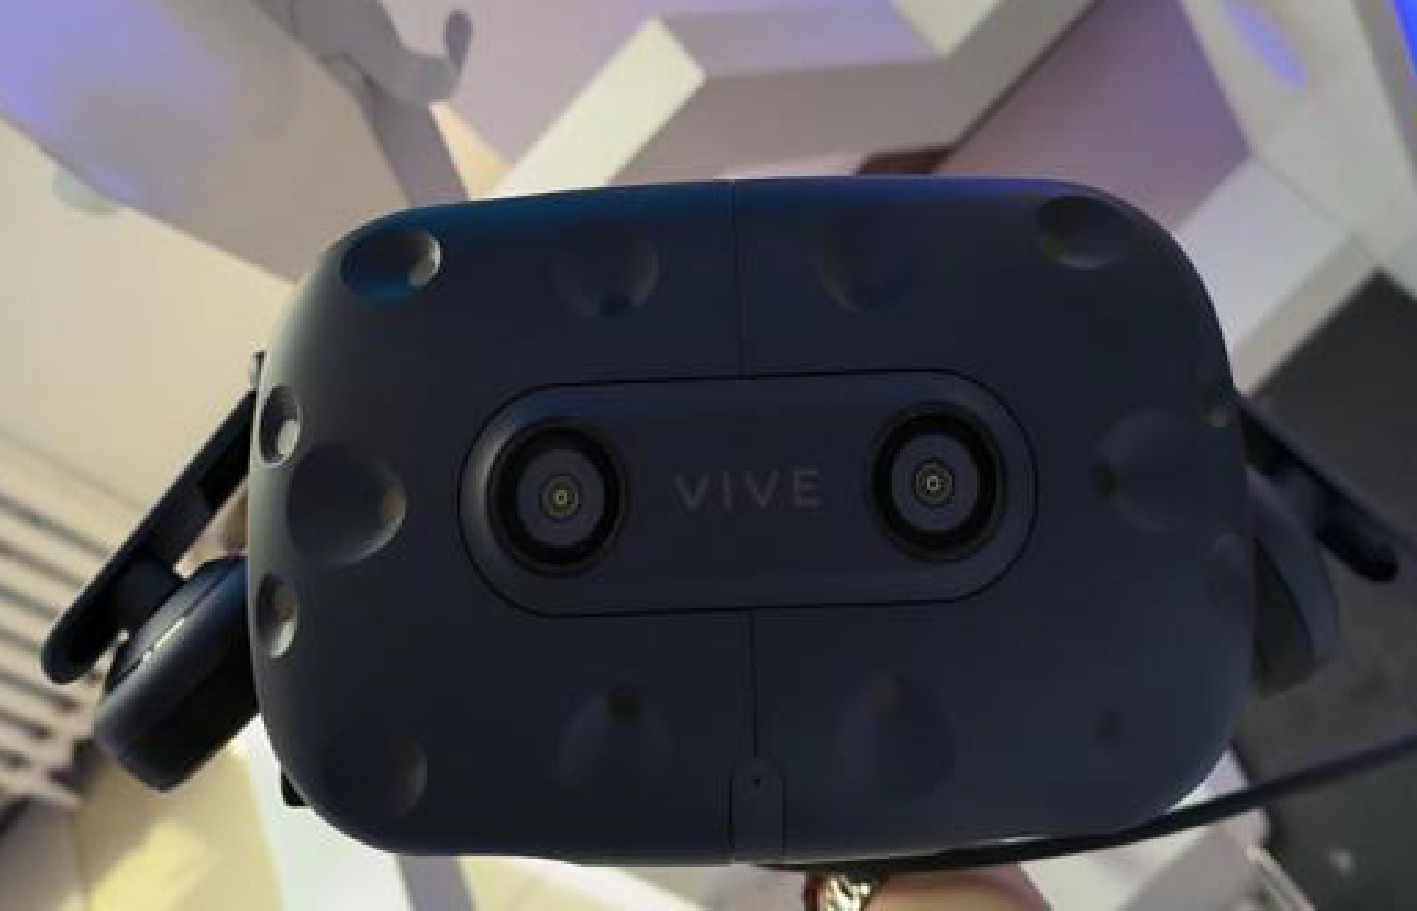
Figure 2.
Virtual reality headset.
-
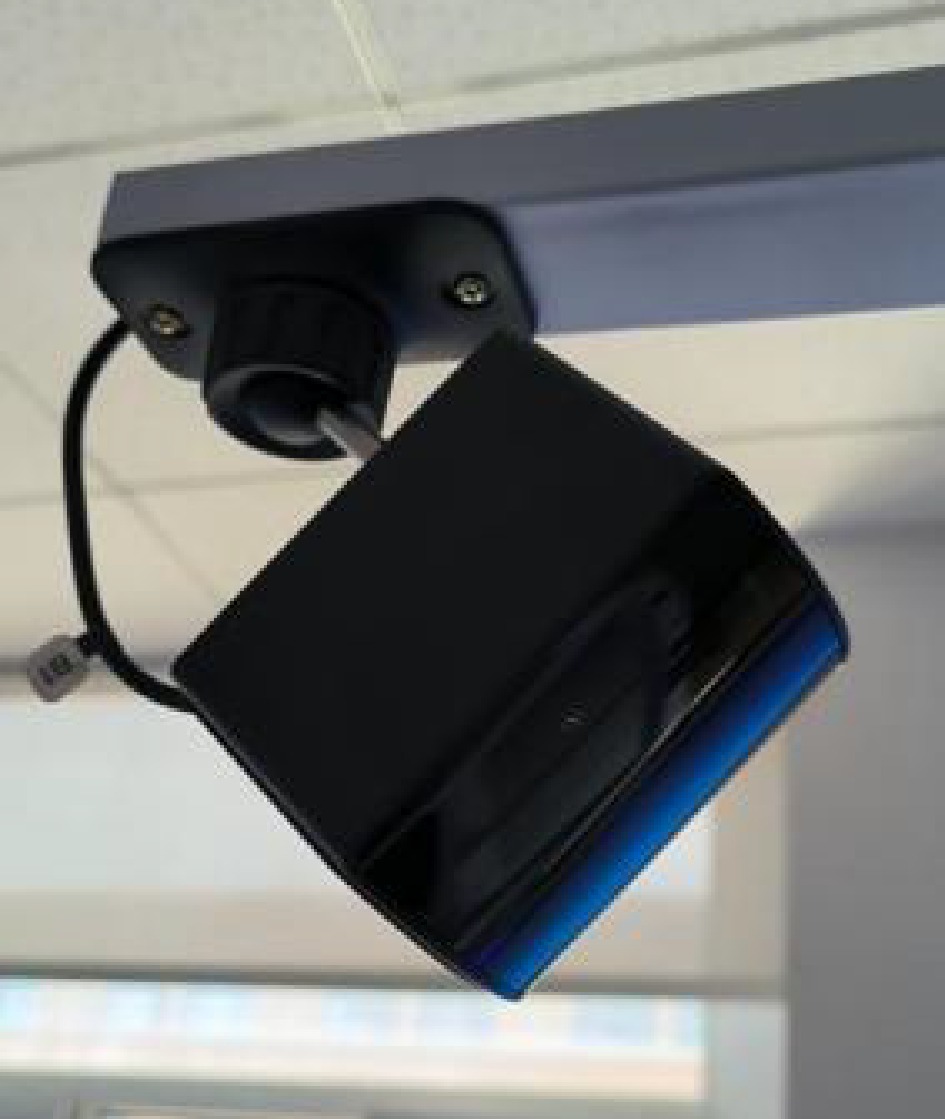
Figure 3.
Virtual reality system locator.
-
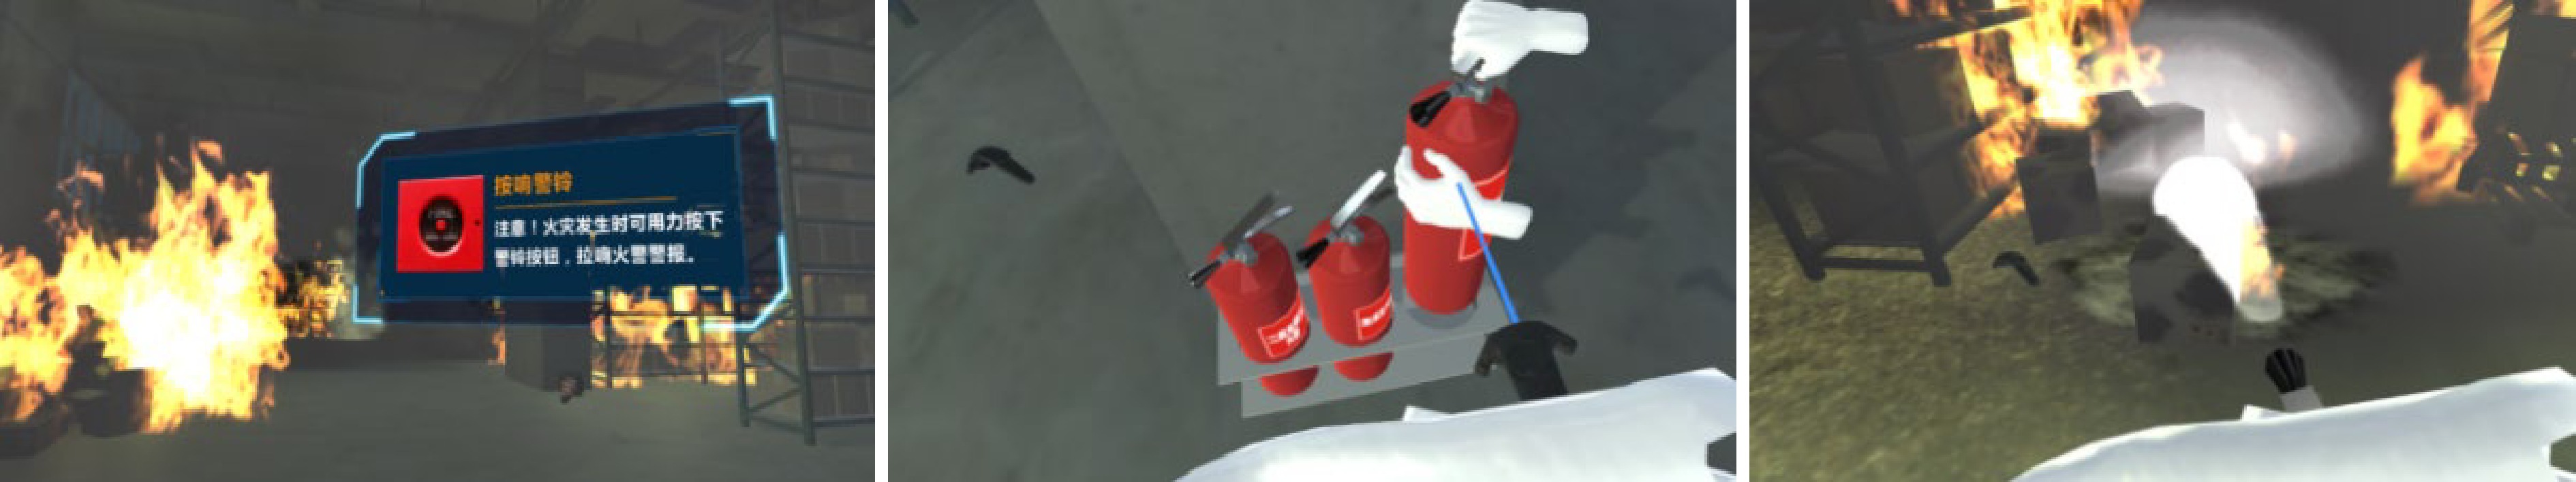
Figure 4.
Fire scene.
-

Figure 5.
Earthquake scene.
-
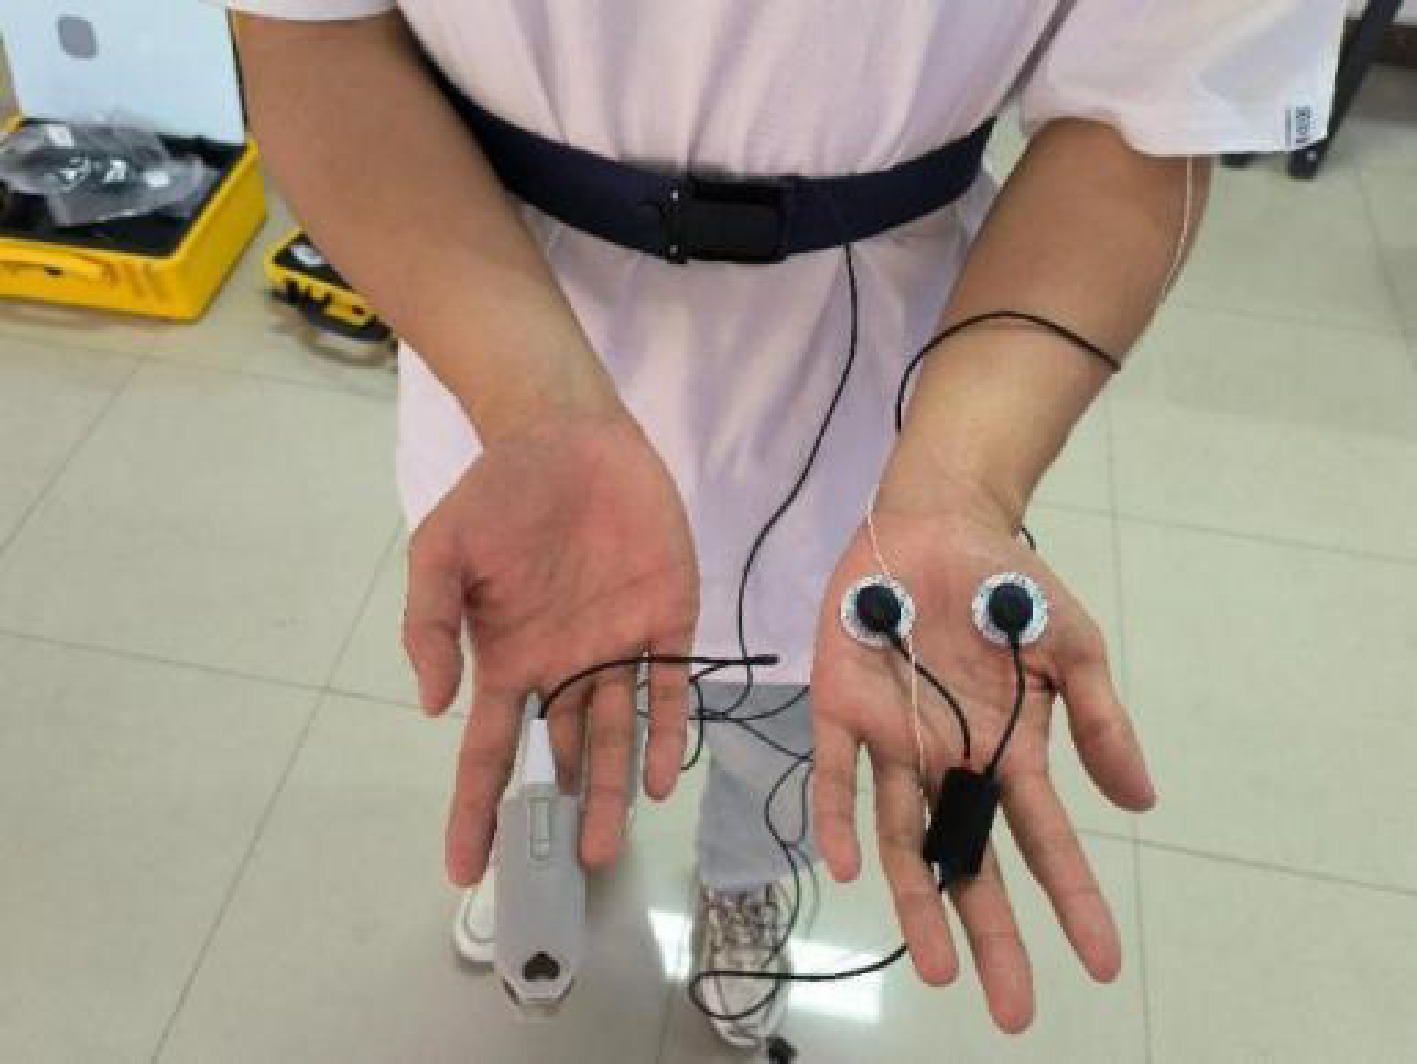
Figure 6.
Physiological signal data acquisition set-up.
-
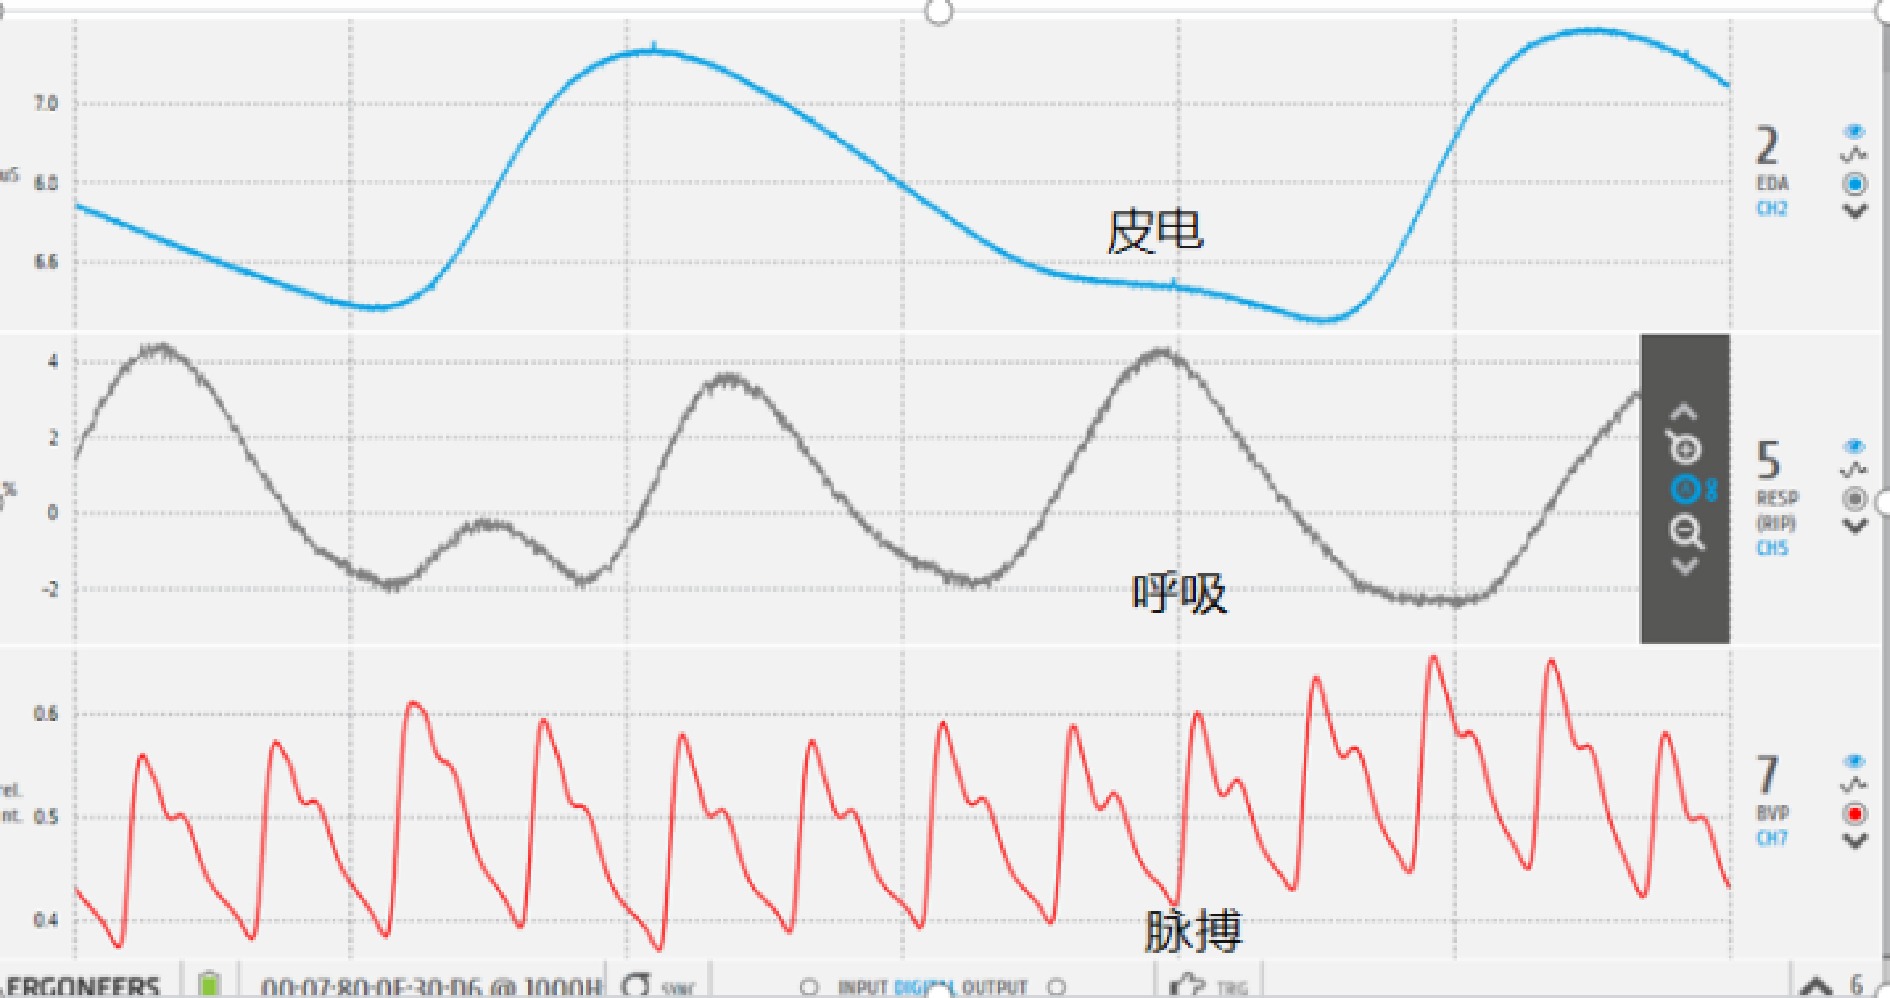
Figure 7.
Physiological signal acquisition page diagram.
-
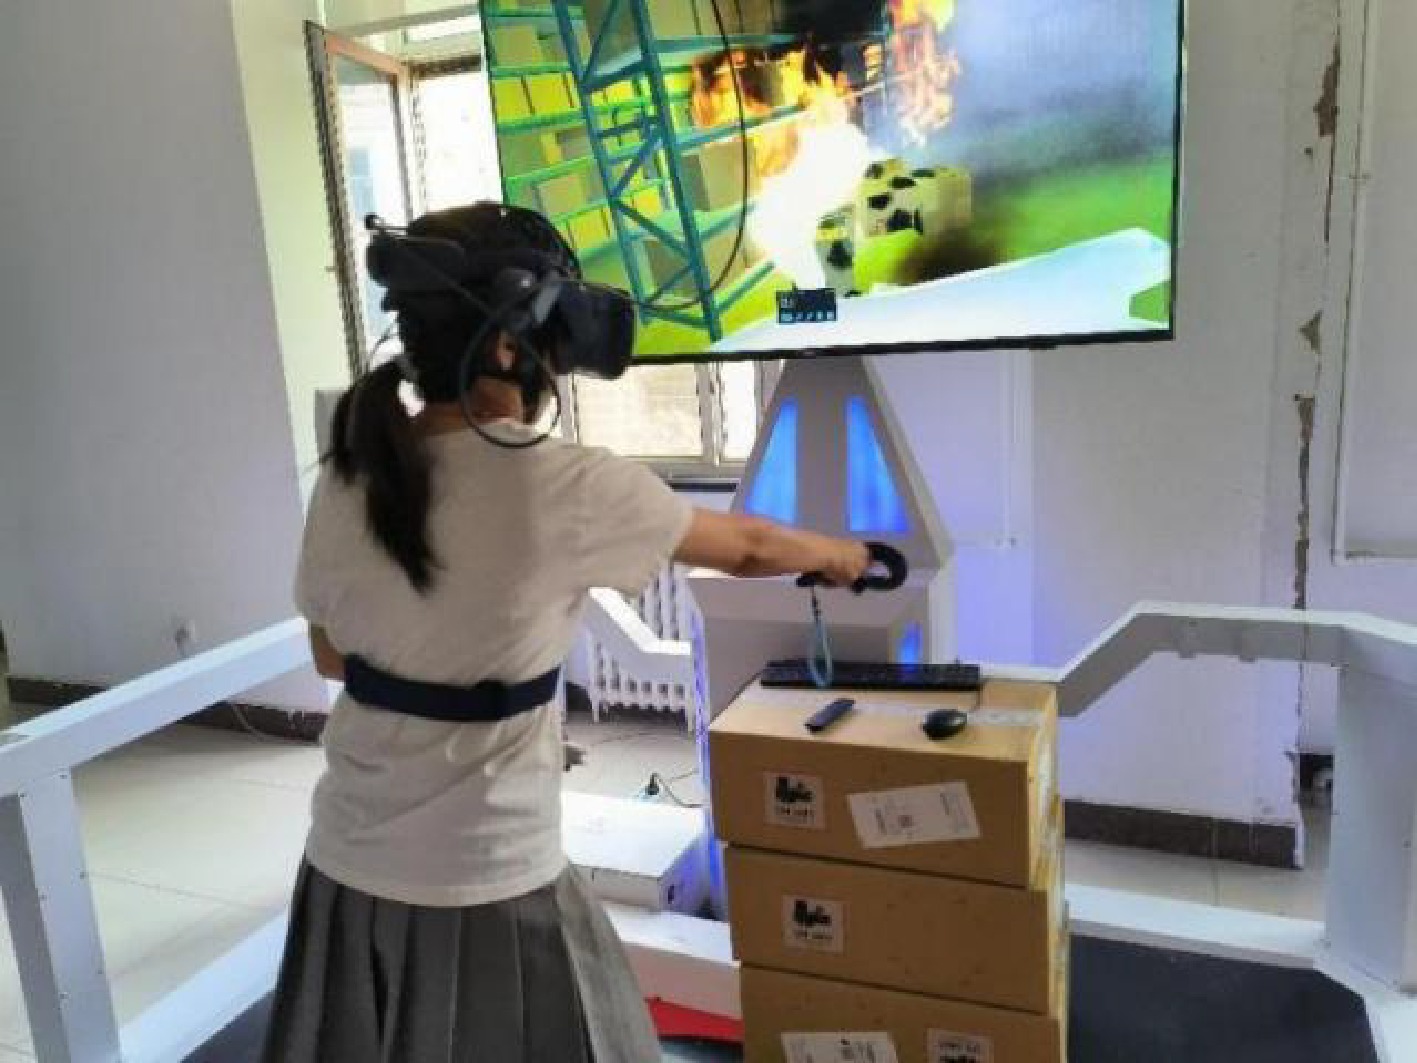
Figure 8.
Subject in the experiment.
-
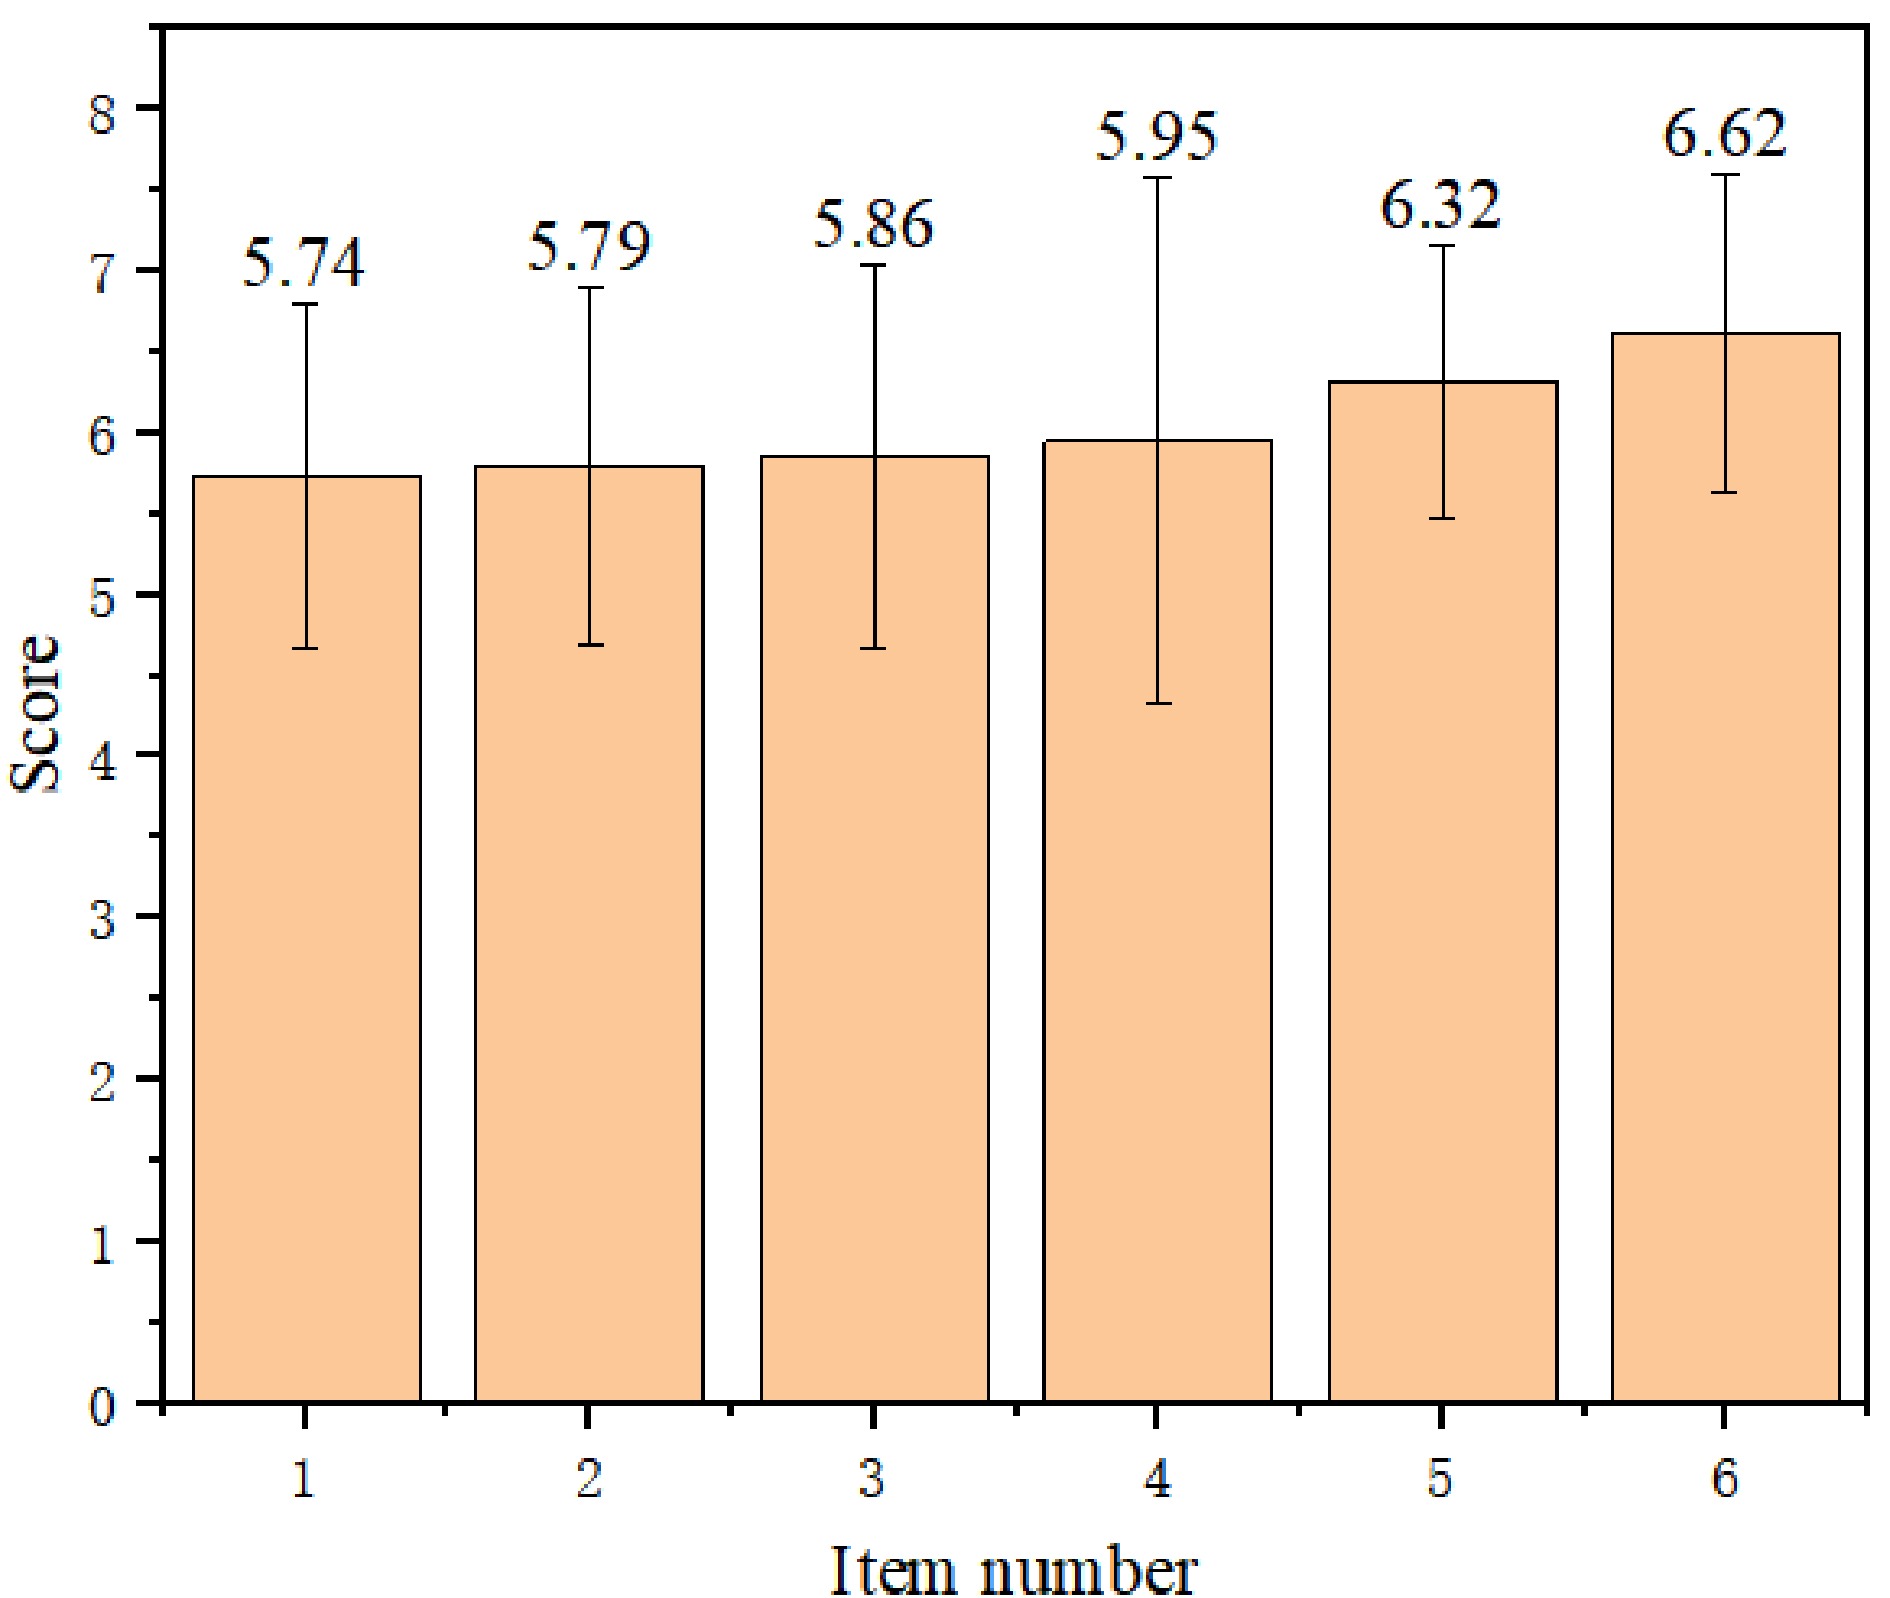
Figure 9.
Mean scores of subjective evaluation items in virtual situations.
-
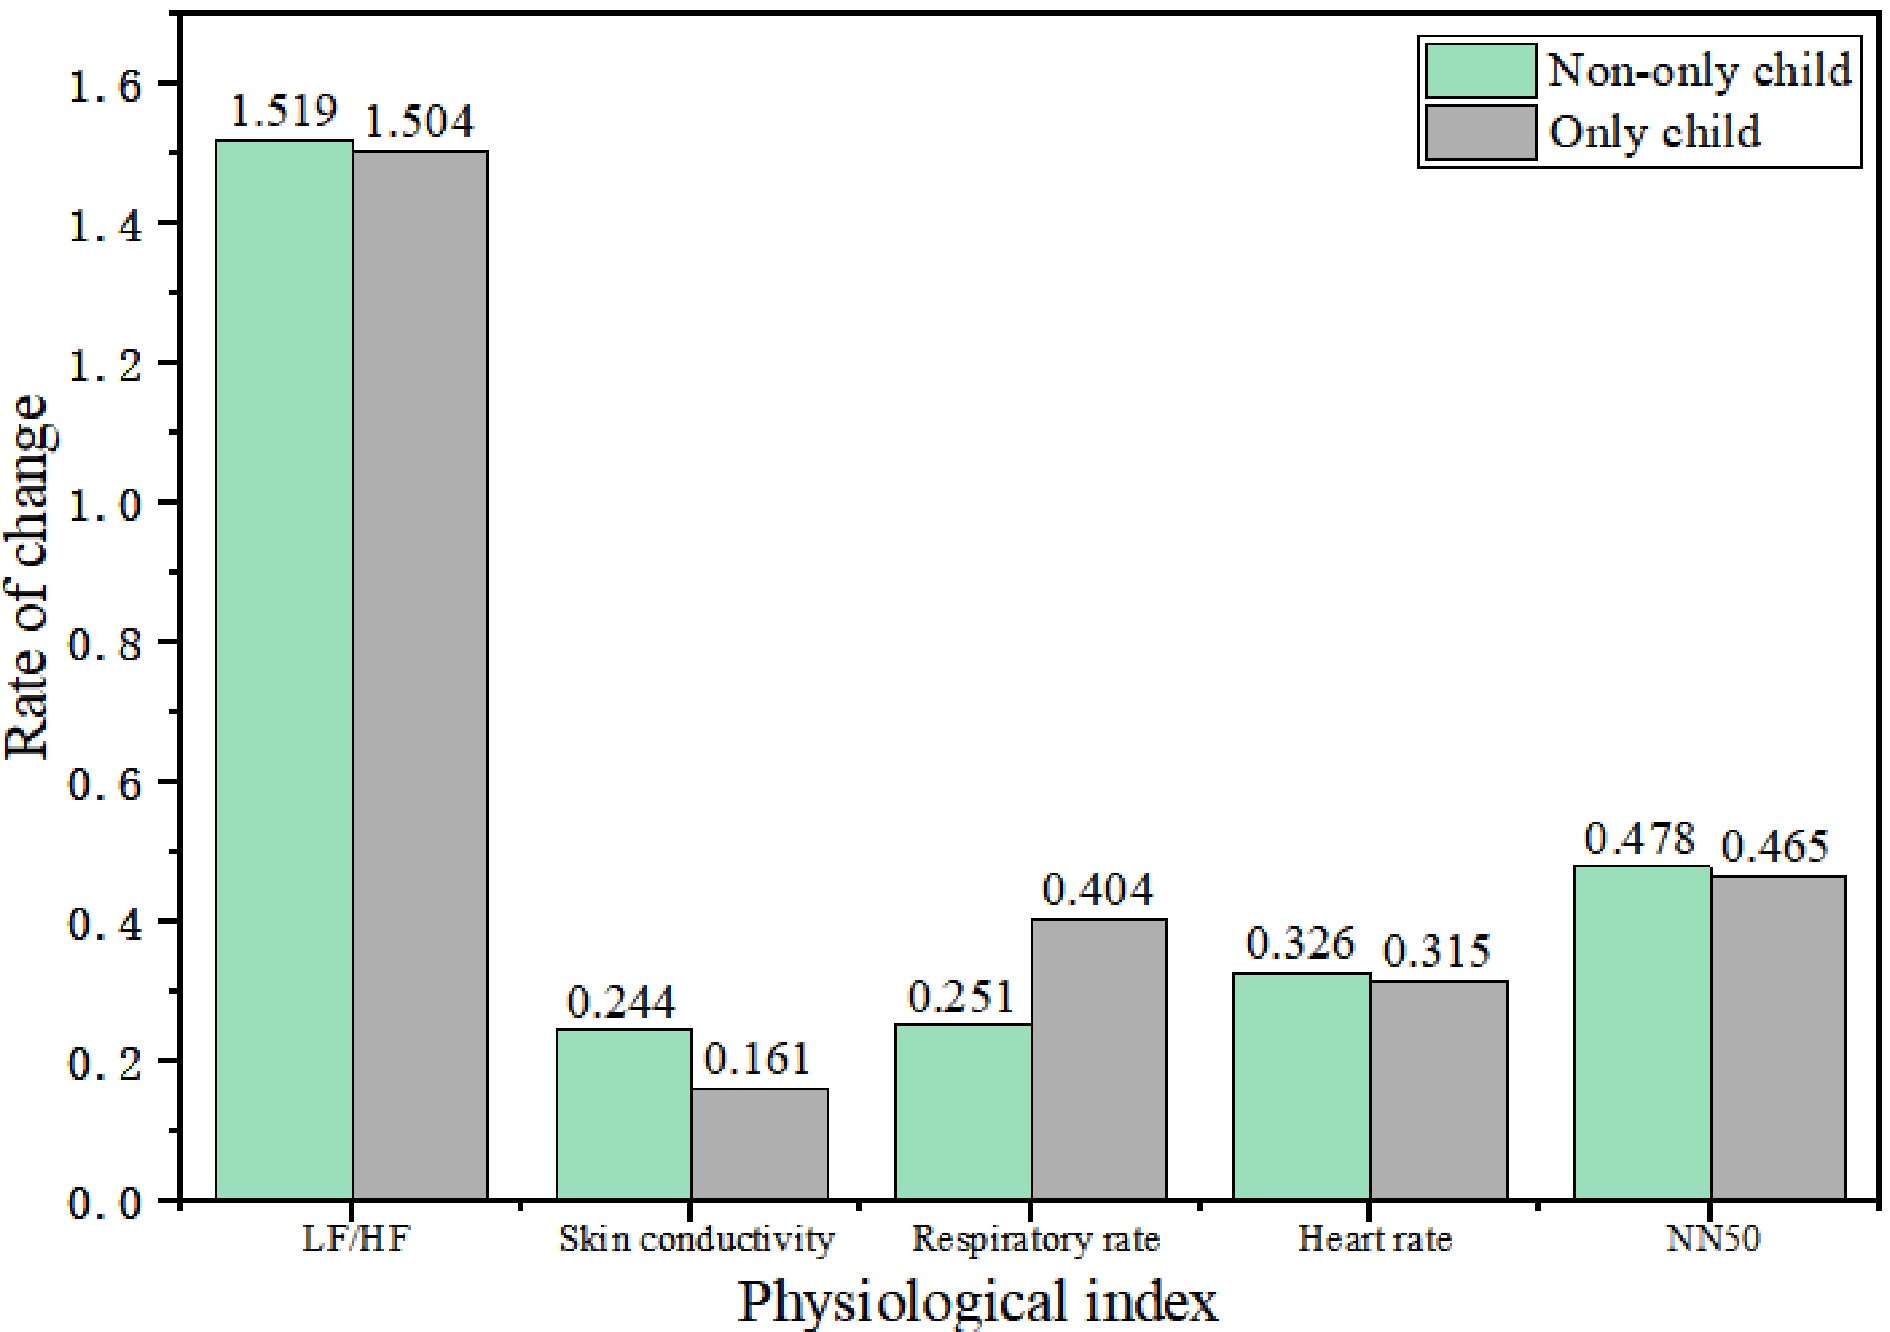
Figure 10.
Average change rate of physiological indexes in resting period and event period.
-
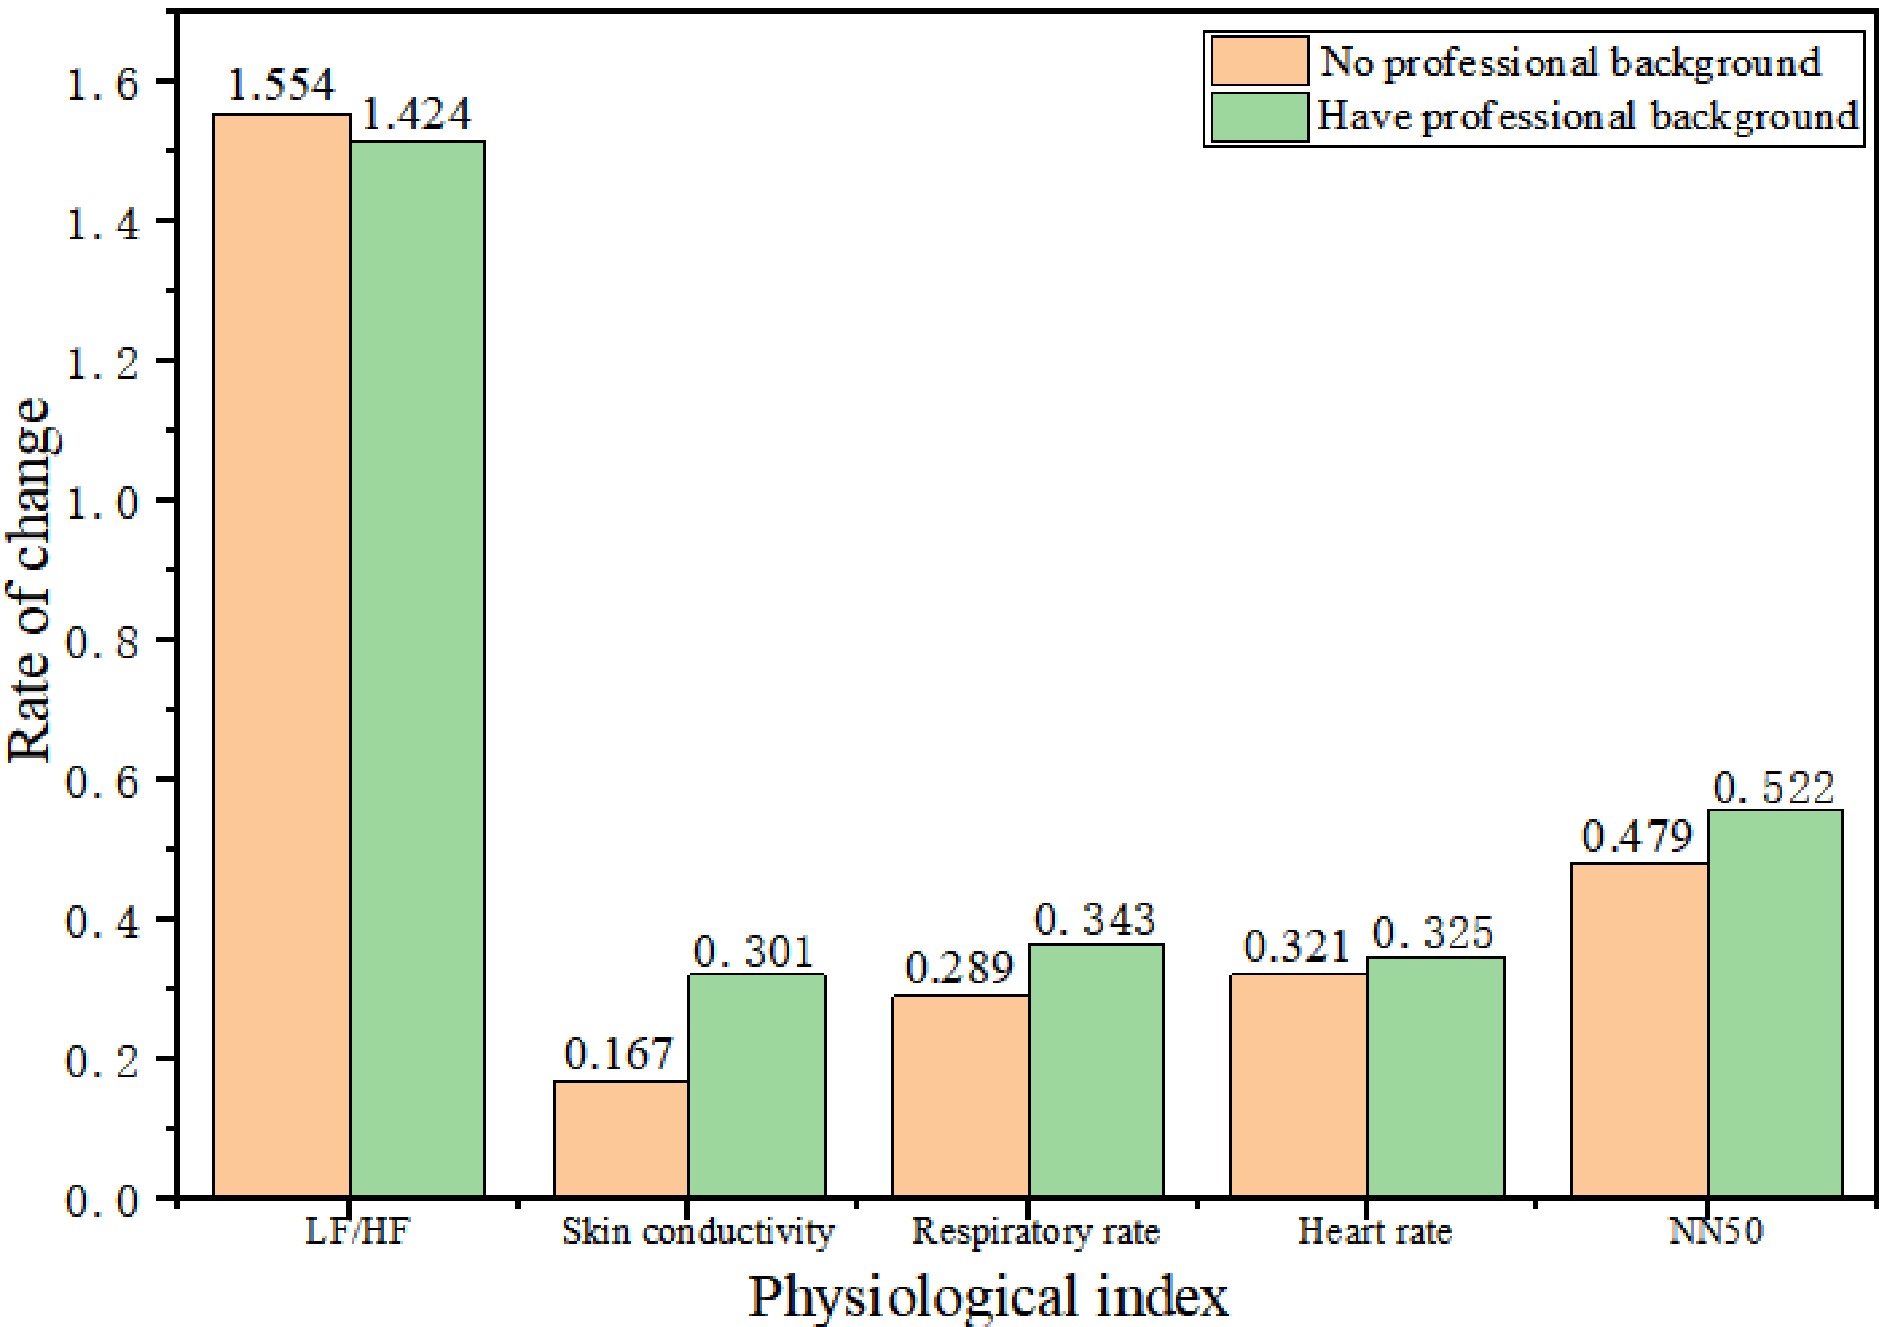
Figure 11.
The average change rate of physiological indexes in resting period and event period.
-
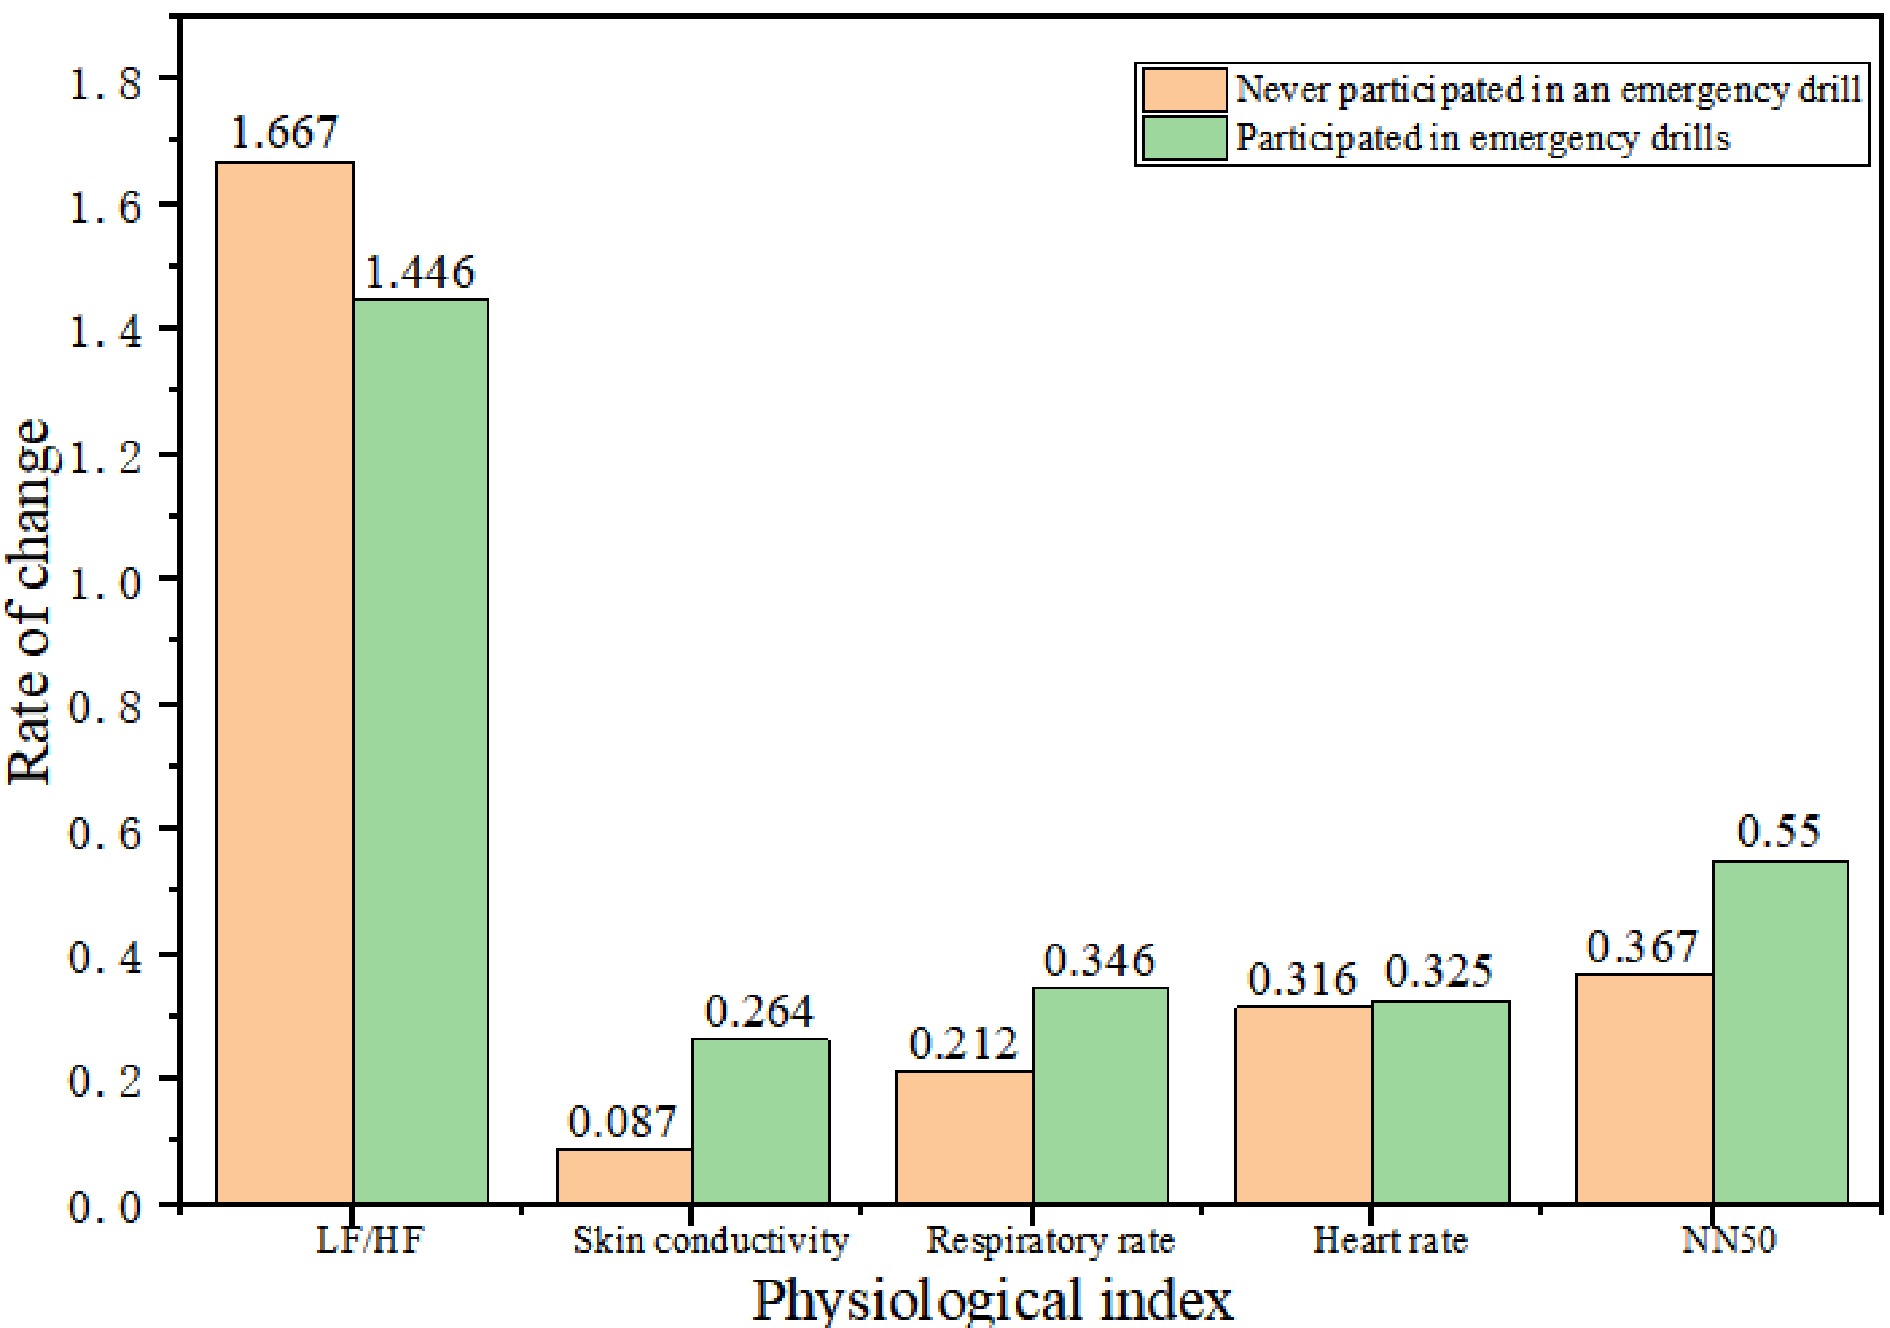
Figure 12.
The average change rate of physiological indexes in resting period and event period.
-
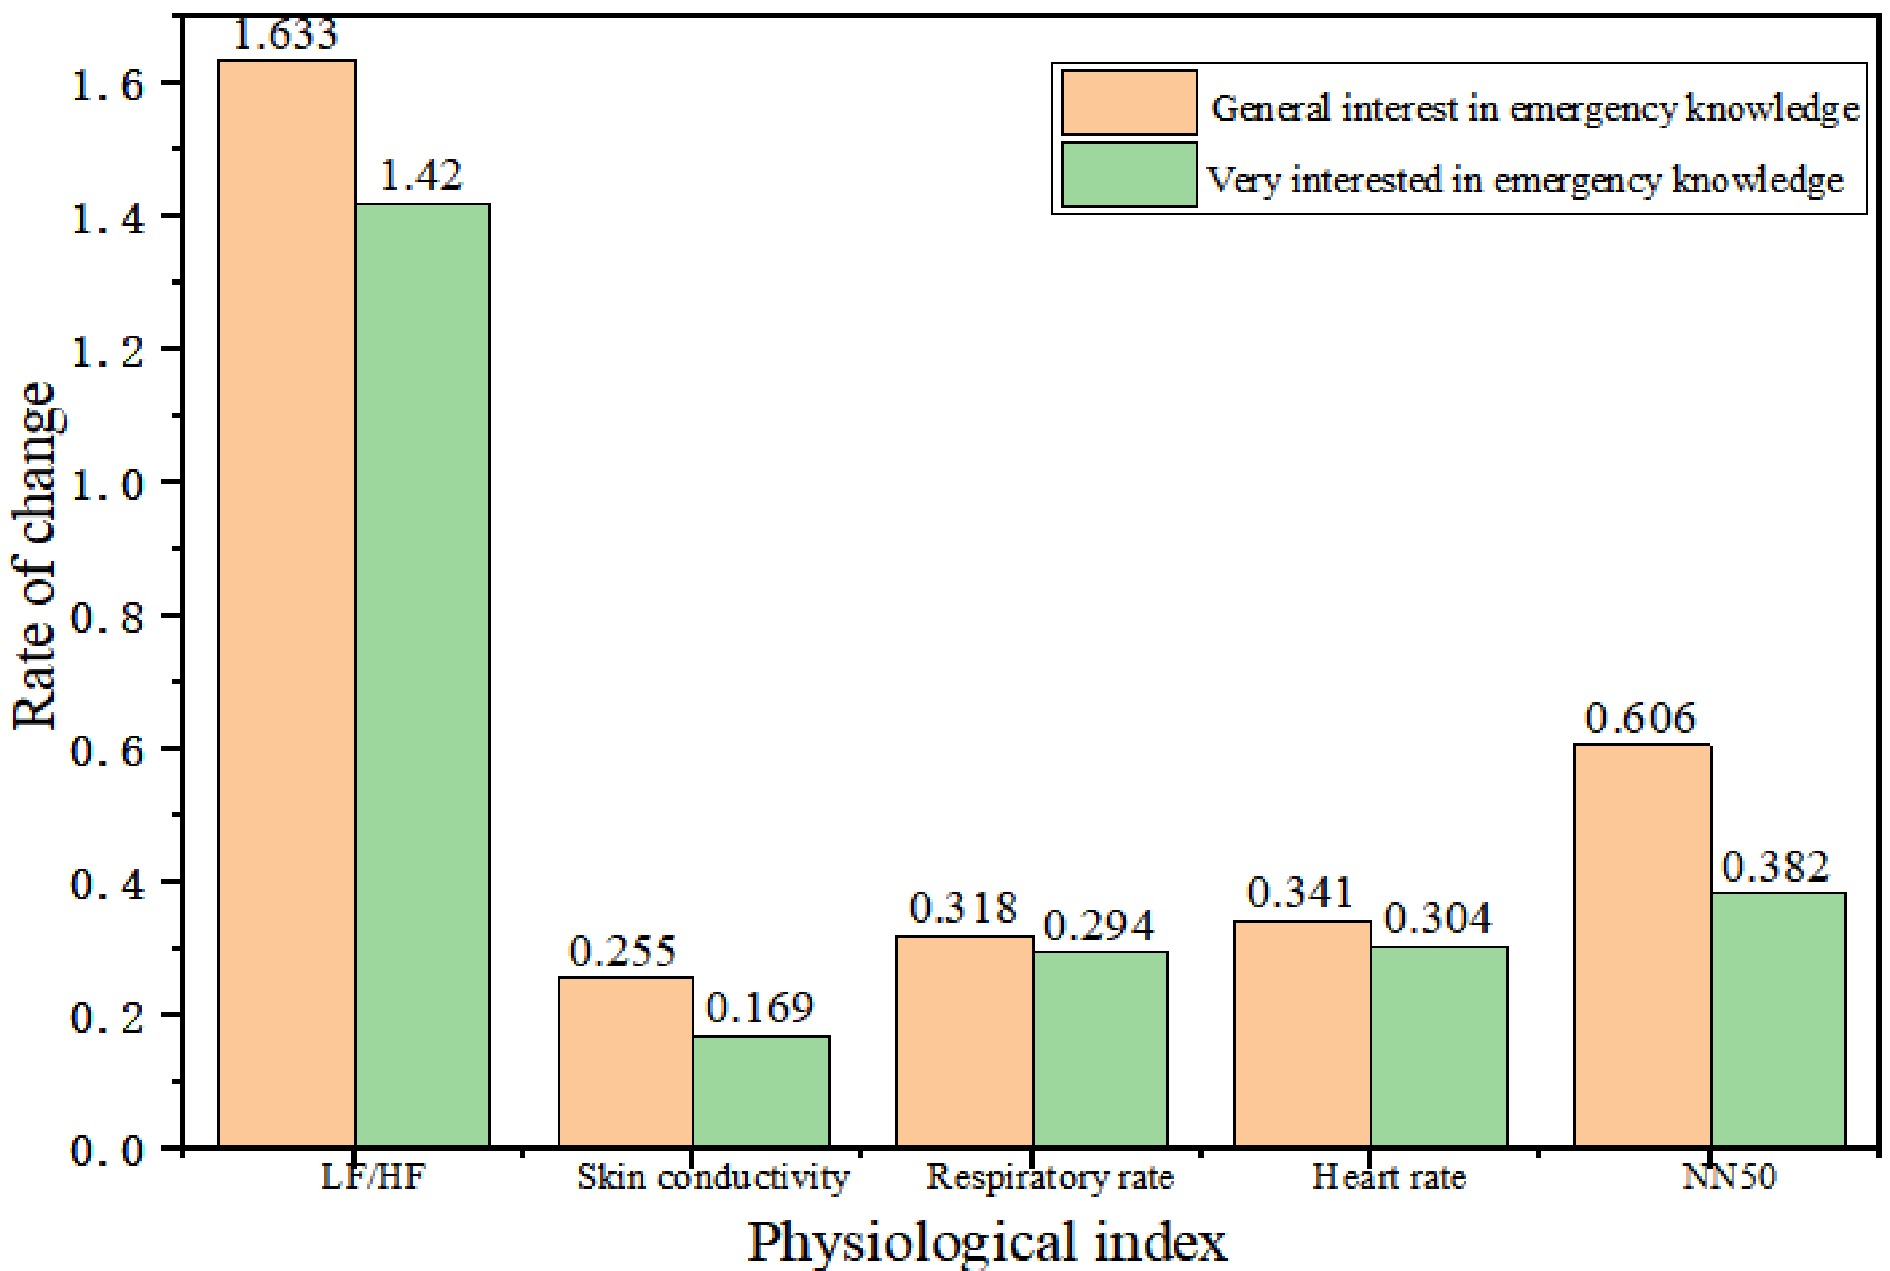
Figure 13.
The average change rate of physiological indexes in resting period and event period.
-
Evaluation item Score For questions 1 & 2, on a scale of 1−7, 1 being 'not at all realistic' and 7 being 'very realistic': 1. The fidelity of 3D objects in the scene 2. Test the fidelity of the task For questions 3−6, on a scale of 1−7, where 1 is 'strongly disagree' and 7 is 'strongly agree': 3. I have the freedom to control my movements within the situation 4. Experimental scenes can give me a sense of urgency to escape 5. I can concentrate in a situation 6. I felt no physical discomfort during the experiment Table 1.
Virtual reality system subjective evaluation scale.
-
Serial number Scoring item N Mean
valueStandard deviation 1 Fidelity of 3D objects 81 5.74 1.070 2 Test the fidelity of the task 81 5.79 1.104 3 You can freely control movement in the scene 81 5.86 1.181 4 The scene can bring a sense of urgency to escape 81 5.95 1.629 5 You can concentrate in the scene 81 6.32 0.849 6 There was no discomfort during the experiment 81 6.62 0.982 Valid N (list state) 81 Table 2.
Descriptive statistics of university emergency virtual situation project scores.
-
Resting period Event period LF/HF 2.252 3.781 Skin electricity (us) 10.031 11.856 Respiratory rate (times per min) 16.407 20.621 Heart rate (times per min) 81.340 89.190 NN50 9.950 12.810 Table 3.
Mean value of physiological indexes.
-
Physiological index Mean value Standard
deviation95% confidence interval for the difference t P Lower limit Upper limit Resting period LF/HF - Event period LF/HF −1.529 5.466 −2.613 −0.445 −2.797 0.006 Resting period electrocution - Event electrocution −1.825 3.574 −2.596 −1.054 −4.707 0.000 Resting respiratory rate - Event respiratory rate −4.214 4.335 −5.074 −3.353 −9.720 0.000 Resting heart rate - Event heart rate −7.850 10.833 −9.999 −5.700 −7.246 0.000 Resting period NN50 - Event period NN50 −2.860 12.616 −5.363 −0.357 −2.267 0.026 Table 4.
Five groups of physiological indicators paired sample test.
-
Indicators Number of
only childrenNumber of
non-only childrenLF/HF change rate 23 45 Rate of change of skin electricity 29 54 Respiratory rate change 31 67 Rate of change of heart rate 67 31 Rate of change of NN50 31 60 Table 5.
Affect of indicators based on only child/non-only child subjects.
-
Levene test of
variance equationT test for the mean value equation F Sig. t df Sig.
(bilateral)95% confidence interval
for the differenceLower limit Upper limit LF/HF change rate Assume equal variance 0.036 0.849 0.062 66 0.951 −0.455 0.484 Assume the variances are not equal 0.06 40.539 0.953 −0.477 0.506 Rate of change of skin electricity Assume equal variance 2.231 0.139 0.887 81 0.378 −0.104 0.270 Assume the variances are not equal 0.779 40.547 0.441 −0.133 0.299 Respiratory rate change Assume equal variance 0.351 0.555 −2.642 96 0.010 −0.268 −0.038 Assume the variances are not equal −2.557 54.077 0.013 −0.273 −0.033
Rate of change of Heart rateAssume equal variance 1.233 0.27 0.299 92 0.766 −0.058 0.078 Assume the variances are not equal 0.331 65.006 0.742 −0.052 0.072 Rate of change of NN50 Assume equal variance 0.522 0.472 0.044 89 0.965 −0.599 0.626 Assume the variances are not equal 0.042 52.073 0.967 −0.642 0.669 Table 7.
Independent sample test of single child and physiological indicators.
-
Indicators Number of subjects
with a professional
backgroundNumber of subjects
without a professional
backgroundLF/HF change rate 21 47 Rate of change of skin electricity 27 58 Respiratory rate change 31 69 Rate of change of heart rate 29 67 Rate of change of NN50 30 63 Table 6.
Professional background data.
-
Levene test of
variance equationT-test for mean equation F Sig. t df Sig.(both sides) 95% confidence interval
for the differenceLower limit Upper limit LF/HF change rate Assumed equal variance 6.713 0.012 0.54 66 0.591 −0.350 0.609 Suppose the variances are not equal 0.638 58 0.526 −0.277 0.537 Skin electrical change rate Assumed equal variance 0.037 0.848 −1.423 83 0.158 −0.320 0.053 Suppose the variances are not equal −1.478 55.875 0.145 −0.314 0.047 Rate of change of respiratory rate Assumed equal variance 0.41 0.523 −0.89 98 0.375 −0.176 0.067 Suppose the variances are not equal −0.841 50.76 0.405 −0.184 0.076 Heart rate change rate Assumed equal variance 6.897 0.01 −0.118 94 0.907 −0.070 0.062 Suppose the variances are not equal −0.095 36.022 0.925 −0.088 0.080 NN50 change rate Assumed equal variance 2.144 0.147 −0.138 91 0.890 −0.653 0.568 Suppose the variances are not equal −0.123 43.378 0.903 −0.741 0.656 Table 8.
Independent sample test of professional background and five groups of physiological indicators.
-
Indicators Number of participants in emergency drills Number of people who have not participated in emergency drills LF/HF change rate 47 21 Rate of change of skin electricity 59 26 Respiratory rate change 59 26 Rate of change of heart rate 68 28 Rate of change of NN50 64 29 Table 9.
Number of participants who participated in emergency drills.
-
Levene test of
variance equationT-test for mean equation F Sig. t df Sig.(both sides) 95% confidence interval
for the differenceLower limit Upper limit LF/HF change rate Assumed equal variance 0.553 0.46 0.926 66 0.358 −0.256 0.699 Suppose the variances are not equal 0.897 35.797 0.376 −0.279 0.723 Skin electrical change rate Assumed equal variance 1.913 0.17 −1.882 83 0.063 −0.363 0.010 Suppose the variances are not equal −2.265 74.909 0.026 −0.332 −0.021 Rate of change of respiratory rate Assumed equal variance 5.14 0.026 −2.205 98 0.030 −0.253 −0.013 Suppose the variances are not equal −2.49 73.816 0.015 −0.240 −0.027 Heart rate change rate Assumed equal variance 0.183 0.669 −0.266 94 0.791 −0.076 0.058 Suppose the variances are not equal −0.234 39.46 0.816 −0.087 0.069 NN50 change rate Assumed equal variance 1.879 0.174 −0.589 91 0.557 −0.798 0.433 Suppose the variances are not equal −0.703 83.071 0.484 −0.699 0.334 Table 10.
Have participated in an emergency drill and independent sample test of five groups of physiological indicators.
-
Indicators Number of people who are generally interested in emergency knowledge Number of people who are very interested in emergency knowledge LF/HF change rate 30 38 Rate of change of skin electricity 40 45 Respiratory rate change 48 52 Rate of change of heart rate 47 49 Rate of change of NN50 46 47 Table 11.
The number of subjects interested in emergency knowledge.
-
Levene test of variance equation T-test for mean equation F Sig. t df Sig.(both sides) 95% confidence interval for the difference Lower limit Upper limit LF/HF change rate Assumed equal variance 0.075 0.785 0.955 66 0.343 −0.232 0.657 Suppose the variances are not equal 0.957 62.961 0.342 −0.231 0.656 Skin electrical change rate Assumed equal variance 0.315 0.576 0.978 83 0.331 −0.089 0.261 Suppose the variances are not equal 0.977 81.259 0.332 −0.089 0.261 Rate of change of respiratory rate Assumed equal variance 0.161 0.689 0.412 98 0.681 −0.089 0.136 Suppose the variances are not equal 0.411 94.784 0.682 −0.090 0.136 Heart rate change rate Assumed equal variance 0.146 0.704 1.192 94 0.236 −0.024 0.097 Suppose the variances are not equal 1.187 89.221 0.238 −0.024 0.097 NN50 change rate Assumed equal variance 2.273 0.135 0.78 91 0.437 −0.346 0.793 Suppose the variances are not equal 0.777 82.297 0.439 −0.348 0.796 Table 12.
Independent sample test of the degree of interest in emergency knowledge and physiological indicators.
Figures
(13)
Tables
(12)