-
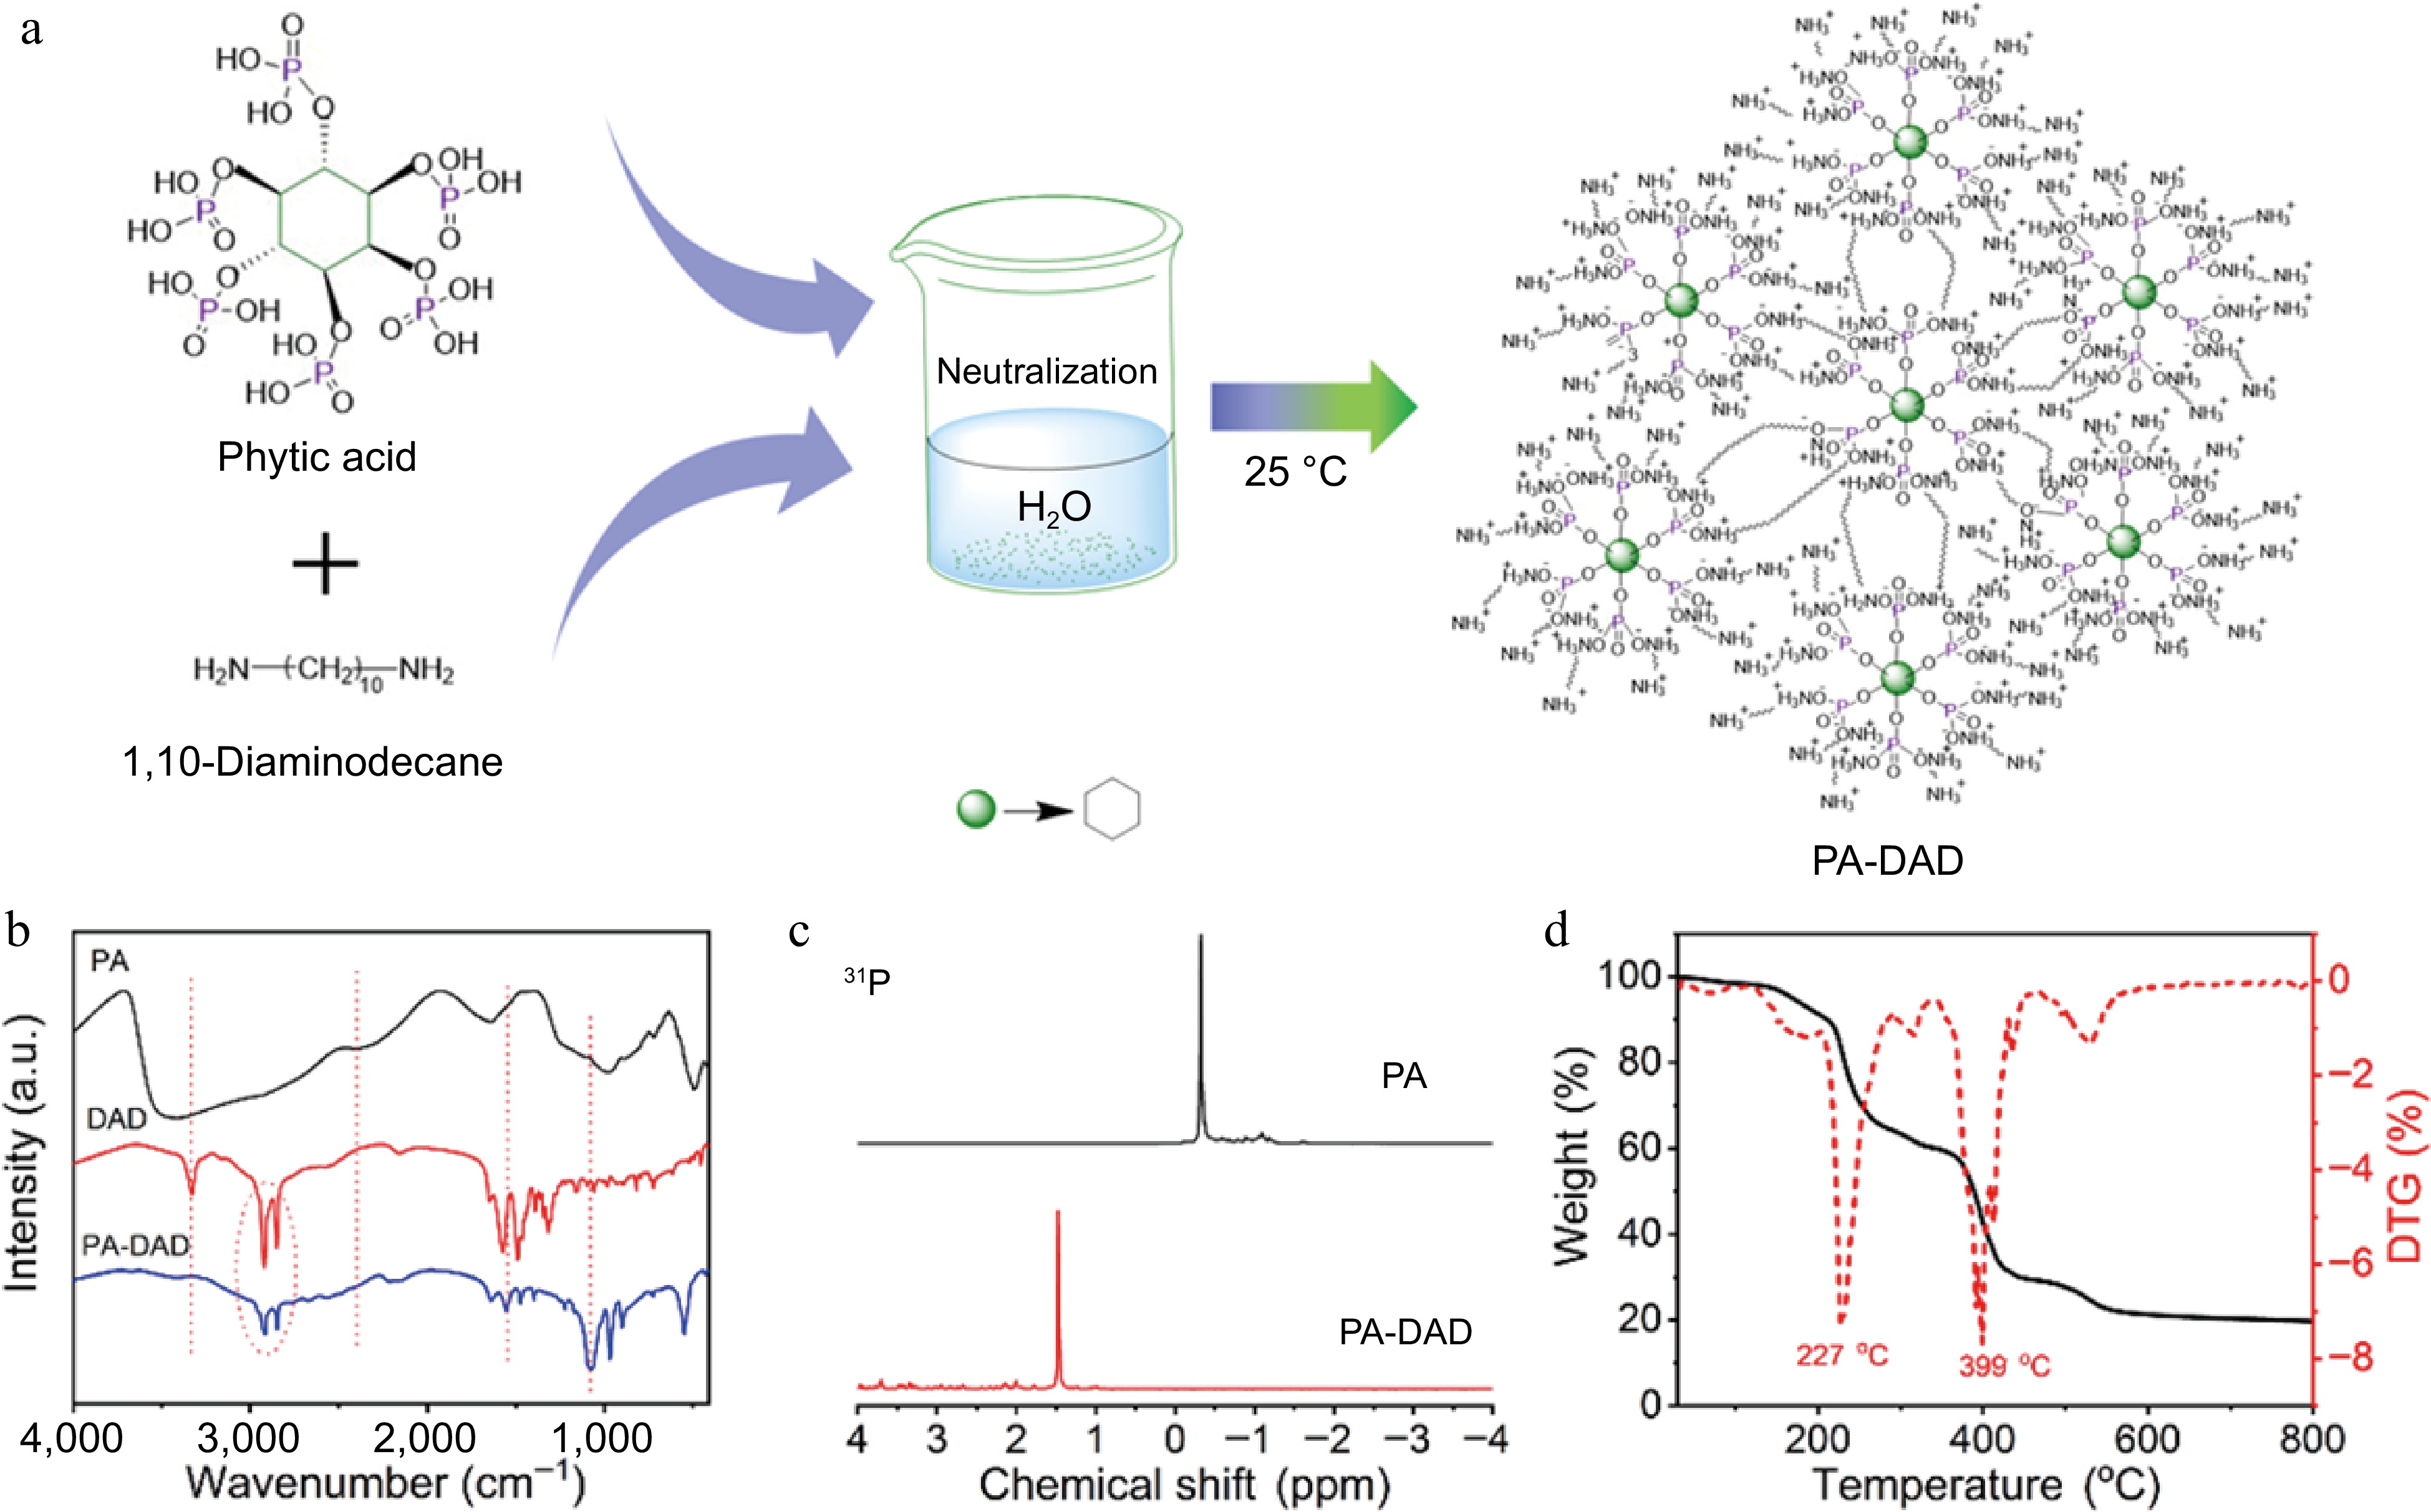
Figure 1.
(a) Schematic diagram for the prepared processing of PA-DAD, (b) FTIR spectra of DAD, PA and PA-DAD, (c) 31P NMR curve of PA-DAD and PA, (d) TG curves of PA-DAD.
-
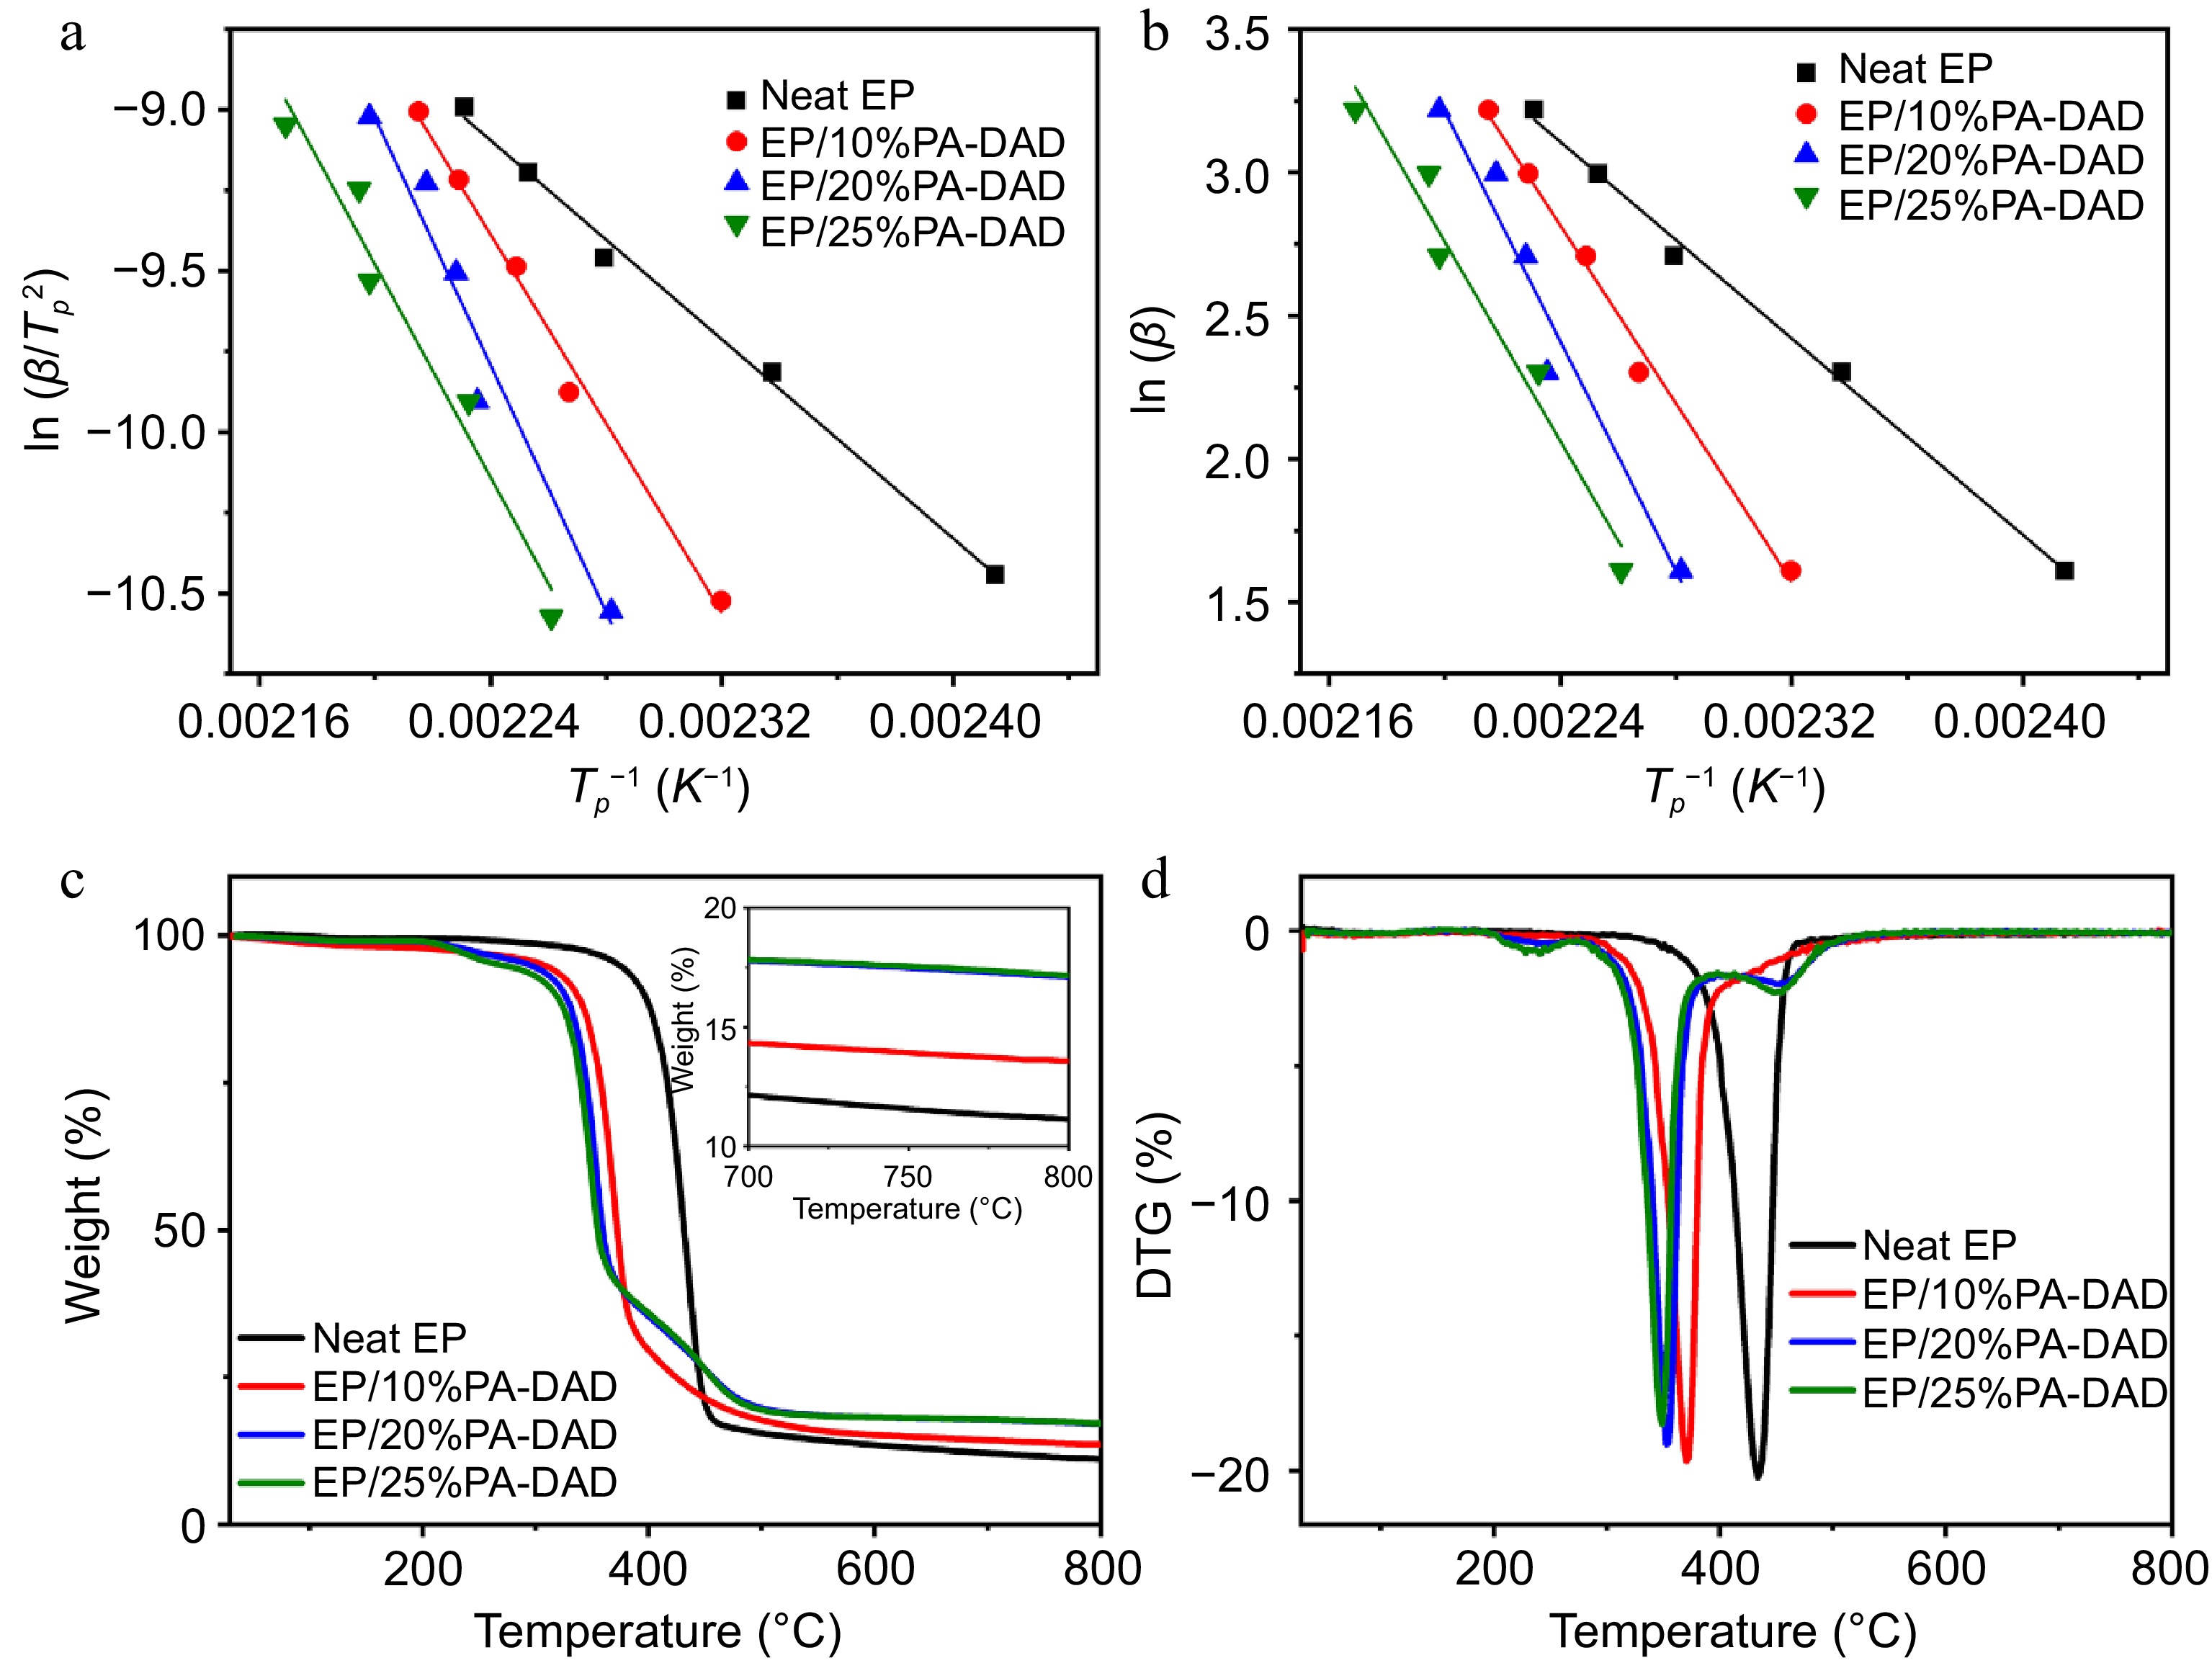
Figure 2.
The calculated results of (a) Kissinger, and (b) Ozawa methods for neat EP and its different composites, (c) TG and (d) DTG curves for EP composites.
-
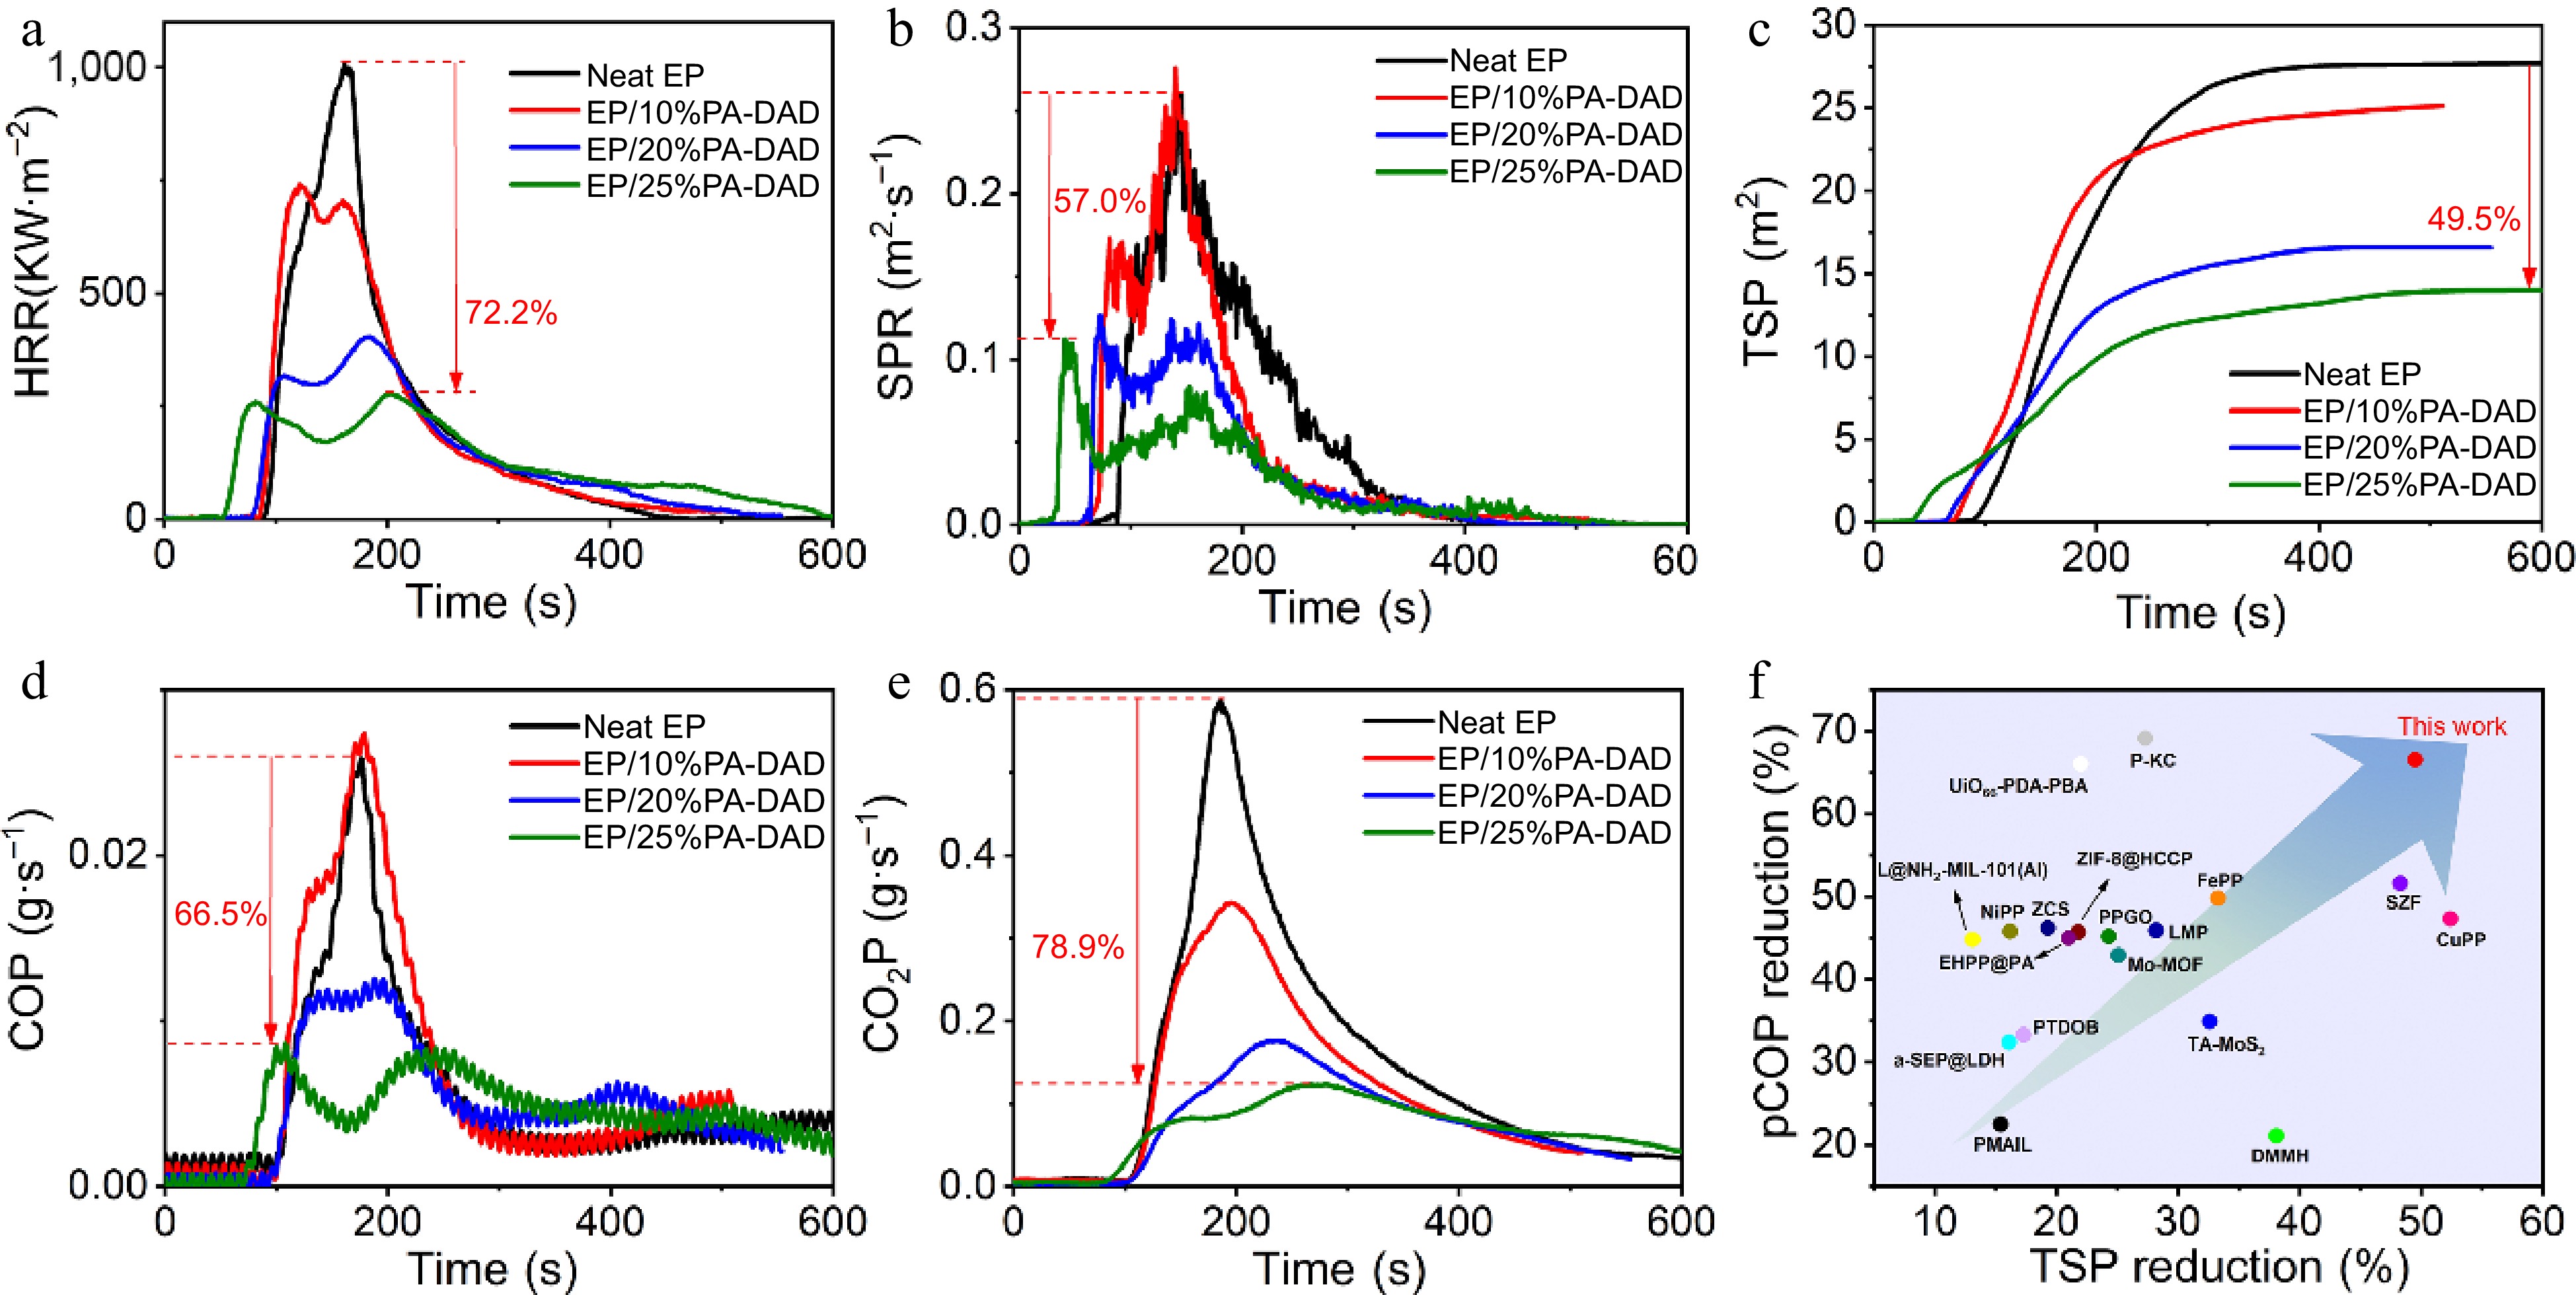
Figure 3.
(a) HRR, (b) SPR, (c) TSP, (d) COP, (e) CO2P curves vs time for EP composites under a flux with 35 kW/m2, and (f) the TSP reduction vs pCOP reduction of PA-DAD compared with other works.
-
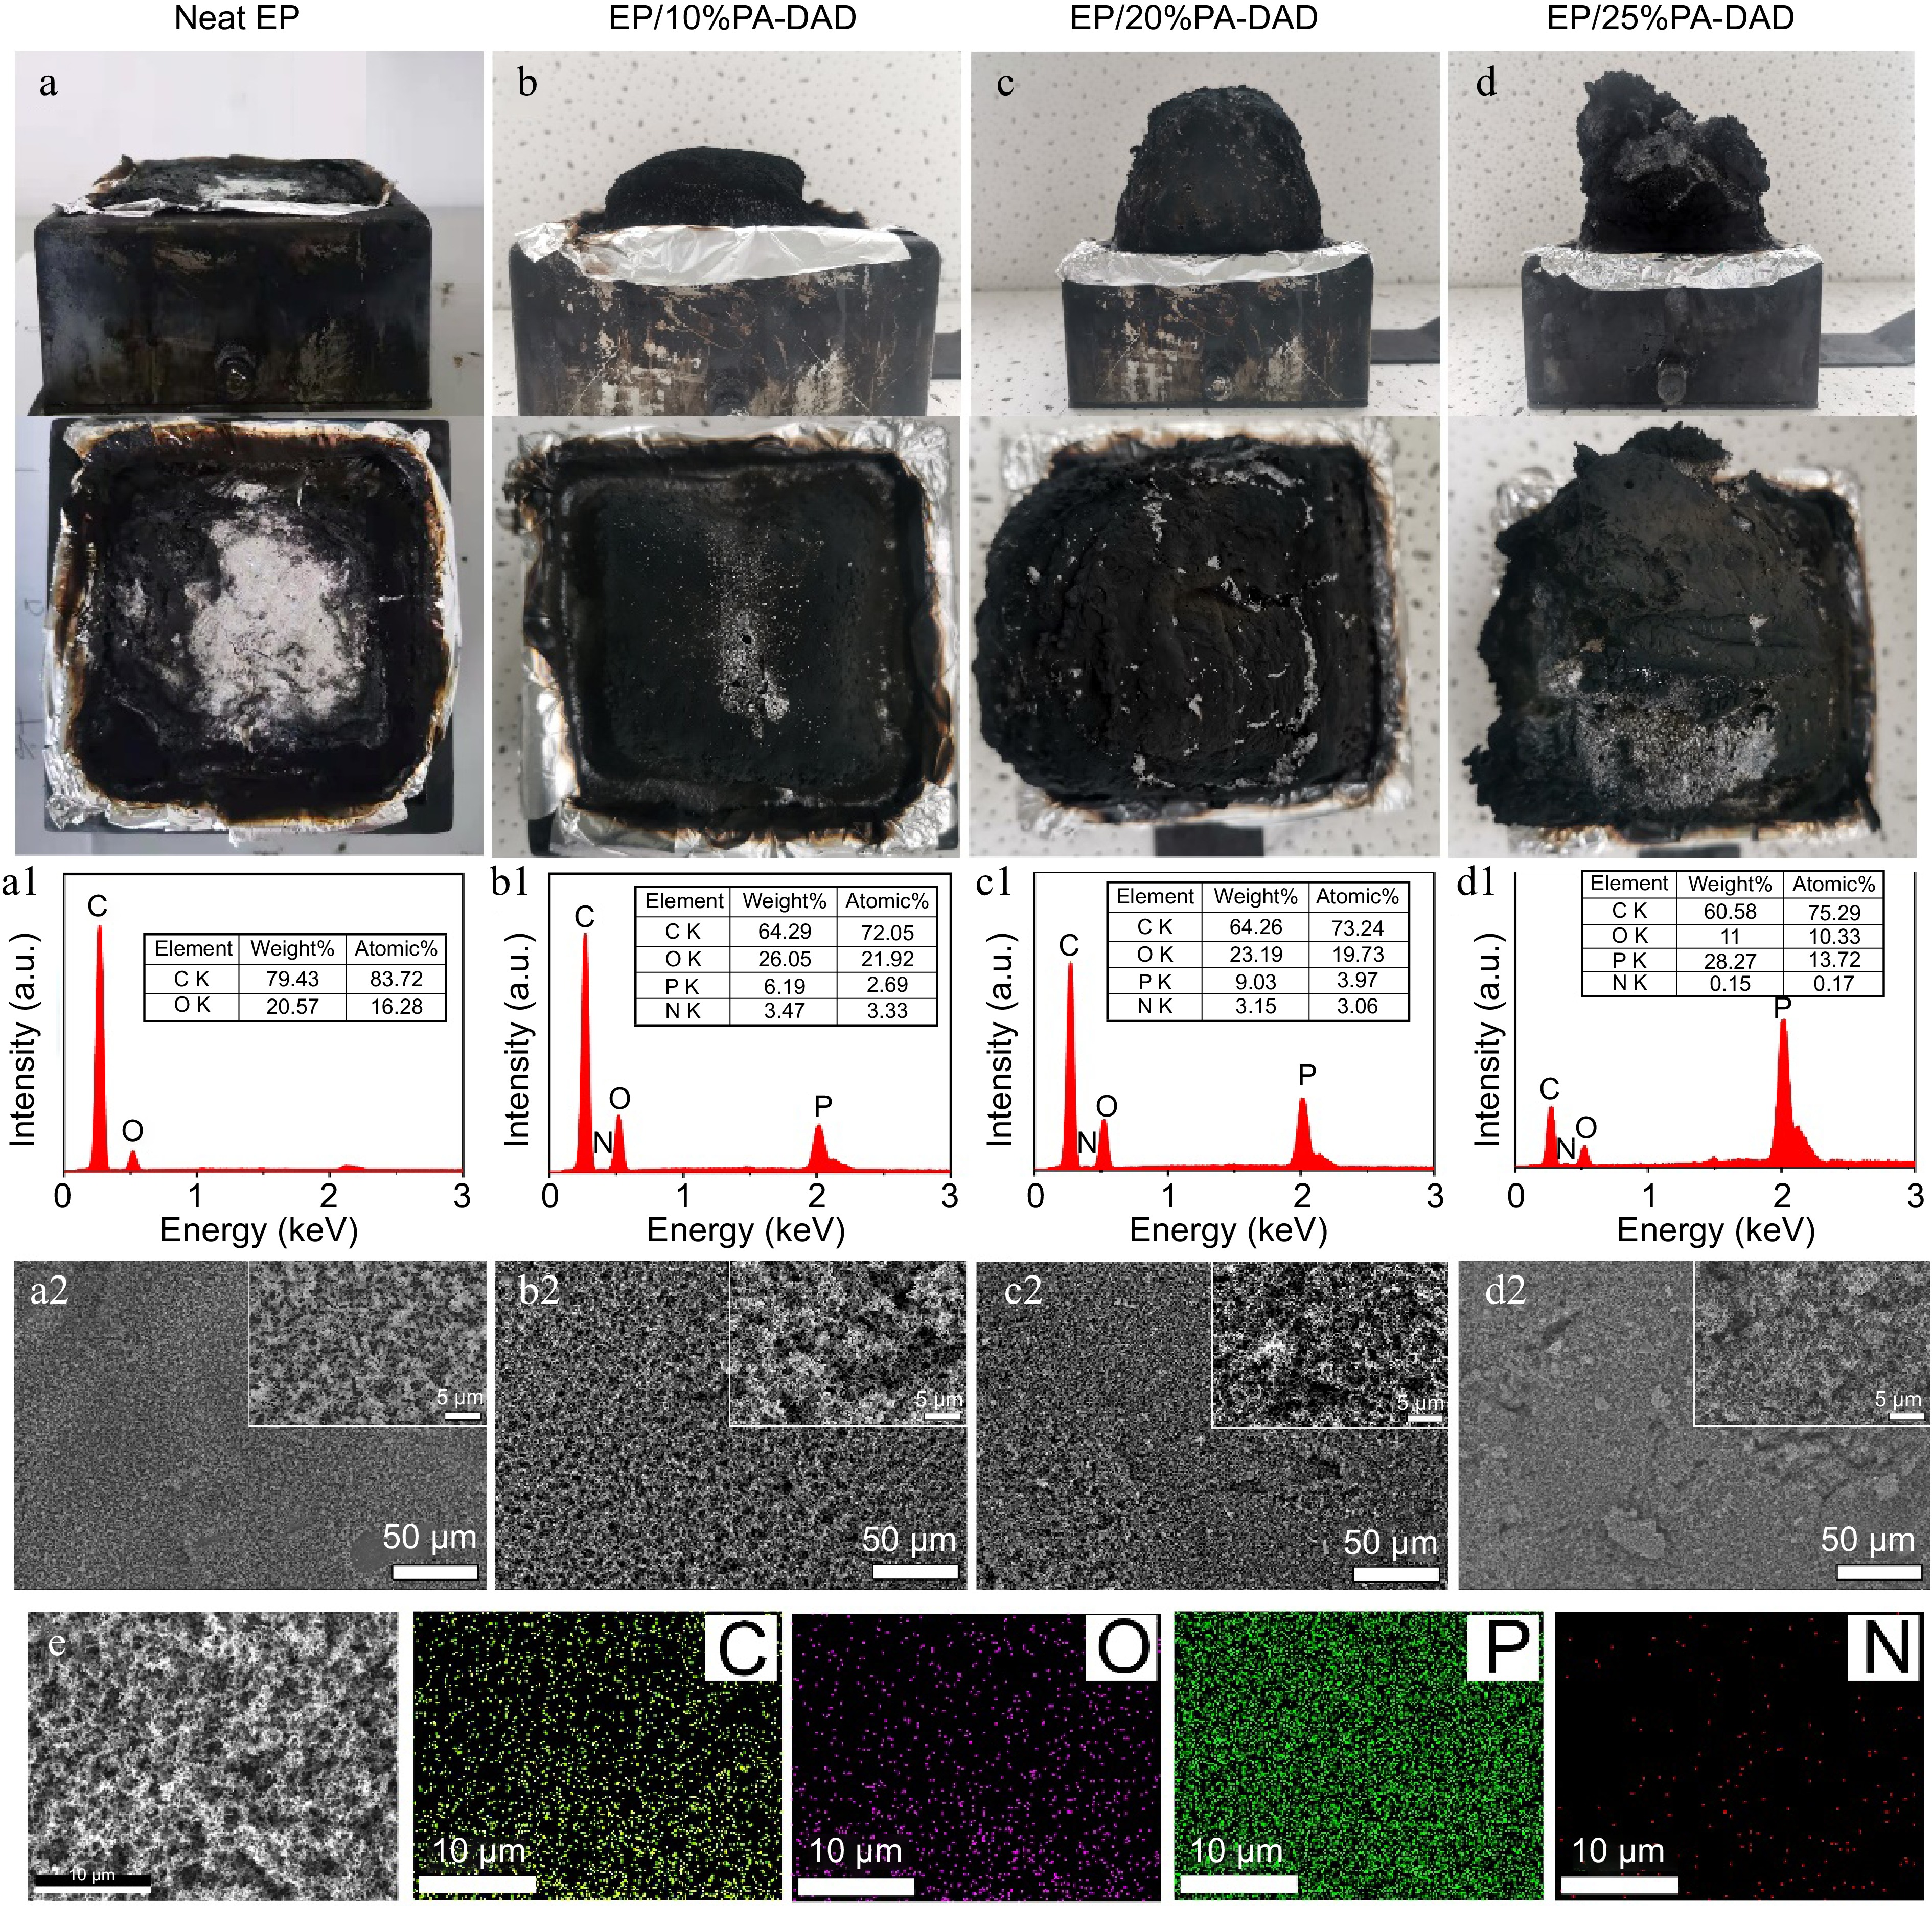
Figure 4.
Digital photos of residual chars from cone calorimetry for (a) neat EP, (b) EP/10% PA-DAD, (c) EP/20% PA-DAD, (d) EP/25% PA-DAD. (a1)−(d1) EDS results and (a2)−(d2) SEM photos for corresponding residue char. (e) The images of elemental mapping for residue chars of EP/25% PA-DAD.
-
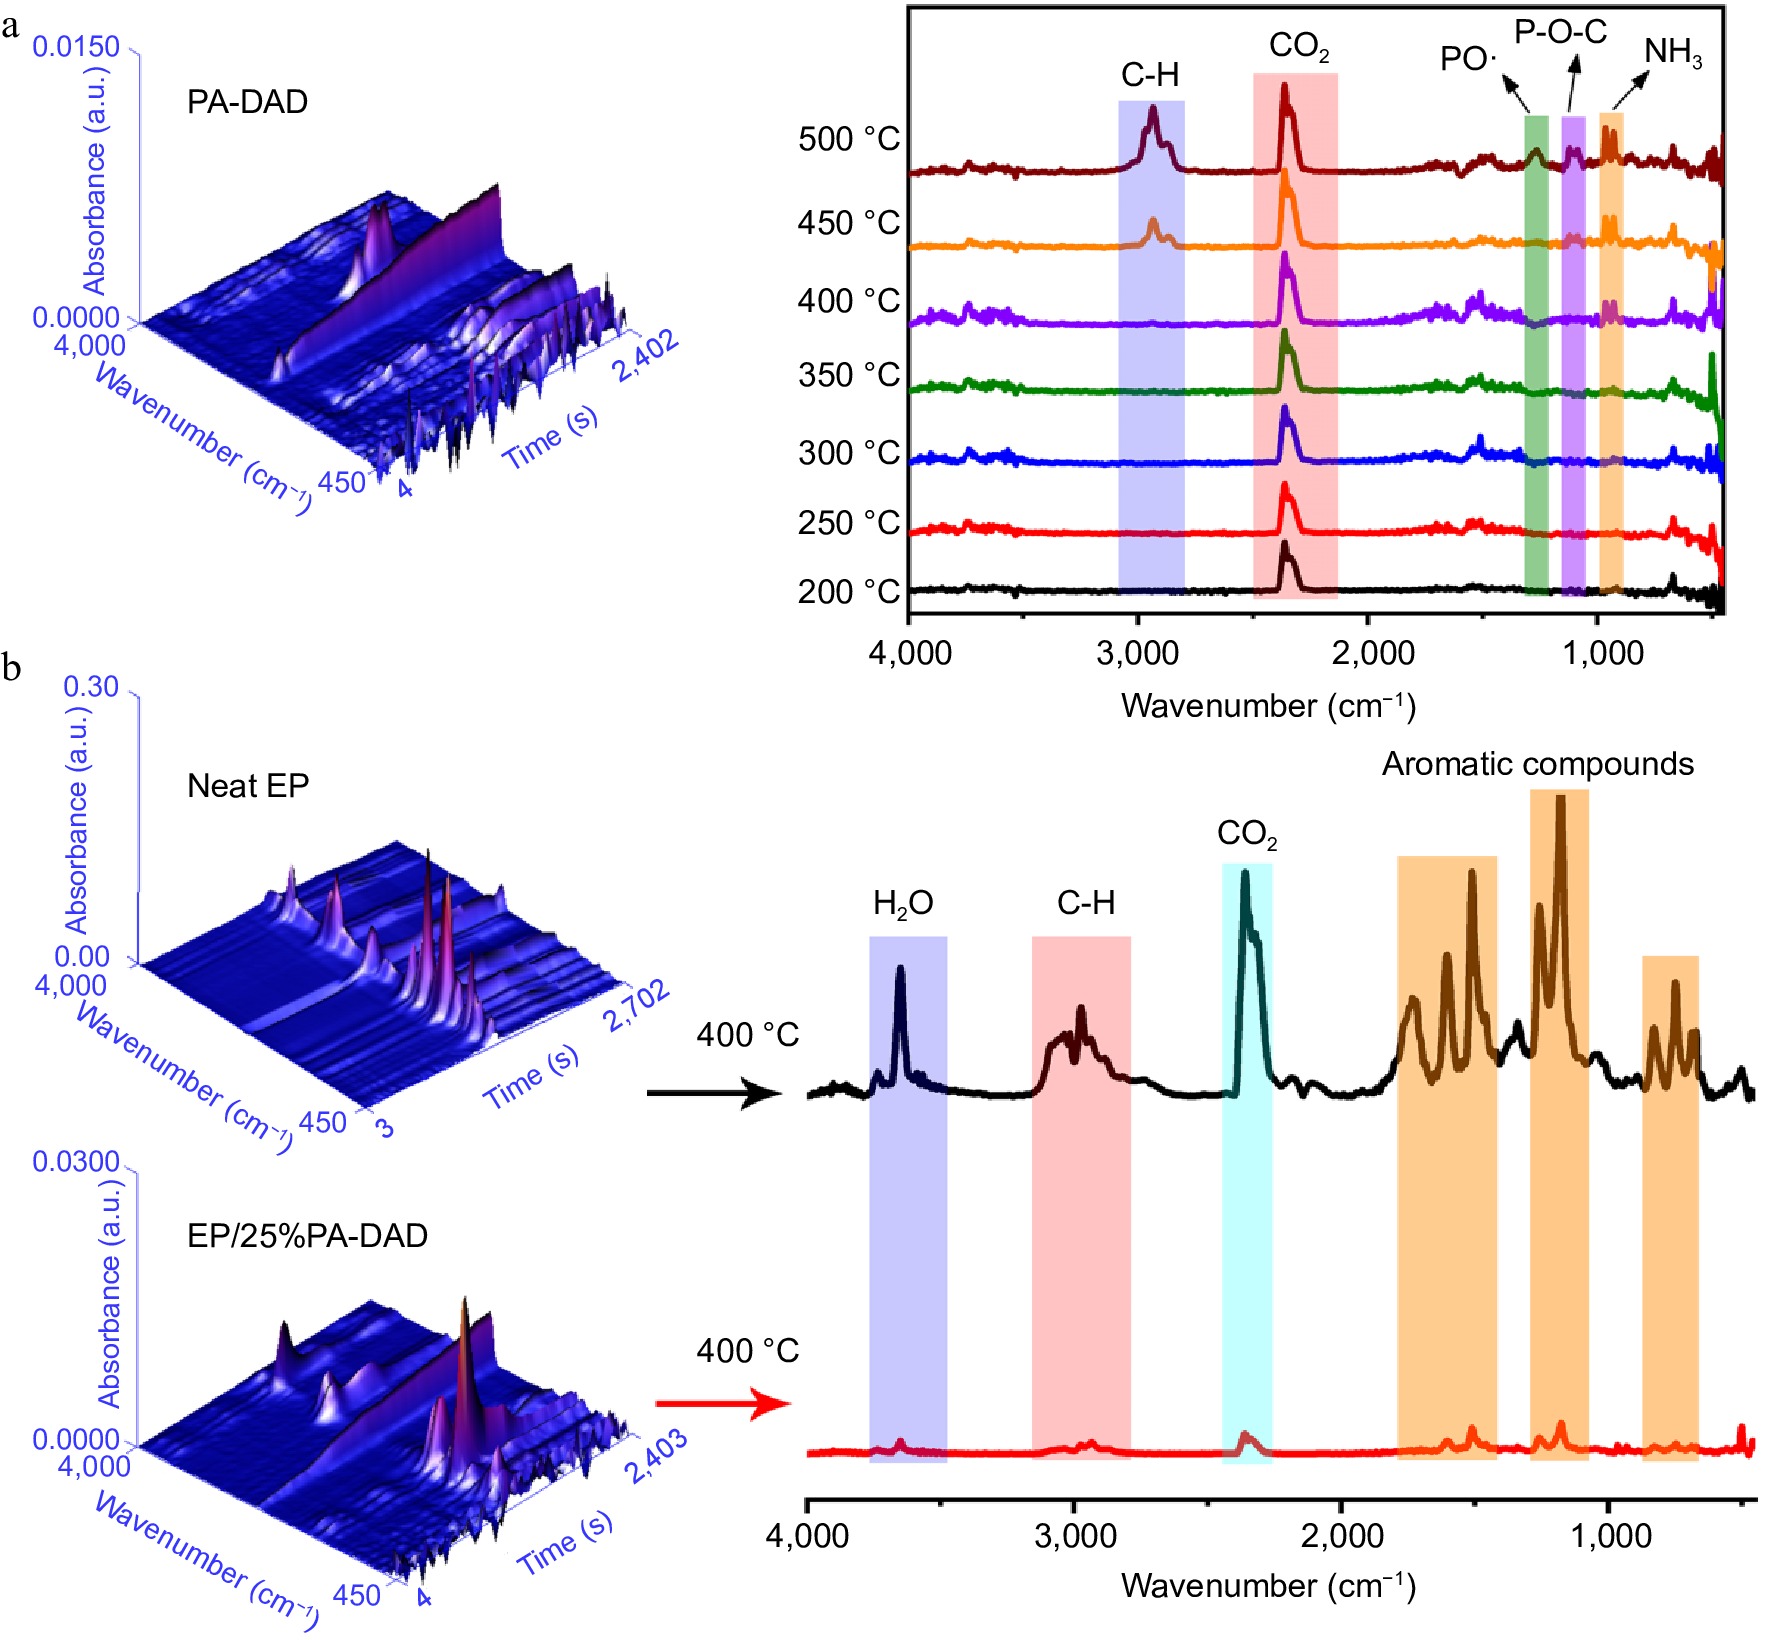
Figure 5.
(a) FTIR 3D and 2D spectra from pyrolysis products for PA-DAD. (b) FTIR 3D and 2D spectra from the pyrolysis products for pure EP and EP/25% PA-DAD with the maximum rate of decomposition.
-
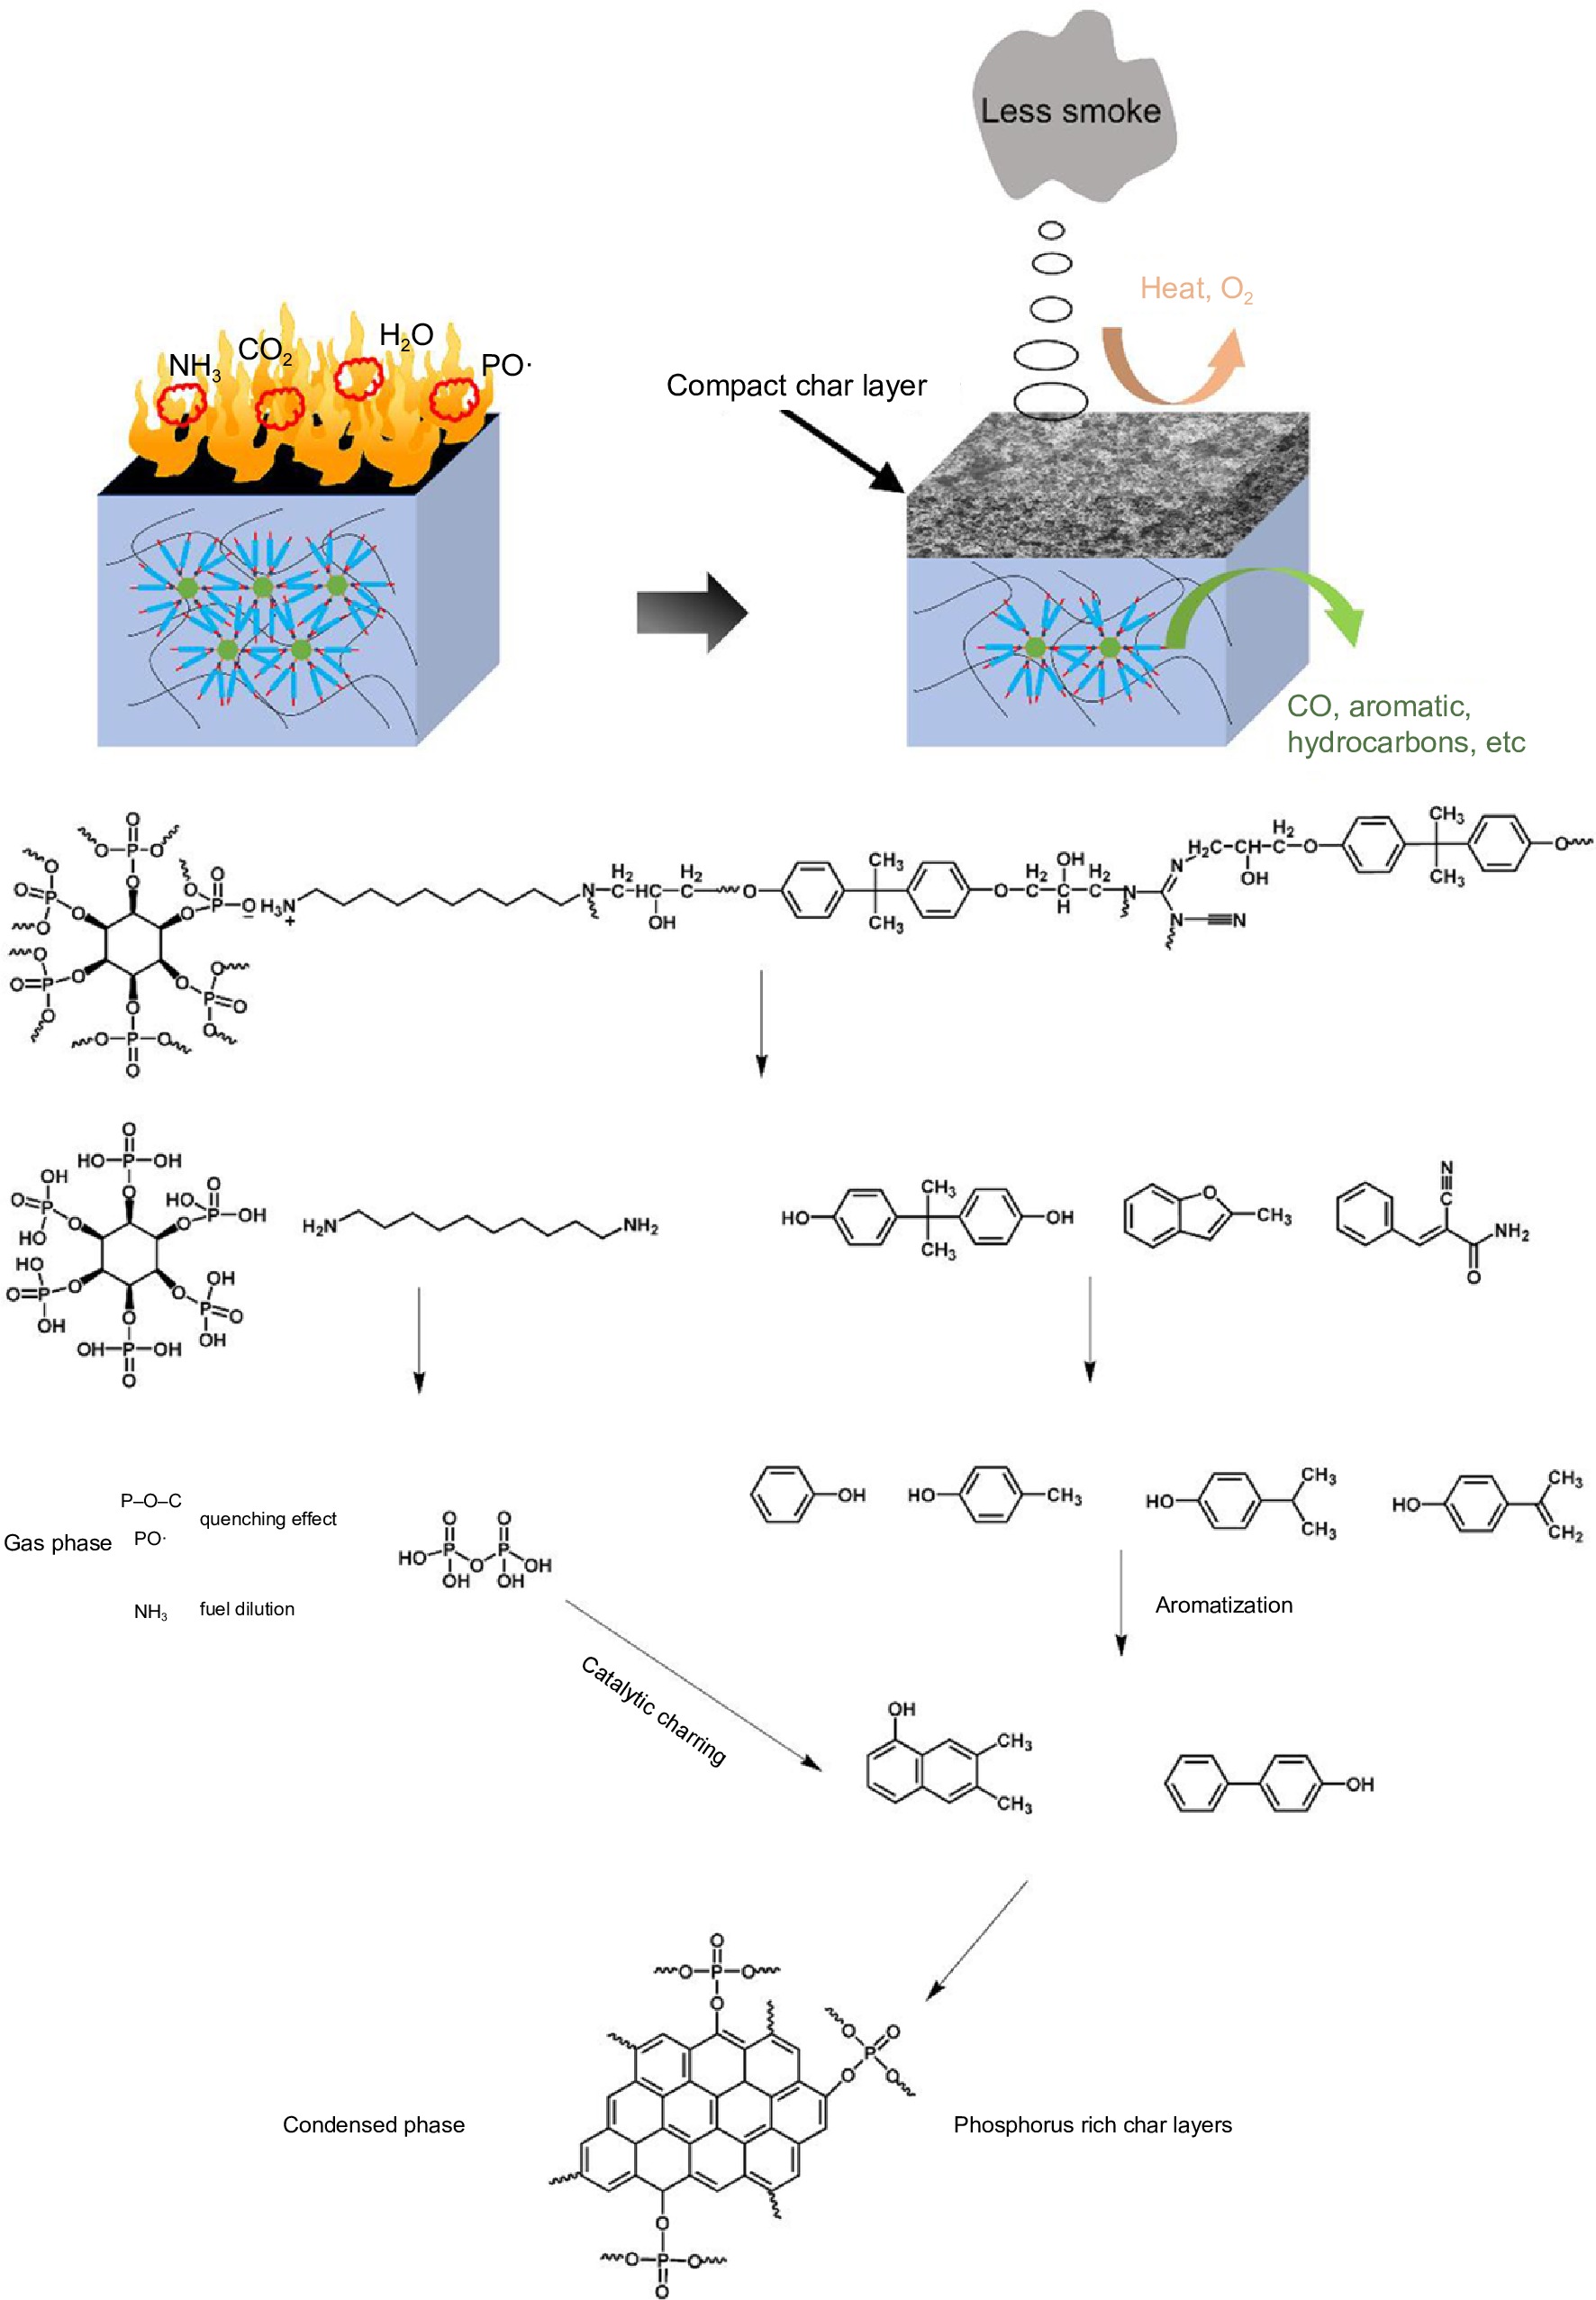
Figure 6.
Speculated pyrolysis and flame-retardant mechanisms for composites with PA-DAD.
-
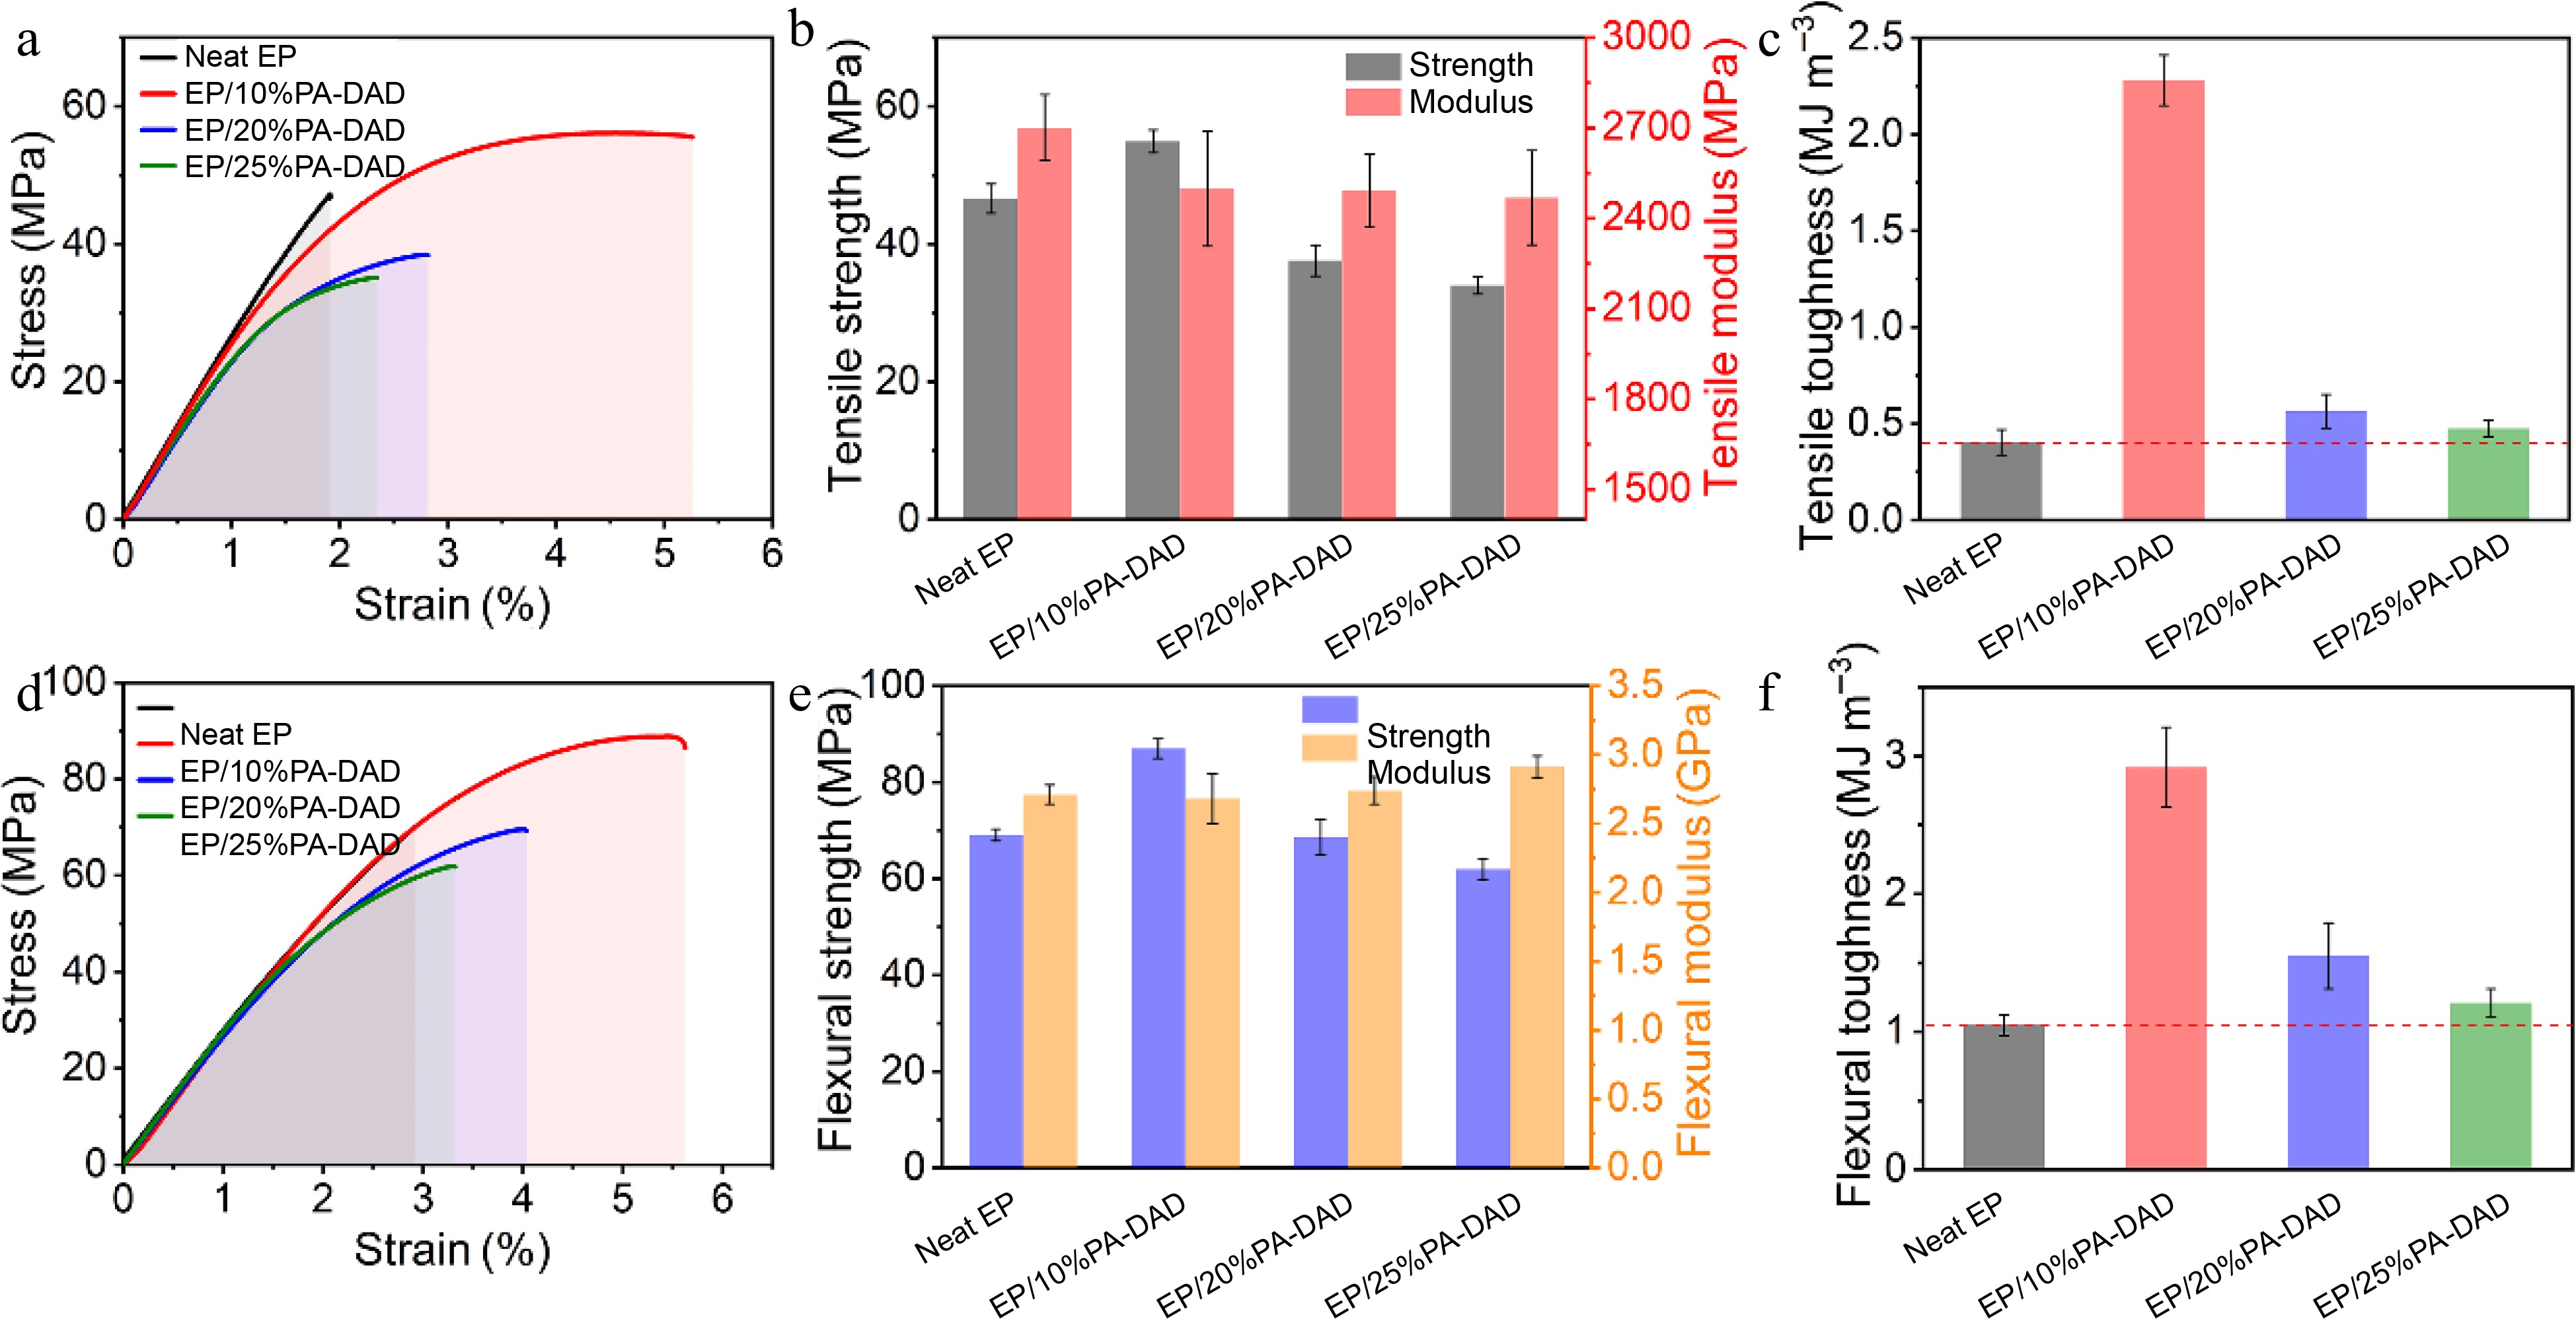
Figure 7.
(a) Tensile stress-strain curves, (b) tensile strength and modulus, (c) tensile toughness, (d) flexural stress-strain curves (e) flexural strength, (f) flexural toughness for EP and its corresponding composites.
-
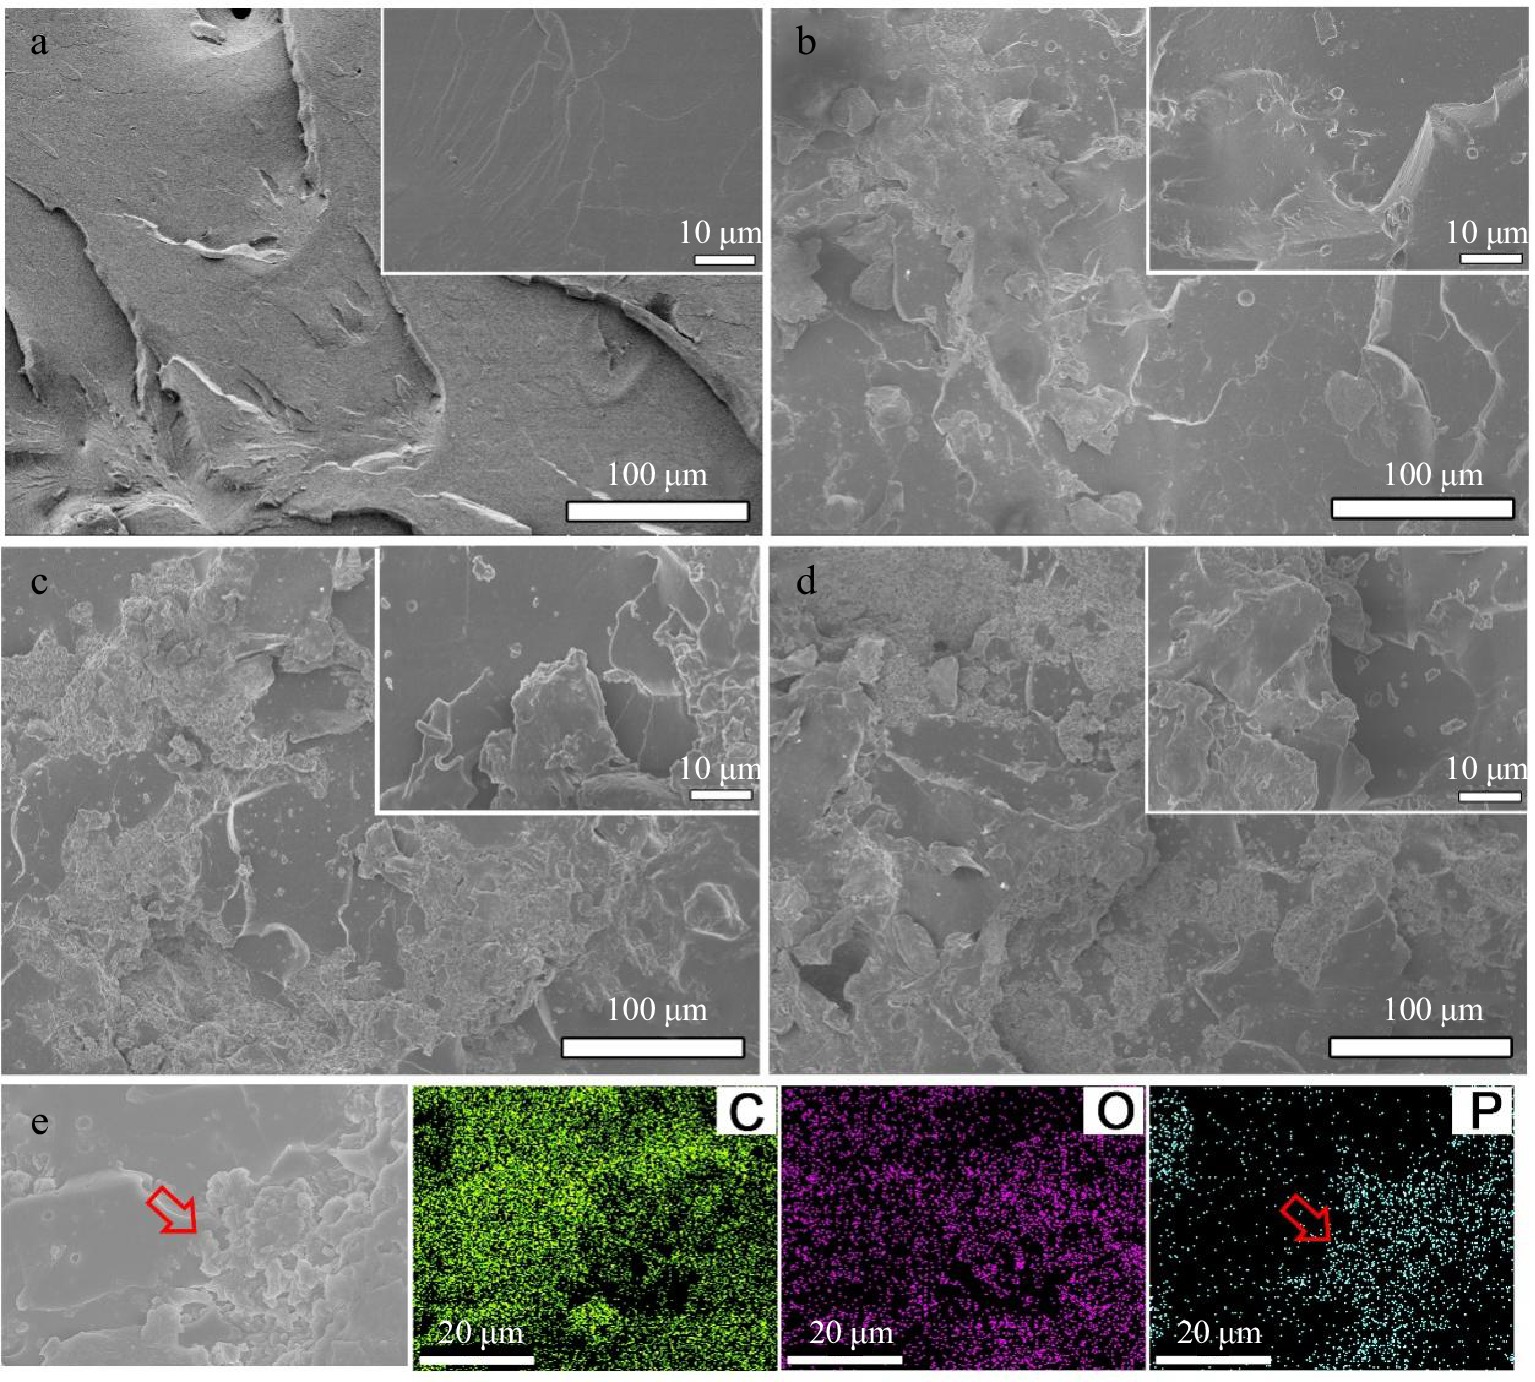
Figure 8.
SEM images from the fractured surfaces of tensile samples for (a) neat EP, (b) EP/10% PA-DAD, (c) EP/20% PA-DAD, and (d) EP/25% PA-DAD. (e) EDS mapping photograph of tensile fractured surfaces for EP/25% PA-DAD.
-
Sample UL-94 LOI (%) Rating Dripping t1/t2(s) Neat EP NR YES > 30 20.4 EP/10%PA-DAD NR NO > 30 23.6 EP/20%PA-DAD V-1 NO 8.0/2.4 25.3 EP/25%PA-DAD V-0 NO 1.1/0.9 28.0 Table 1.
Detailed results corresponding to UL-94 and LOI for EP composites.
-
Samples TTI
(s)TPHRR
(s)pHRR
(kW/m2)THR
(MJ/m2)pSPR
(m2/s)TSP
(m2)pCOP
(g/s)pCO2P
(g/s)FIGRA
(kW/m2·s)Neat EP 86 ± 3 162 ± 5 1007 ± 32 99.2 ± 1.9 0.26 ± 0.010 27.7 ± 2.1 0.0258 ± 0.0007 0.586 ± 0.013 6.21 EP/10% PA-DAD 71 ± 2 121 ± 4 740 ± 26 96.1 ± 2.1 0.28 ± 0.012 25.1 ± 1.7 0.0274 ± 0.0006 0.343 ± 0.009 6.12 EP/20% PA-DAD 63 ± 2 184 ± 4 403 ± 24 71.9 ± 0.7 0.12 ± 0.006 16.6 ± 0.9 0.0125 ± 0.0005 0.176 ± 0.007 2.19 EP/25% PA-DAD 34 ± 1 203 ± 3 280 ± 19 71.2 ± 0.9 0.11 ± 0.007 14.0 ± 1.1 0.0086 ± 0.0003 0.124 ± 0.008 1.38 Table 2.
Data from Cone calorimeter for EP and its composites.
Figures
(8)
Tables
(2)