-
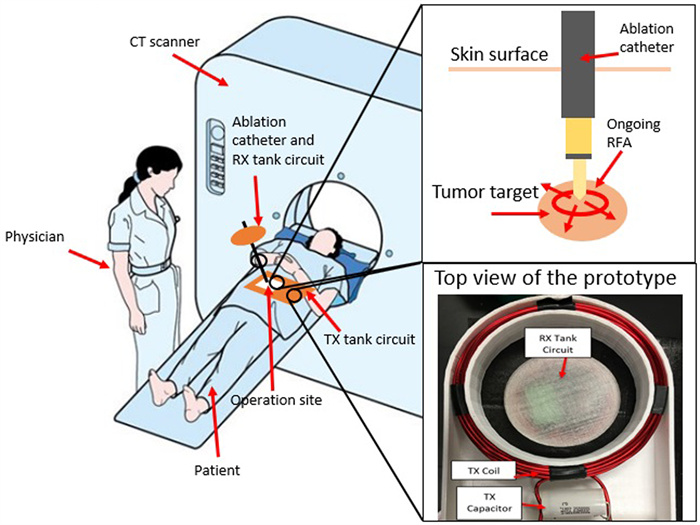
Figure 1.
Schematic diagram of the wireless ablation system. The wireless catheter consists of the RX tank circuit.
-
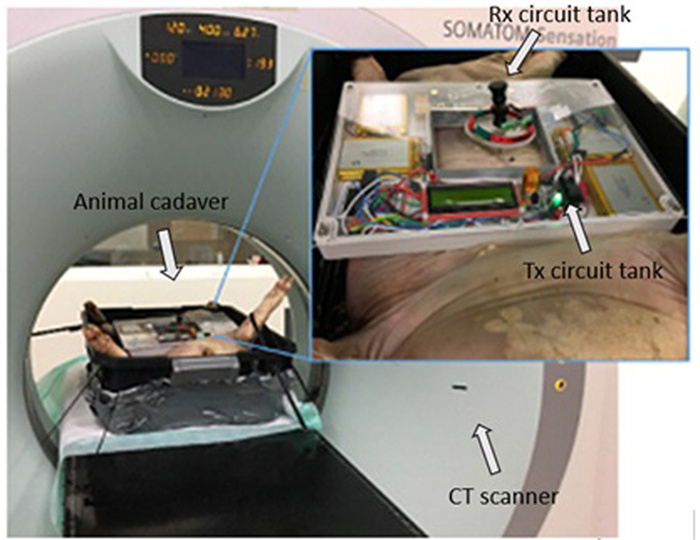
Figure 2.
System mounted on top of an animal cadaver.
-
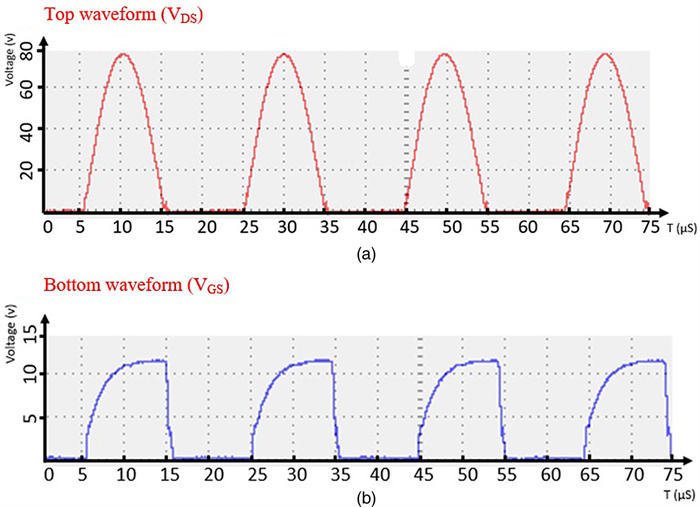
Figure 3.
Time-domain analysis of VGS and VDS of the cross-coupled MOSFET: (a) the top waveform (VDS) and (b) the bottom waveform (VGS) of the cross-coupled MOSFET.
-
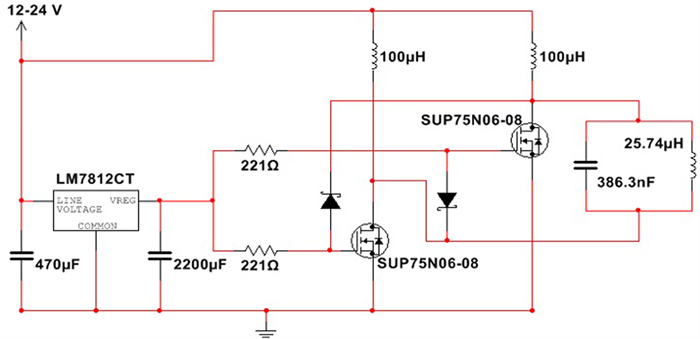
Figure 4.
Circuit diagram of the transmitting (TX) circuit.
-
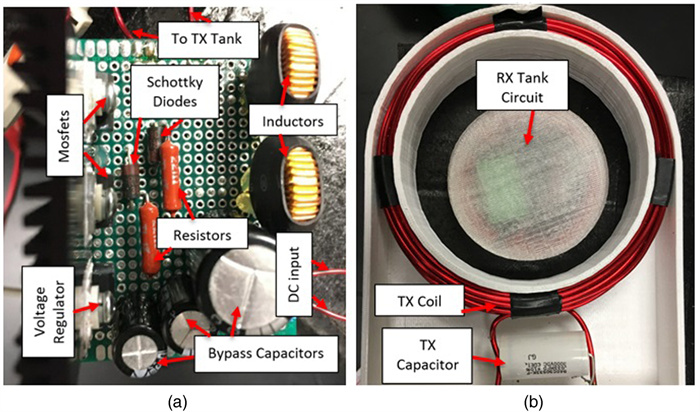
Figure 5.
Photo of (a) the TX circuit and (b) the TX and RX tank circuit.
-
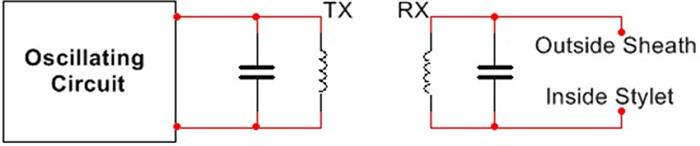
Figure 6.
Diagram of the transmitting (TX) and receiving (RX) circuits.
-
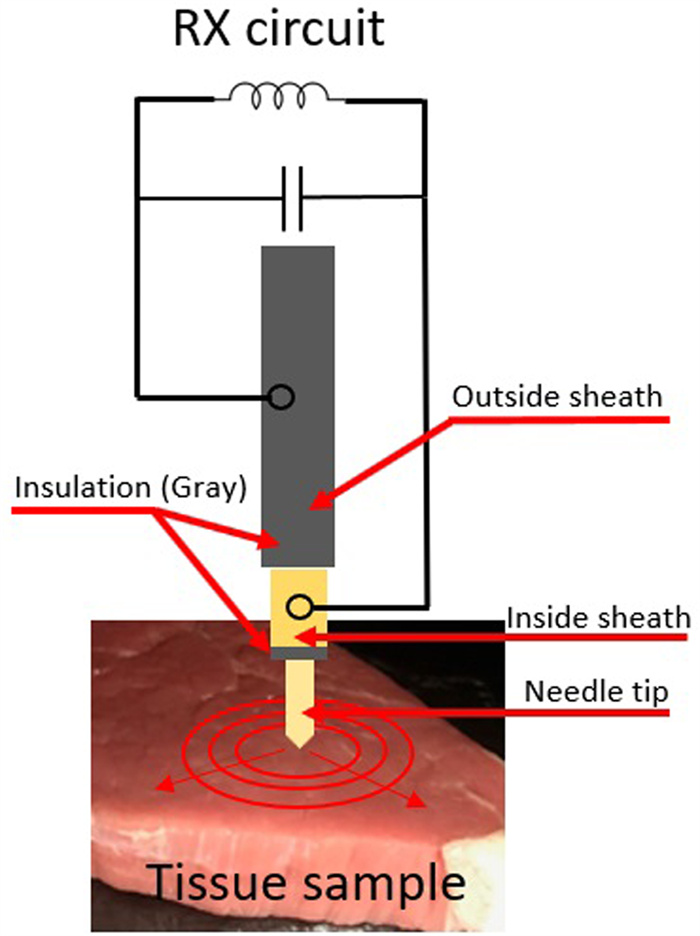
Figure 7.
Shows how the Rx tank circuit is connected with the ablation electrode.
-
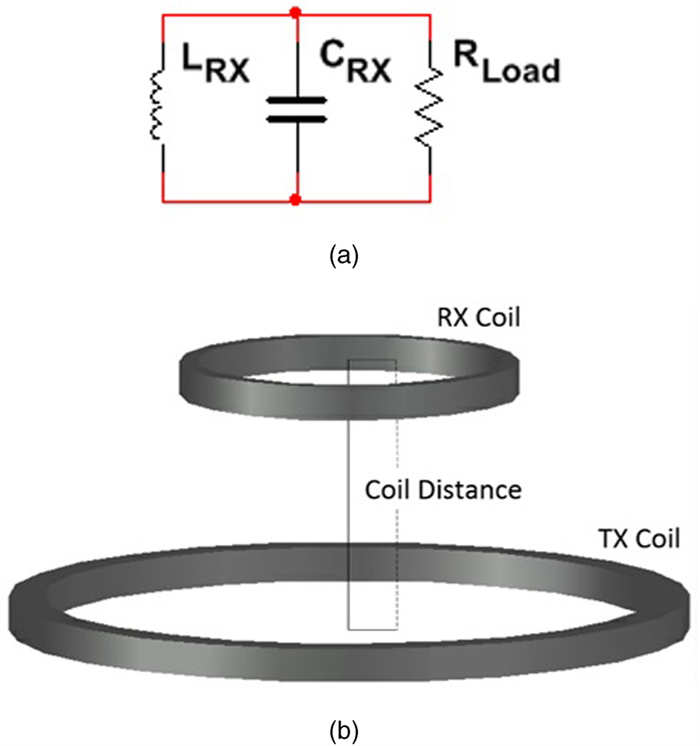
Figure 8.
Diagram of the receiving (RX) circuit during testing and ablation: (a) circuit diagram and (b) schematic diagram.
-
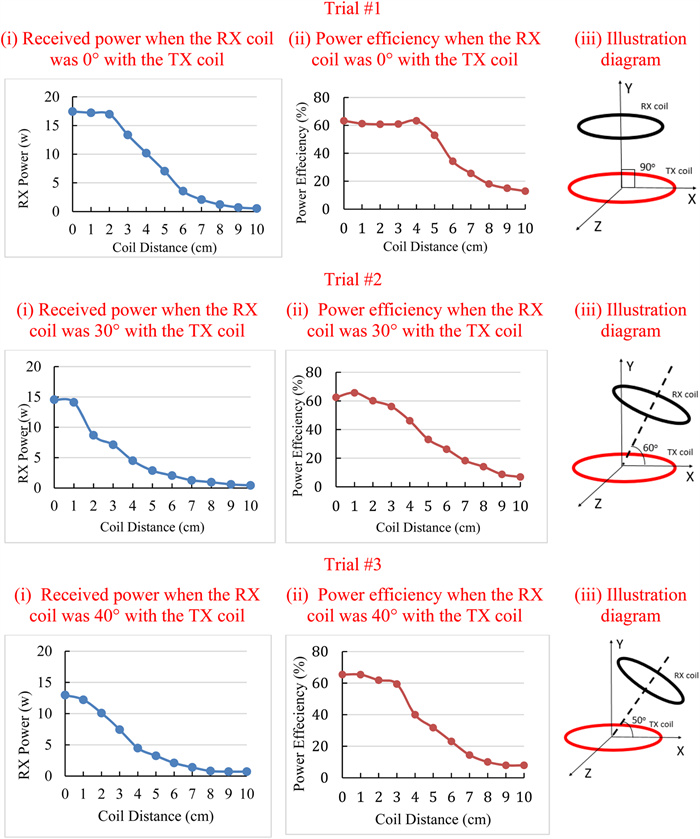
Figure 9.
Shows the trend of received power as well as power efficiency with respect to the coil distance in three different trials, trail #1 is conducted when the RX coil is in parallel with the TX coil. (ⅰ) Shows the relationship between the received power and the coil distance. The dotted line is the minimum desired RX power. The received power is above the minimum requirement of 2.5 W when the coil distance is less or equal to 6 cm. (ⅱ) Shows the relationship between power efficiency and coil distance, and (ⅲ) shows the orientation of the RX coil (black) with respect to the TX coil (red).
-
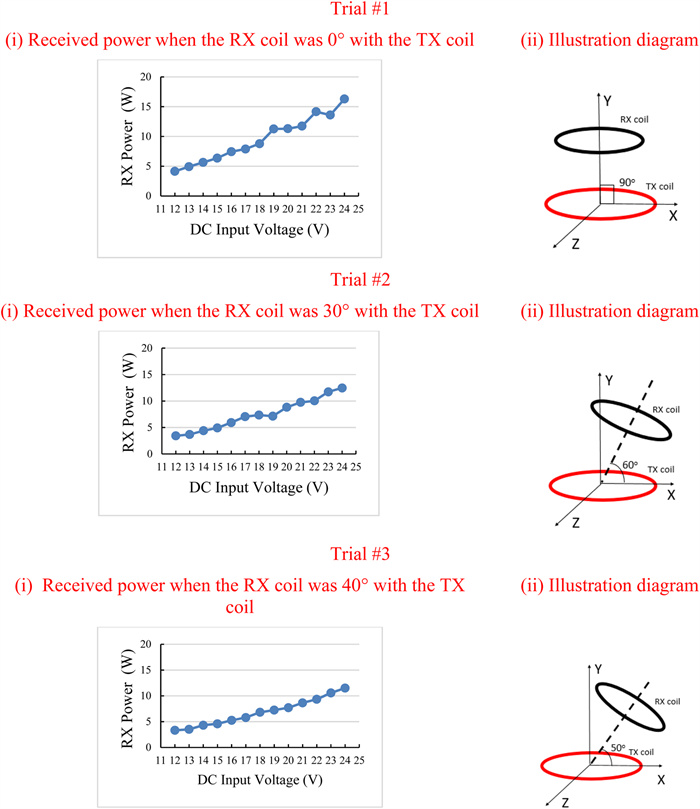
Figure 10.
Shows the trends of received power and efficiency with respect to the DC input voltage in the trials #1–3. Trail #1 is conducted when the RX coil is in parallel with the TX coil. (ⅰ) Shows the relationship between the received power and the coil distance. The received power was all above the minimum requirement of 2.5 W for the whole test. (ⅱ) Shows the orientation of the RX coil (black) with respect to the TX coil (red).
-
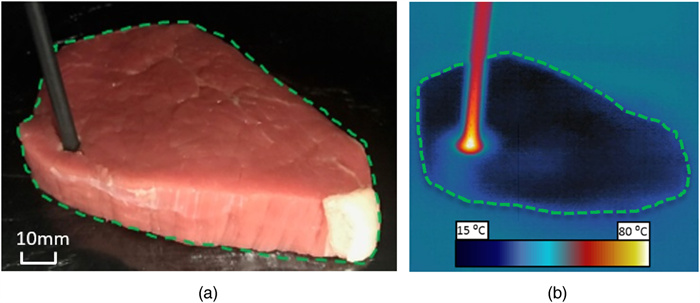
Figure 11.
Setup of the bovine liver experiment: (a) ex vivo bovine tissue during ablation and (b) thermal image during ablation.
-
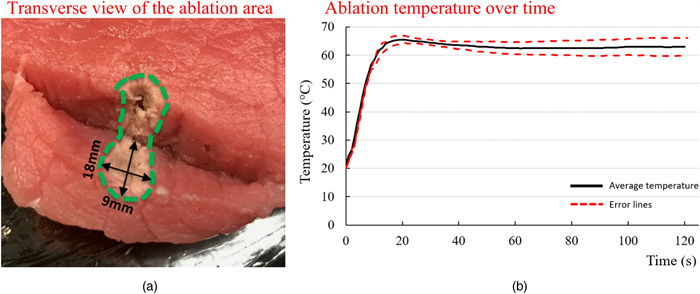
Figure 12.
Results of maximum power test: (a) cross-section of ablation zone (9 mm × 18 mm) and (b) ablation temperatures over time. The black line represents the average temperature. The dotted red lines represent the error lines calculated using standard deviation.
-
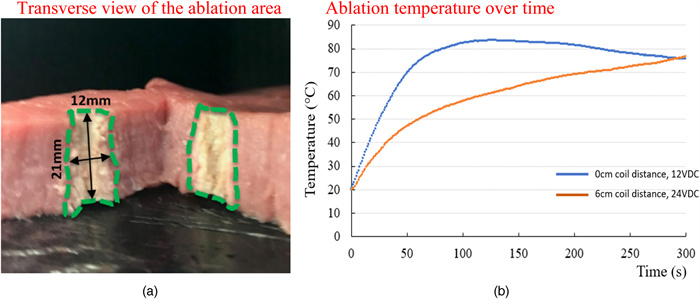
Figure 13.
Results from the minimum power test: (a) cross-section of ablation zone (12 mm × 21 mm) and (b) ablation temperatures over time. The blue line represents the average temperature when the coil distance is 0 cm, and voltage is 12 VDC, the light brown line represents the average temperature when the coil distance is 6 cm, and the voltage is 24 VDC.
-
Symbol Definition Unit B Magnetic field T E Electrical field V/m dl Length of element m μ0 Permeability of free space N/A Ienc Enclosed current A ɛ0 Electric permittivity of free space N/A I Current A R Radius of the wire mm $ $ Outward point unit-normal N/A ΦB Magnetic flux Wb ɛ Electromotive force V fresonant Resonant frequency Hz L Inductance H C Capacitance F SAinside stylet Surface area of the inner stylet m2 SAoutside sheath Surface area of the outer sheath m2 dcyl Diameter of the cylinder m hcyl Height of the cylinder m dcone Diameter of the cone m hcone Height of the cone m Table 1.
Symbols and definitions used in equations (1)–(6)
-
TX tank circuit RX tank circuit Variable Value Variable Value Inductance 25.74 μH Inductance 25.69 μH Capacitance 386.3 nF Capacitance 400.2 nF Coil diameter 10 cm Coil diameter 5 cm Coil turns 12 Coil turns 14 Table 2.
TX and RX tank circuit characteristics
Figures
(13)
Tables
(2)