-
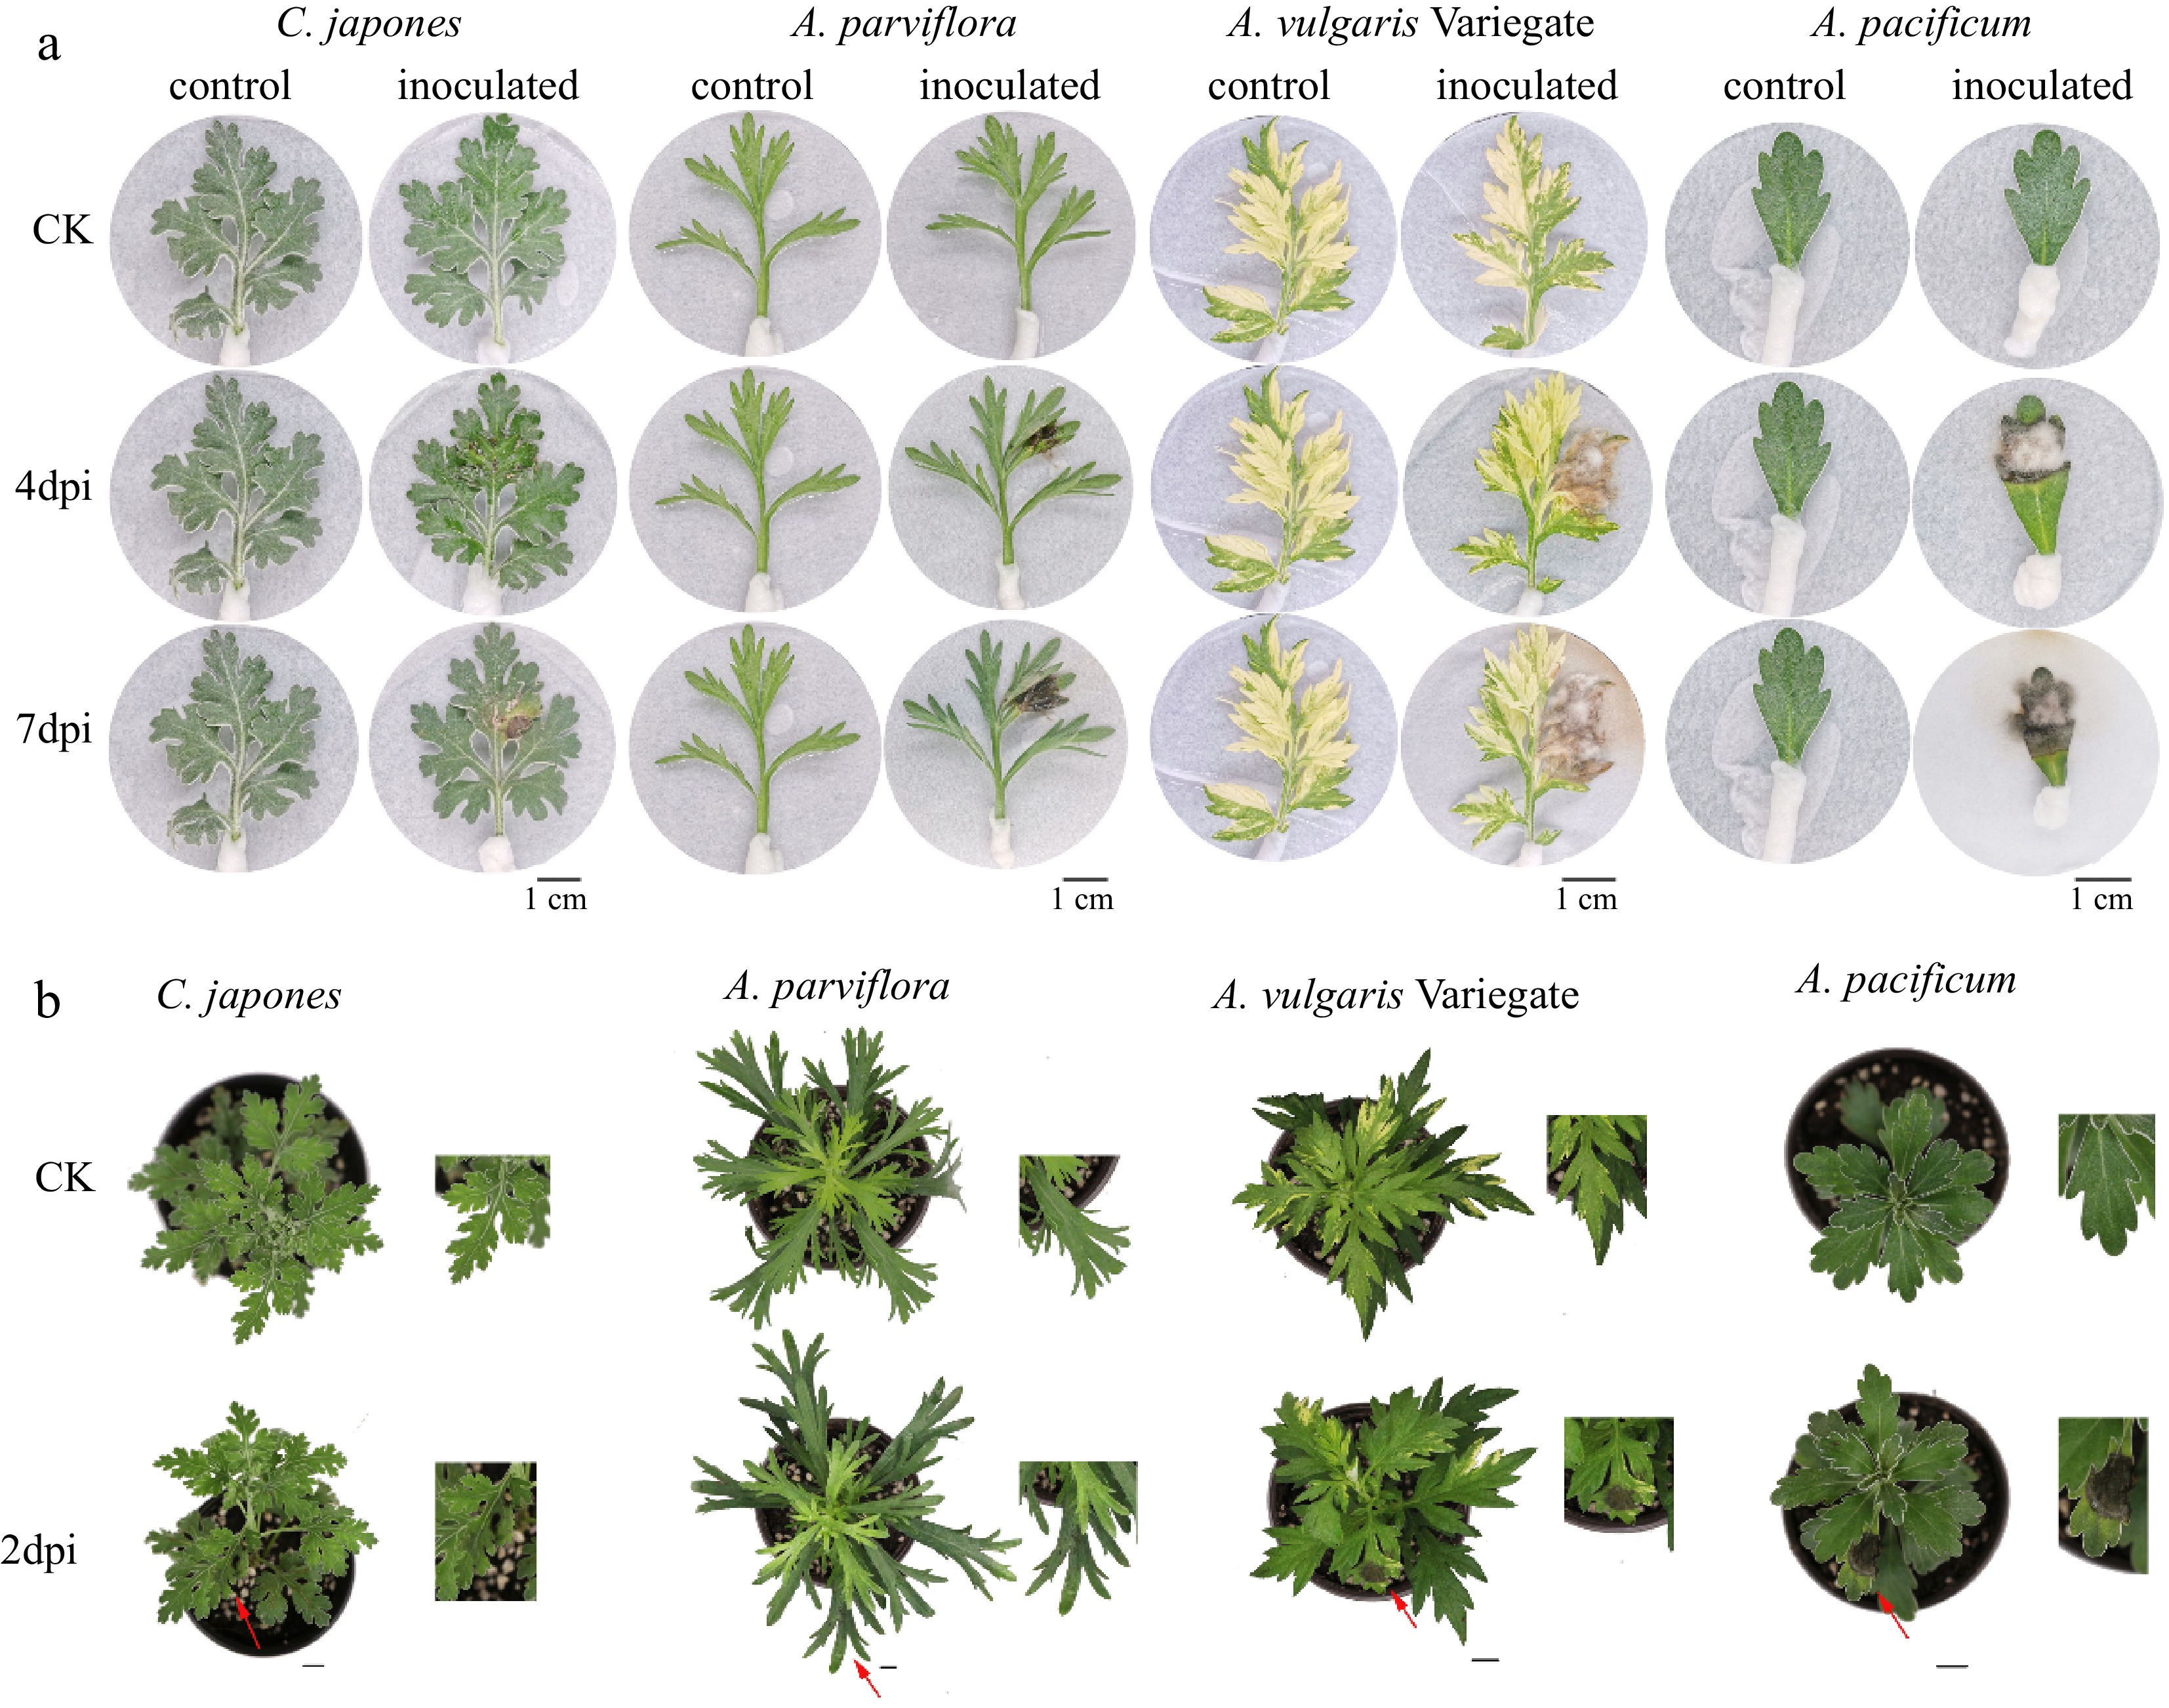
Figure 1.
Differences in disease phenotype of different plants after inoculation. From left to right: the disease degree of leaves deepens. n = 15. (a) Disease symptoms on 4 and 7 d after inoculation of isolated leaves. (b) Disease symptoms of whole plants at post 2 d inoculation. Scale bar = 1 cm.
-
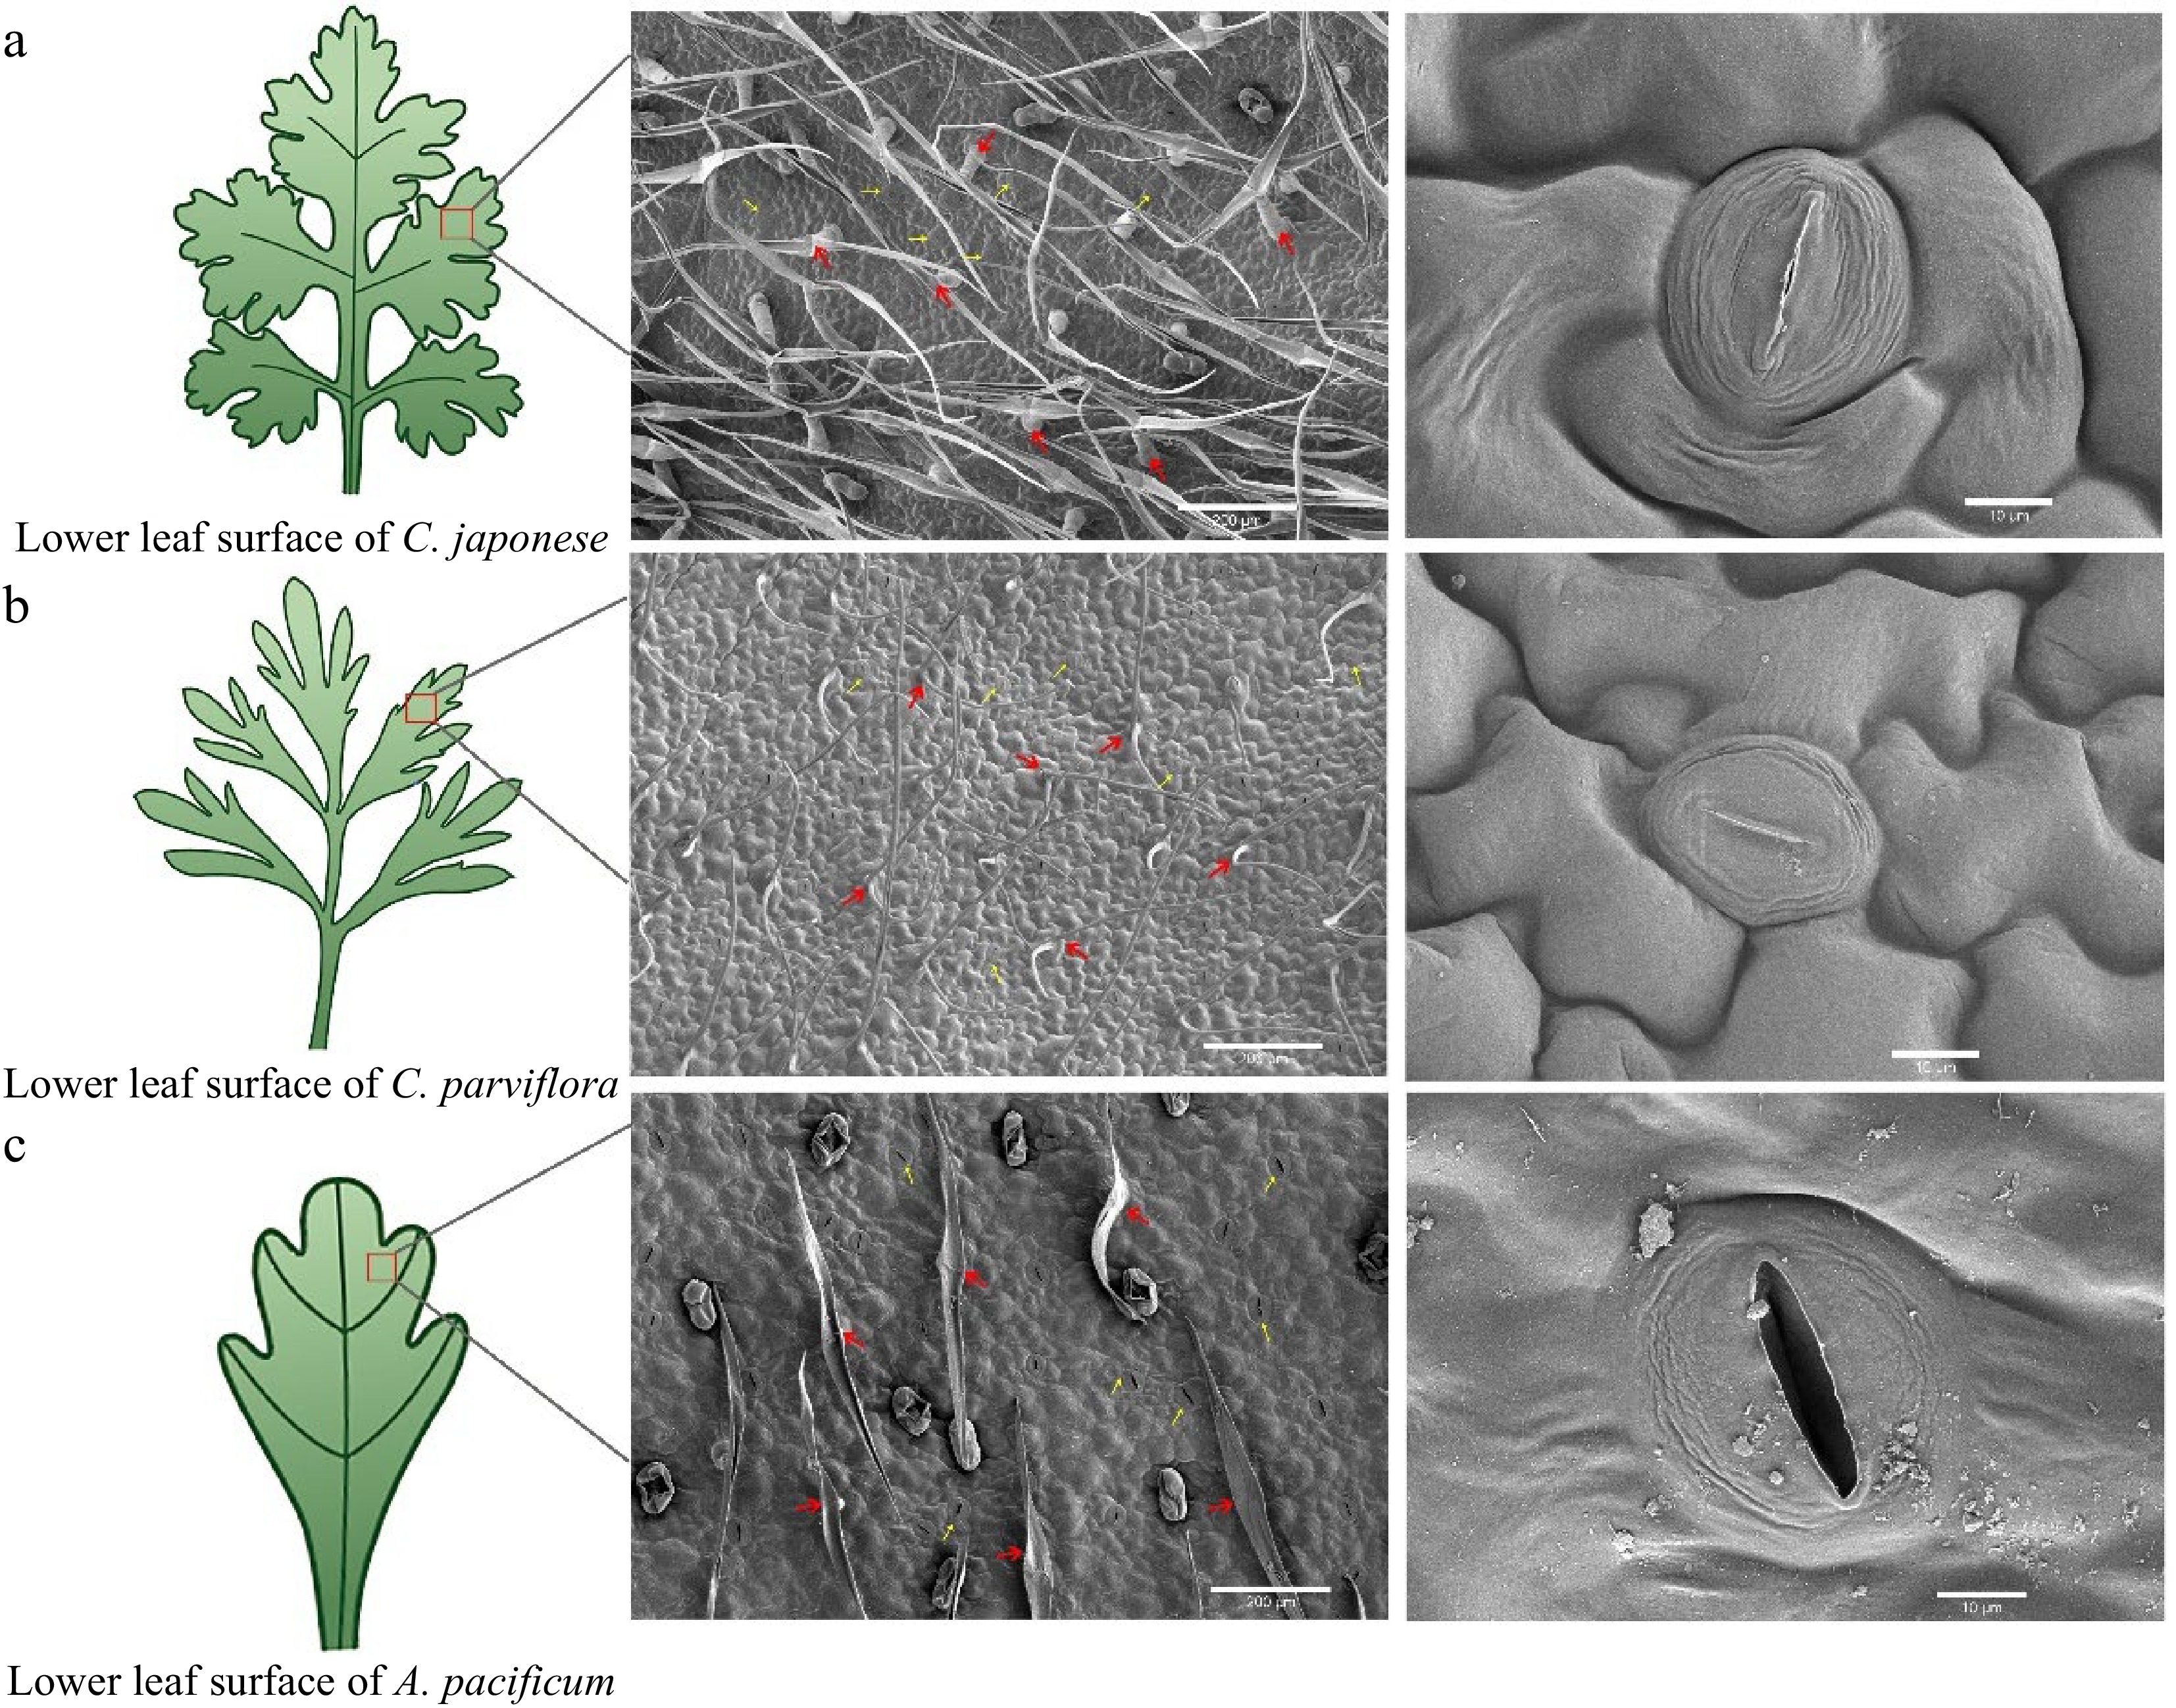
Figure 2.
Scanning electron microscopy (SEM) images of the lower epidermis of leaves from disease-resistant and susceptible materials. From left to right, the parts that were observed under the scanning electron microscope (red box part) showed the distribution and shape of trichome and stomata respectively. The red arrows indicate epidermal hairs, and the yellow arrows point to the stomata.
-
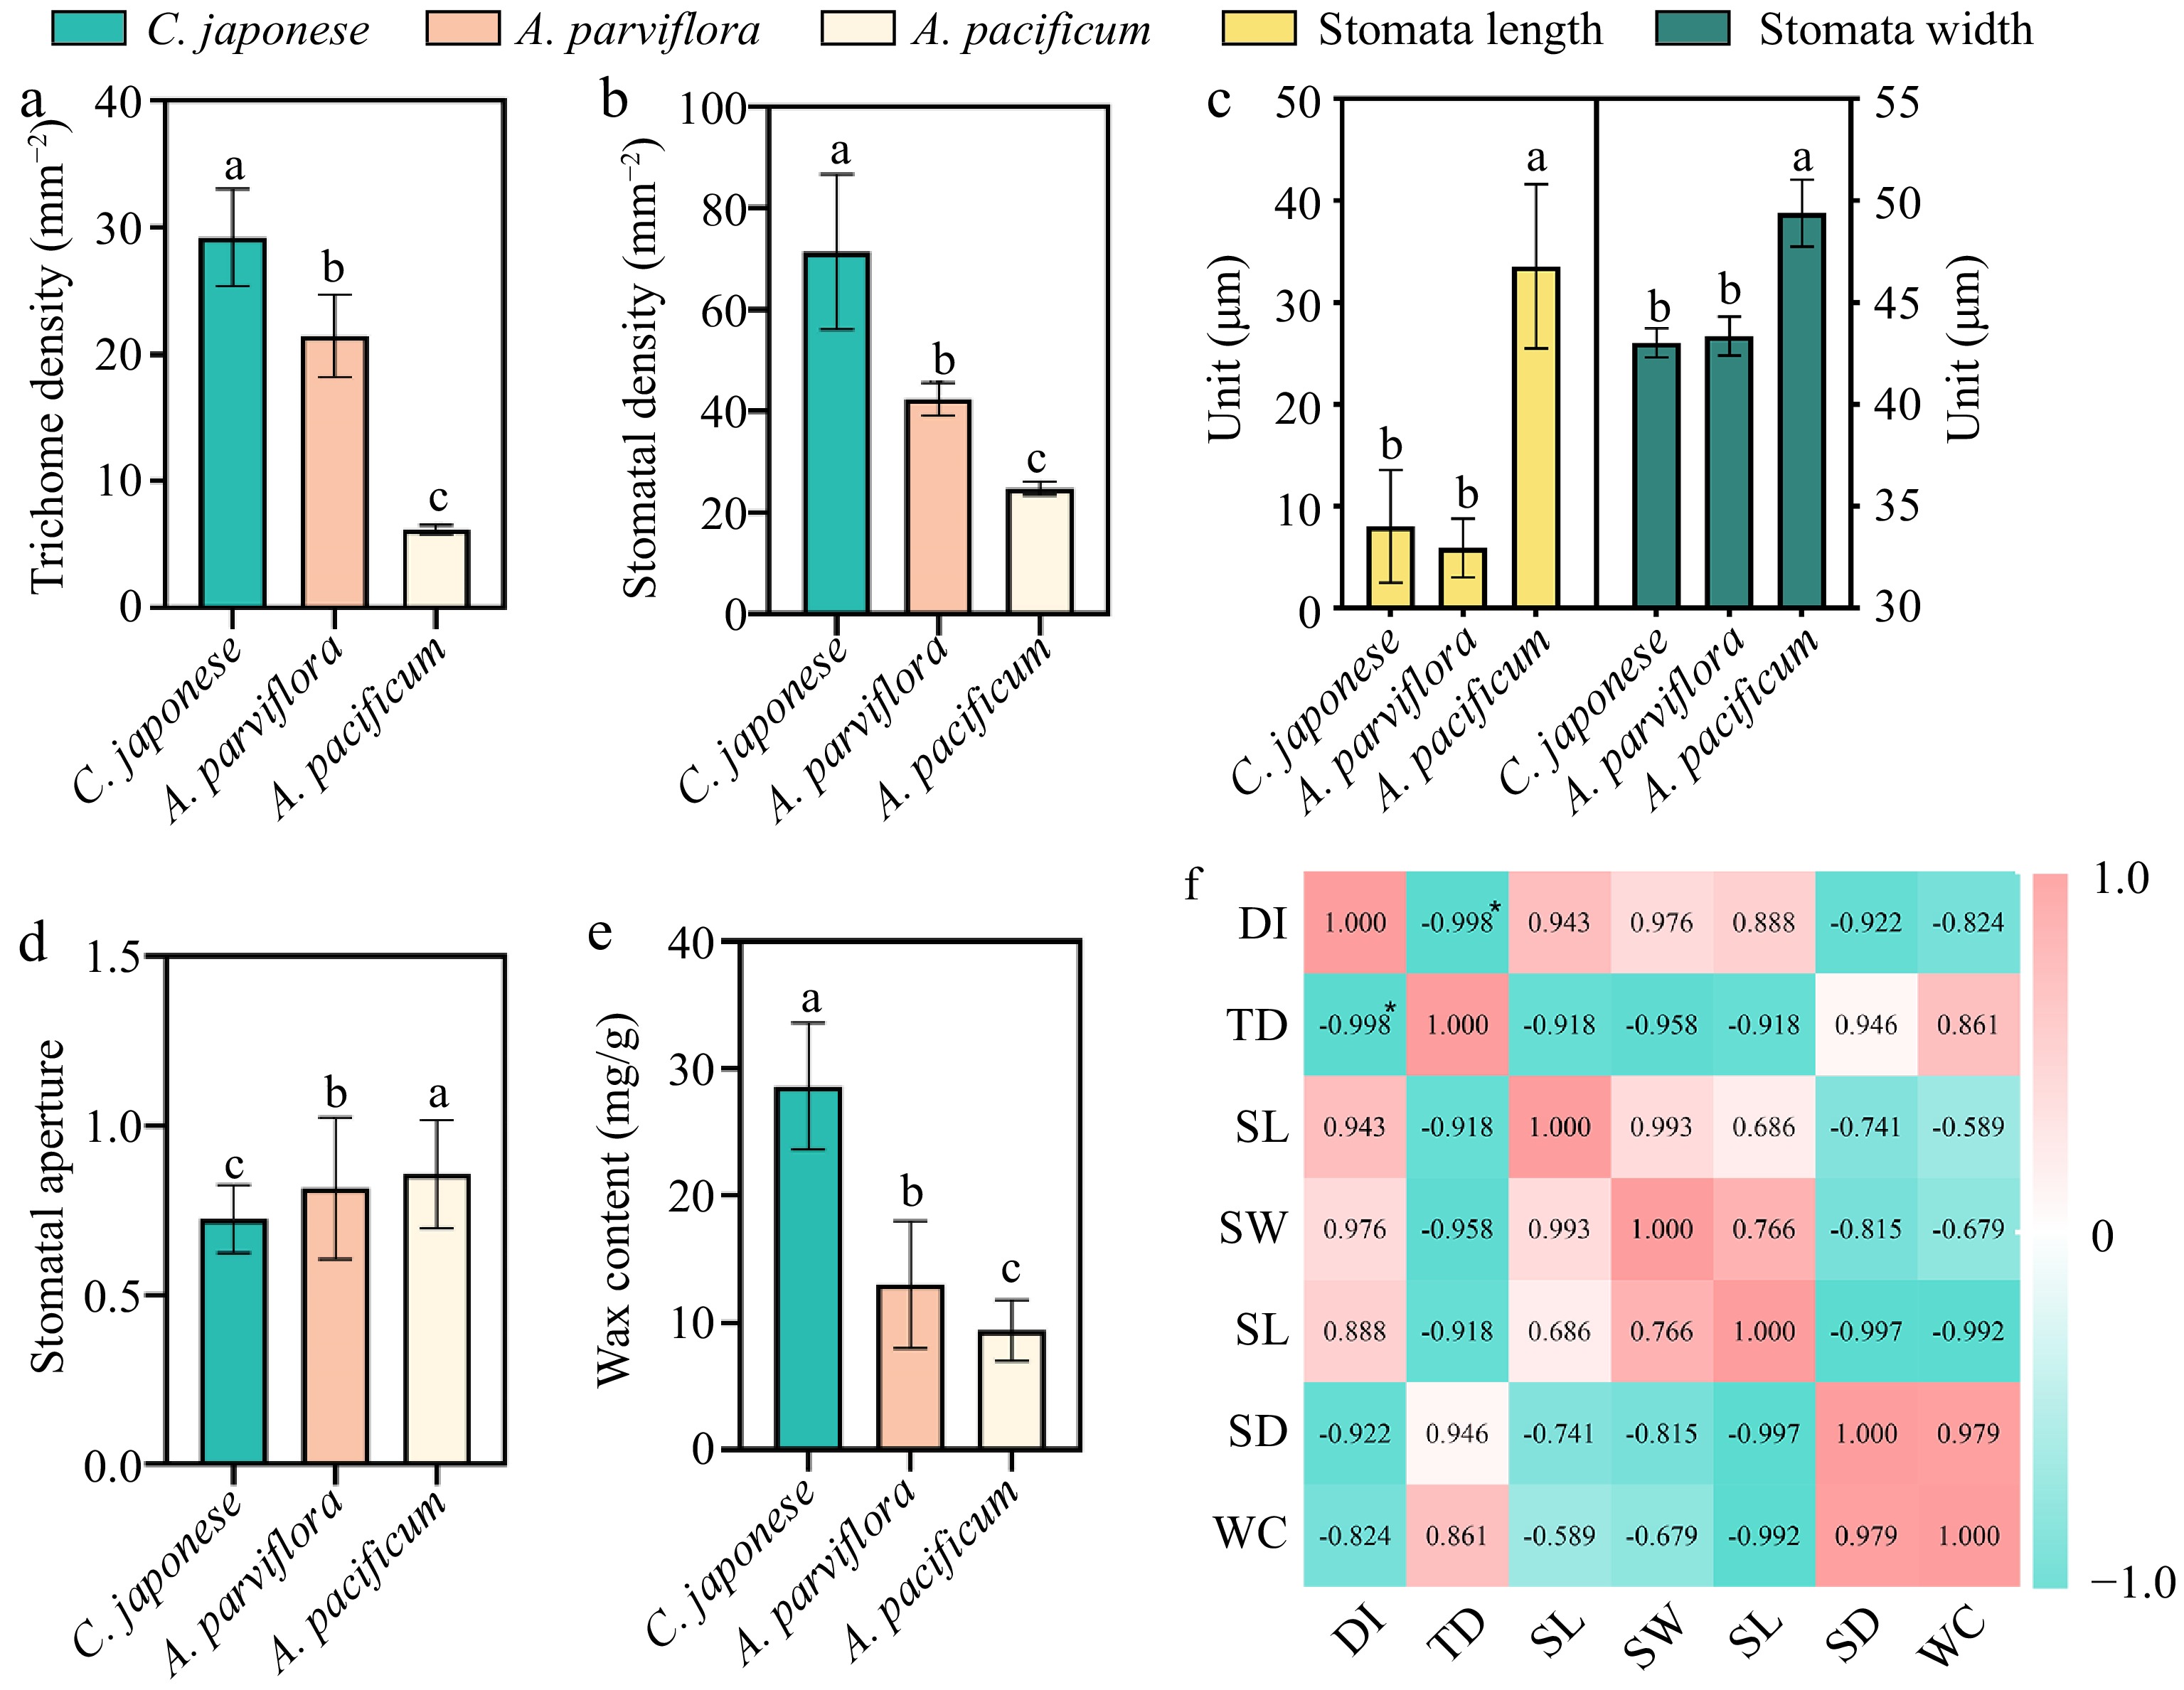
Figure 3.
Correlation analysis of leaf wax content and lower epidermal structure with disease index. (a) Trichome densities of leaf abaxial surfaces, n = 30. (b) Stomata length and width of leaf abaxial surfaces, n = 30. (c) Stomata aperture, n = 30. (d) Stomata densities of leaf abaxial surfaces, n = 30. (e) Wax content of leaves, n = 20. (f) Visualization of the correlation analysis, Pearson correlation coefficient. All bar charts show mean ± SD. Red and green represent positive and negative correlations, respectively, and color intensity reflects the magnitude of the correlation. DI refers to disease index; TD refers to trichome density; SL refers to stomata length; SW refers to stomata width; SA refers to stomata aperture; SD refers to stomata density; WC refers to wax content.
-
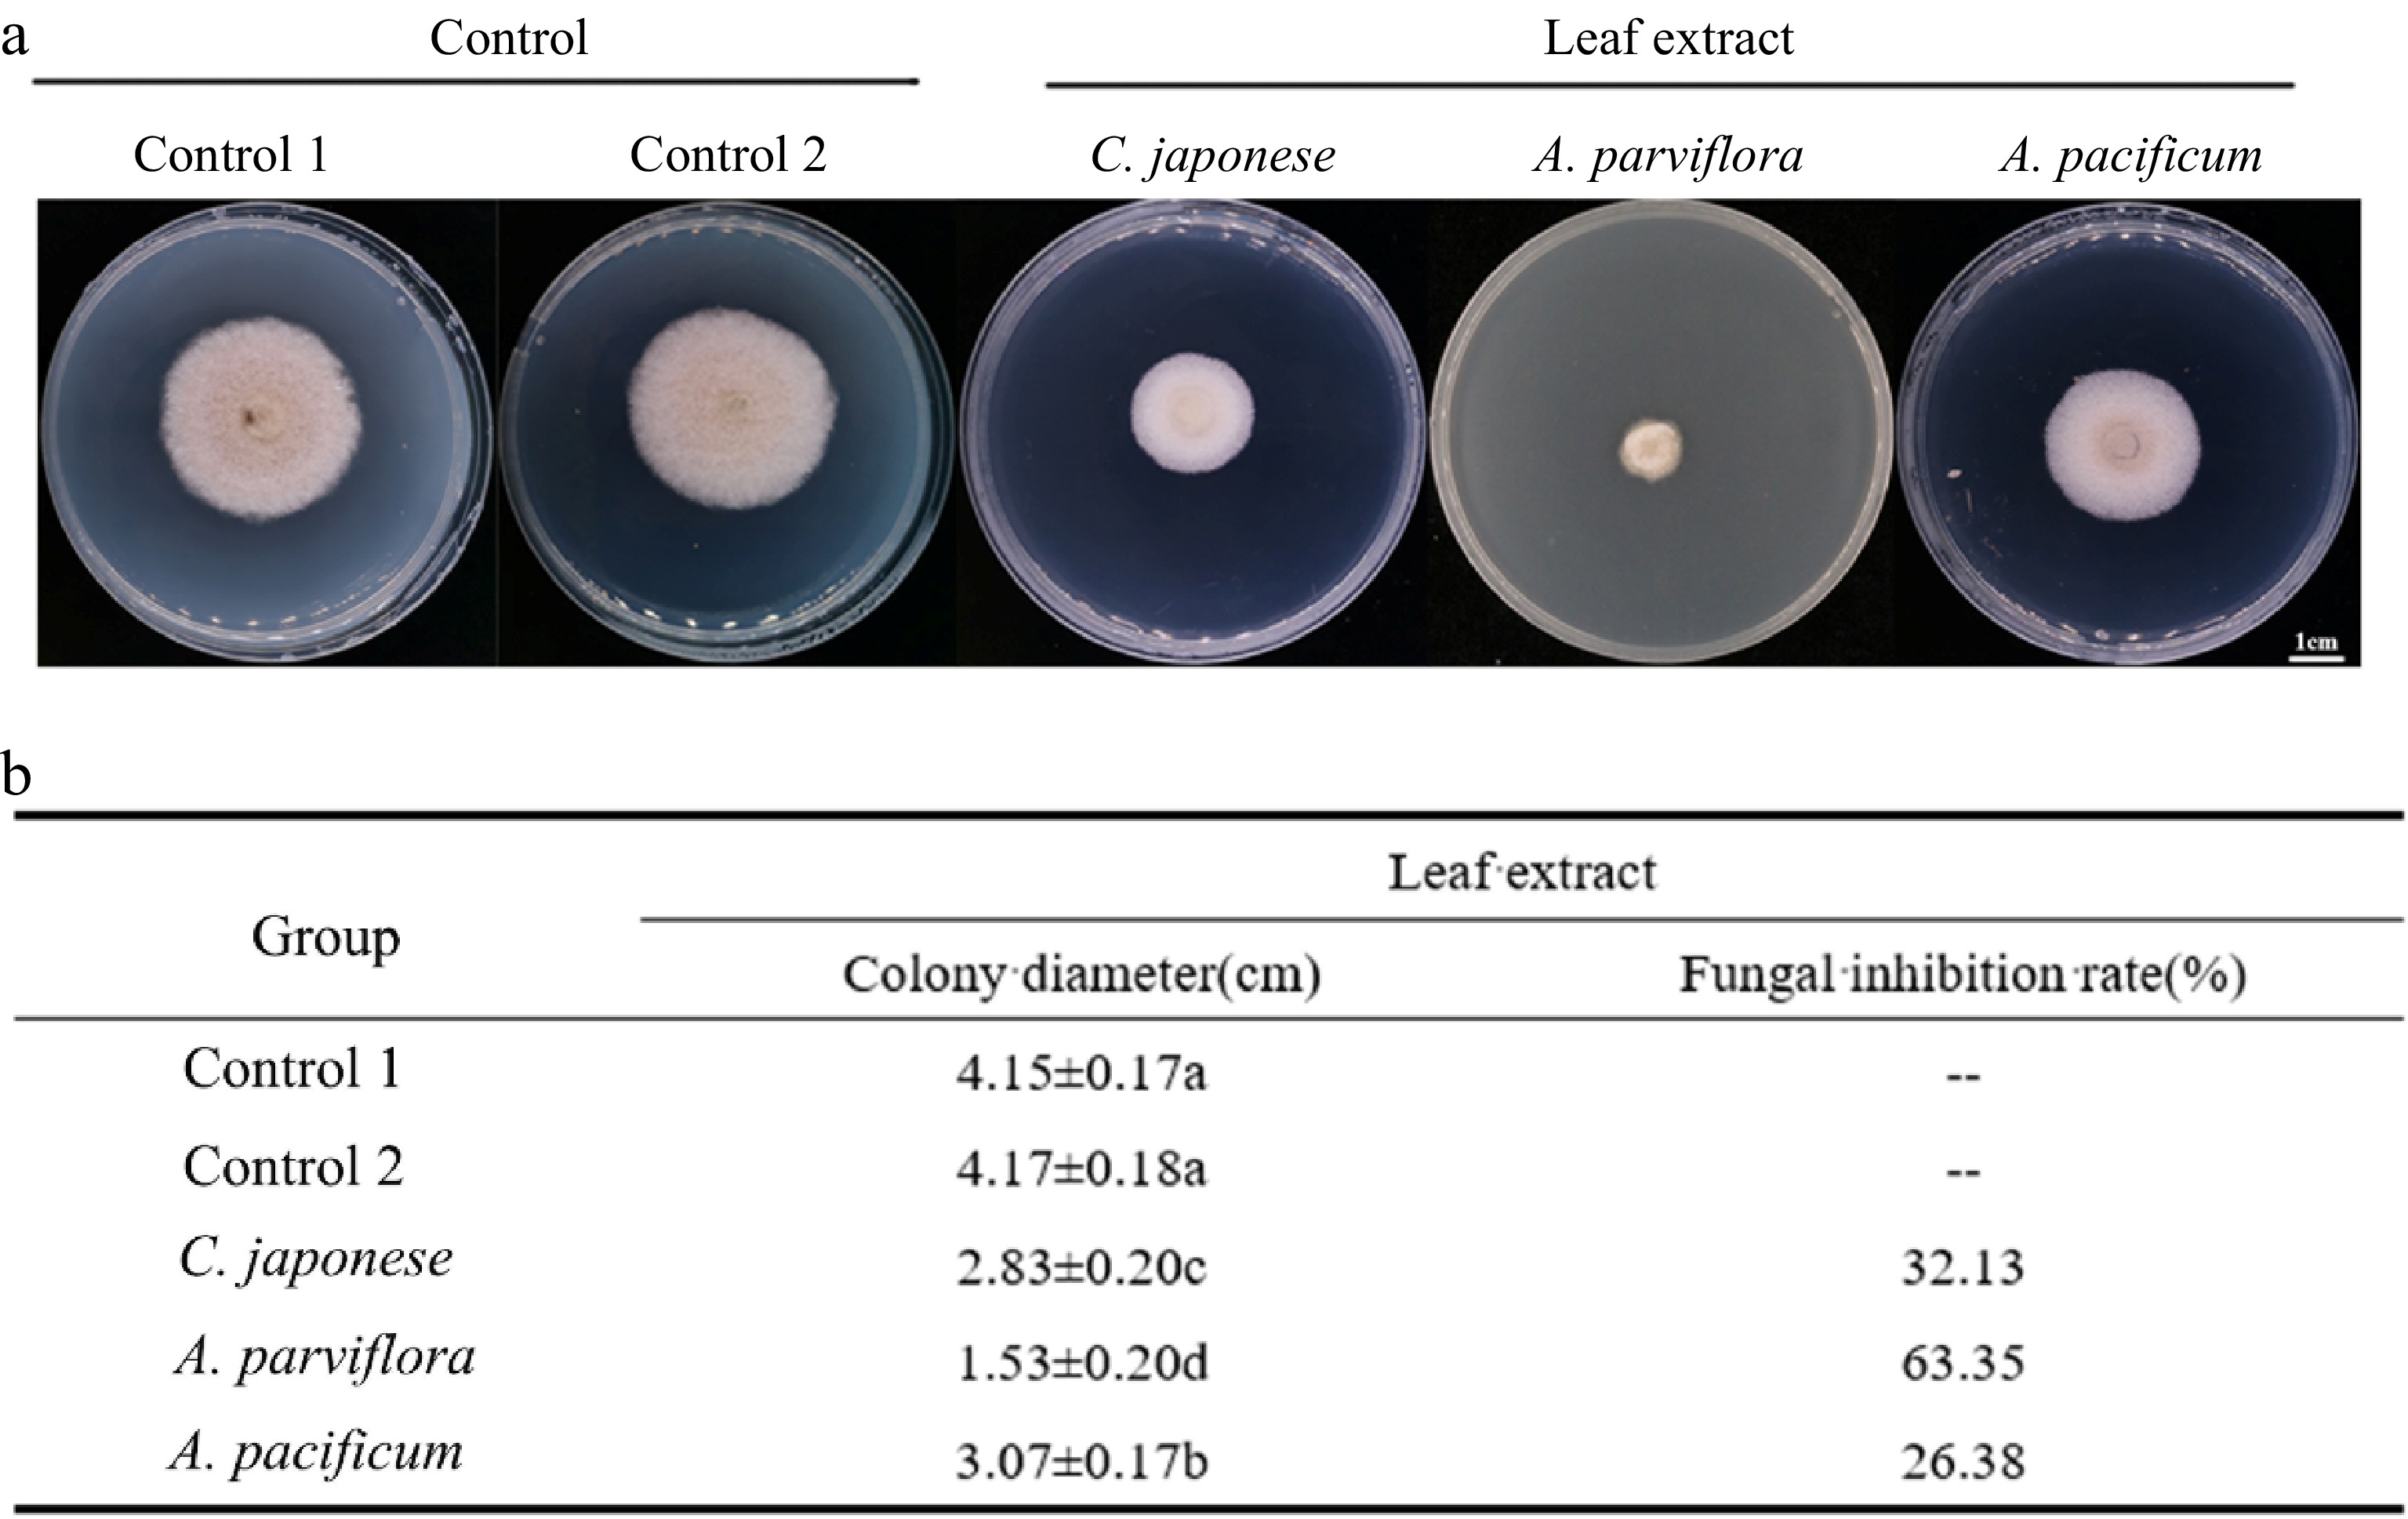
Figure 4.
Antifungal activity of leaf extracts against A. alternate. (a) The morphology of the colony on the PDA medium after the leaves extracts were co-cultured with the A. alternate for 4 d. (b) Antifungal rate statistics.
-
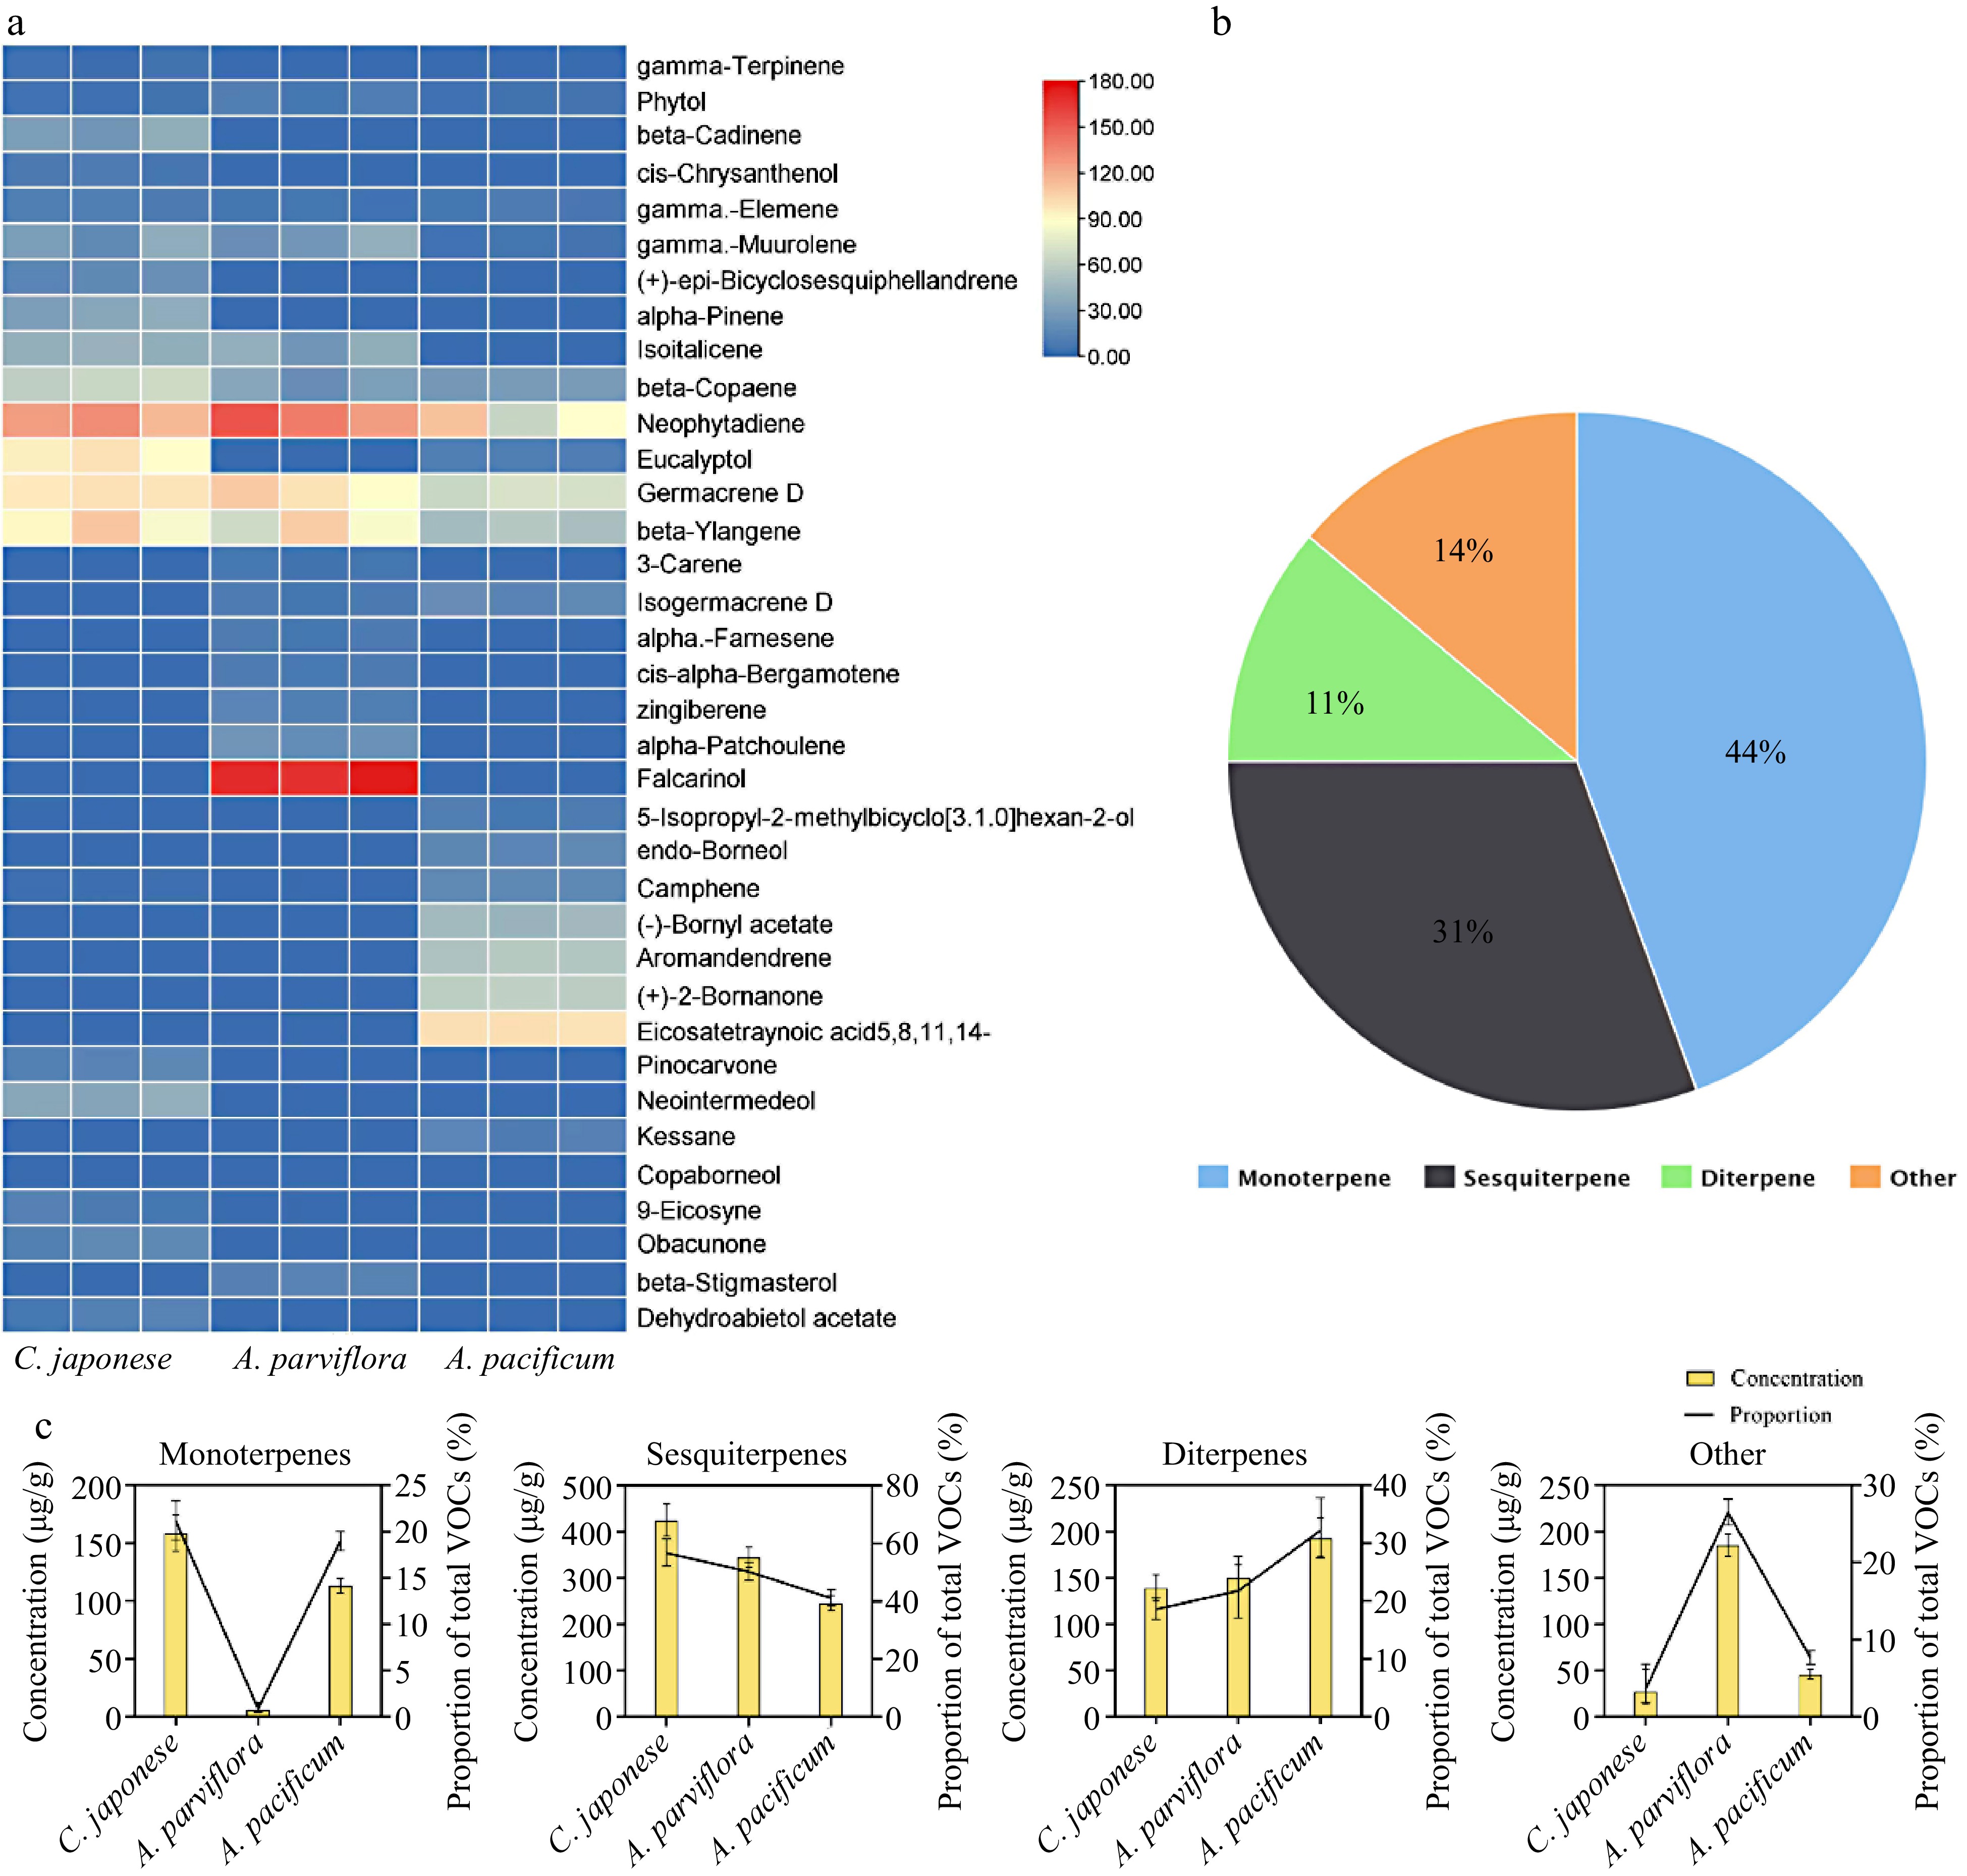
Figure 5.
VOCs components identification of leaf extracts. (a) Heat map with major VOCs (above 1% of total VOCs present in chromatograms) emitted by three species of CRG. Colors reflect the VOC’s relative content, n = 3. (b) Venn diagram of the proportion of different classes of terpenes. (c) Statistics of different types of VOCs content in the leaves and the proportion of total VOCs content in the leaves.
-
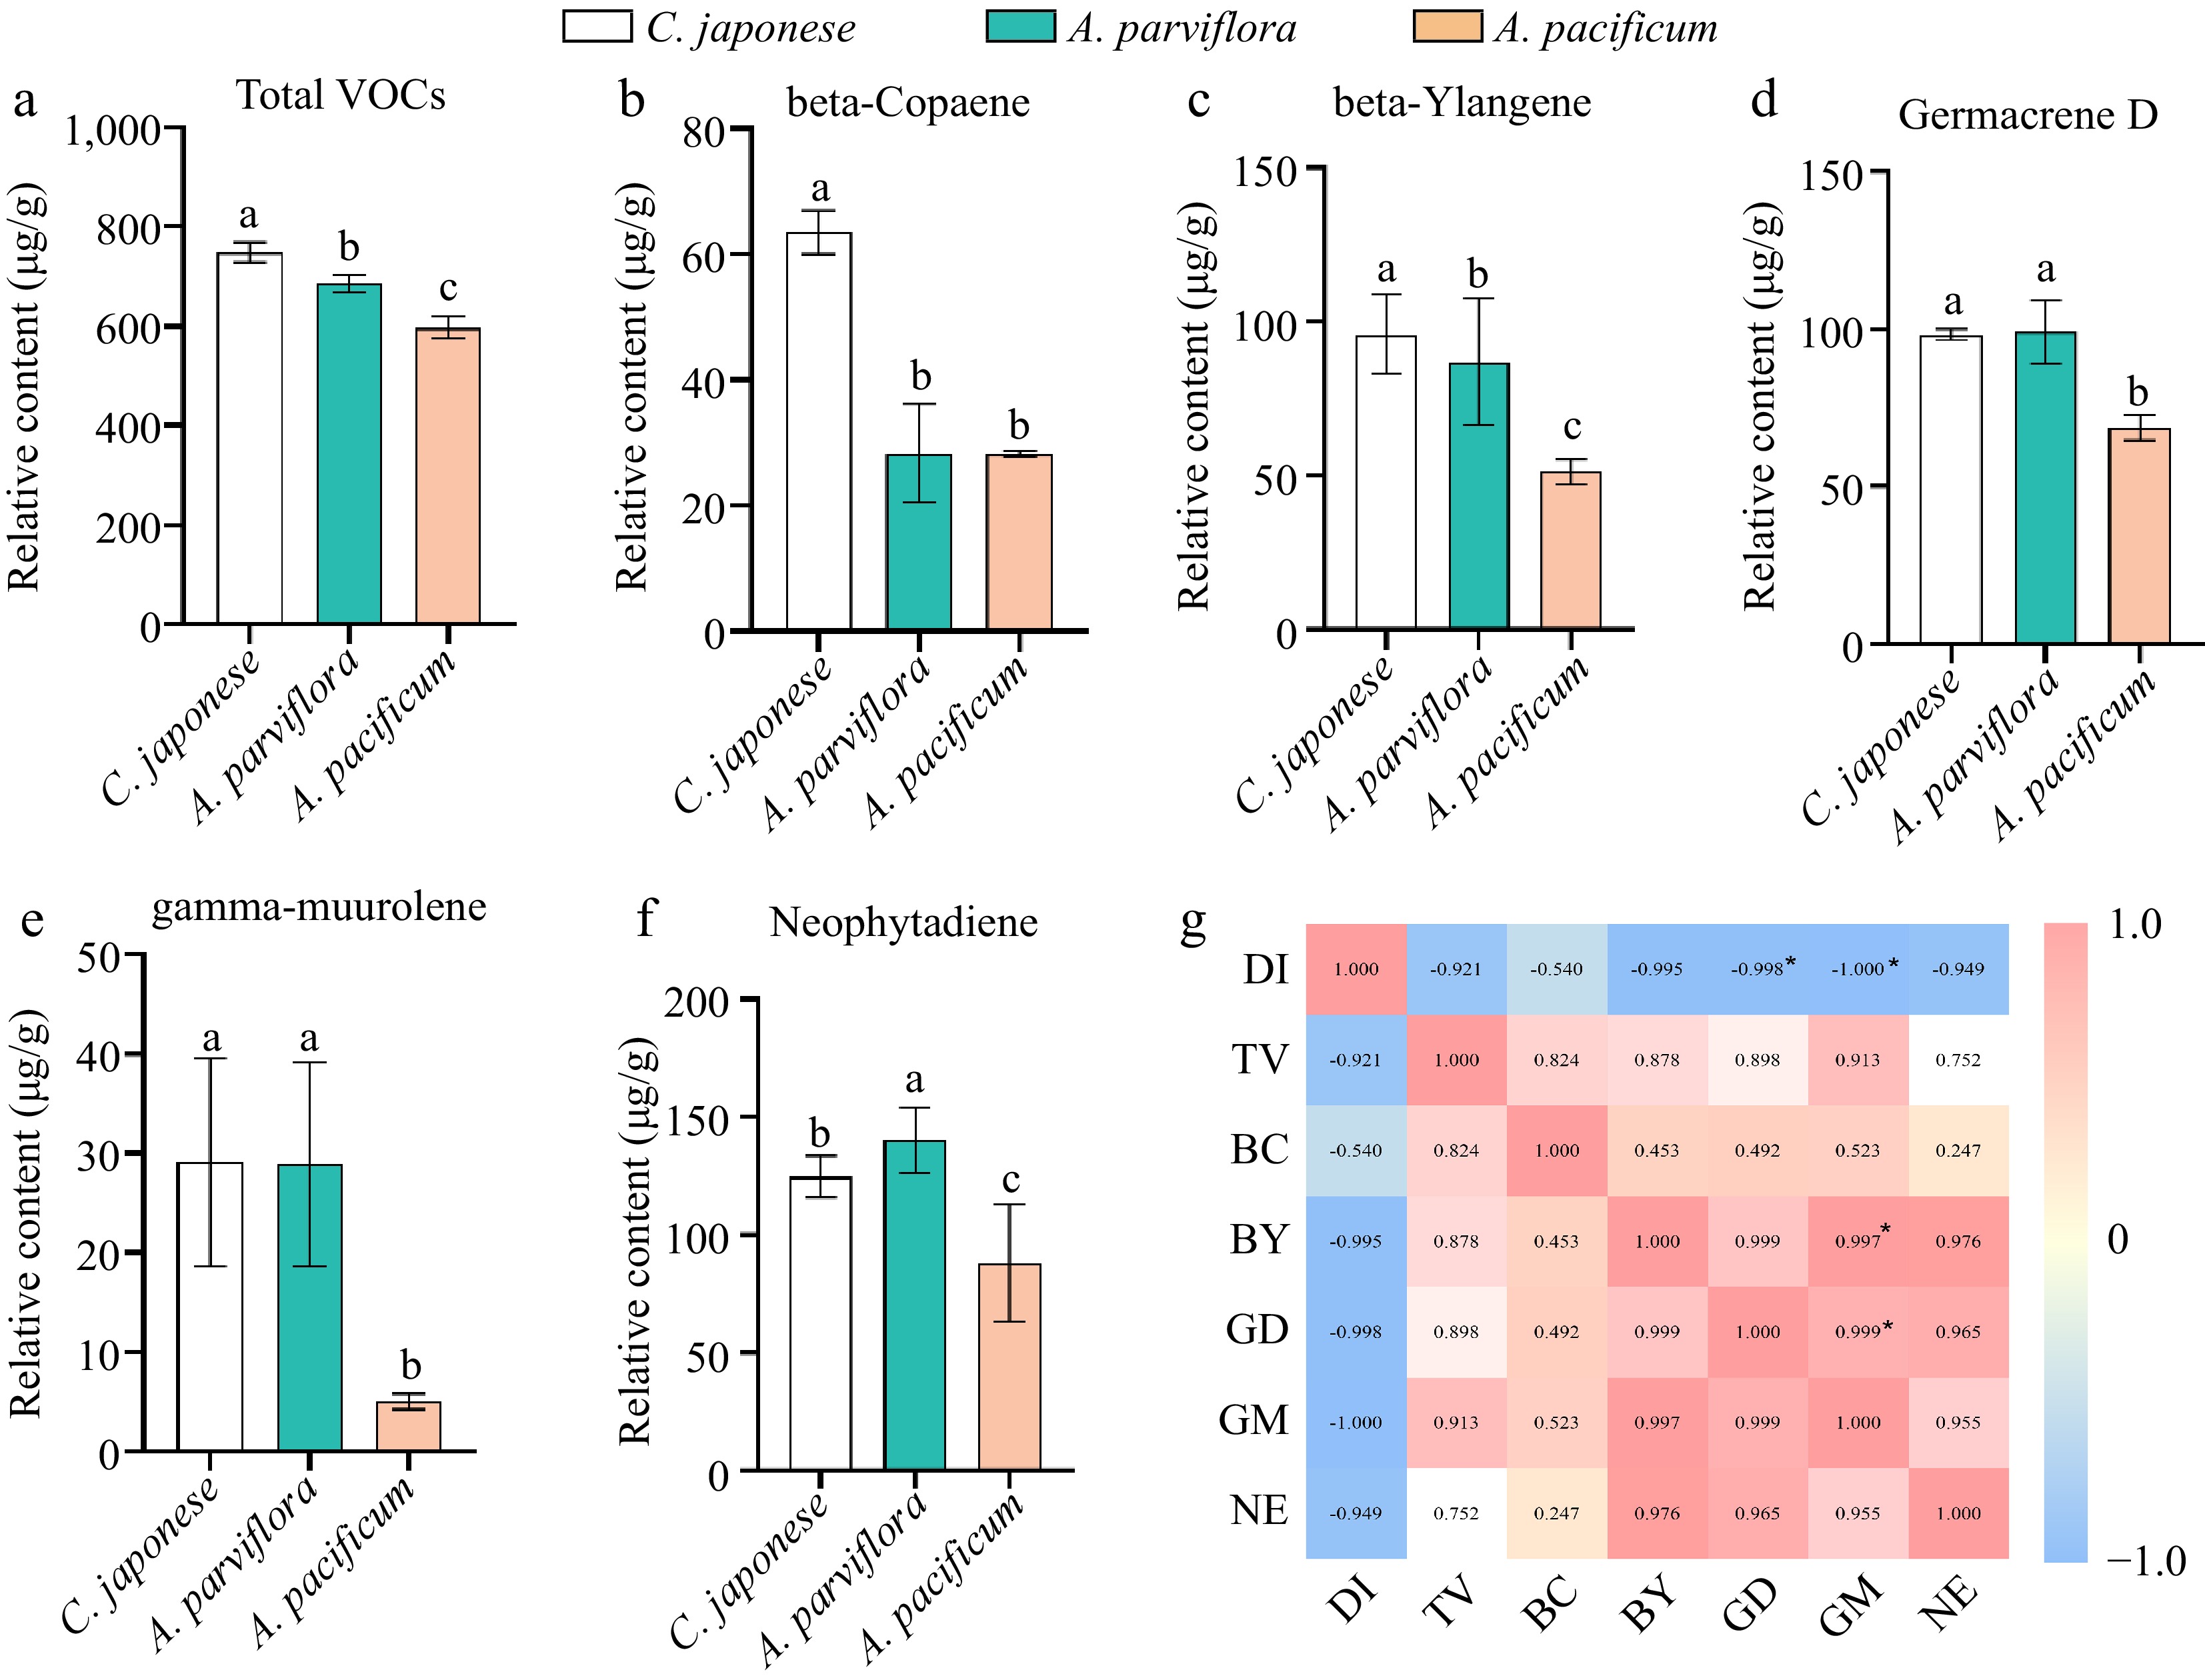
Figure 6.
The contents of volatiles in leaves of different germplasm were significantly different and correlated with plant disease index. (a) Comparison of total volatiles content in leaves. (b)−(f) Comparison of the contents of main volatiles in leaves of different species. (g) Visualization of the correlation analysis, Pearson correlation coefficient. Red and blue represent positive and negative correlations, respectively, and color intensity reflects the magnitude of the correlation. DI refers to disease index, TV refers to total VOCs, BC refers to beta-Copaene, BY refers to beta-Ylangene, GD refers to Germacrene D, GM refers to gamma-muurolene, NE refers to neophytadiene.
-
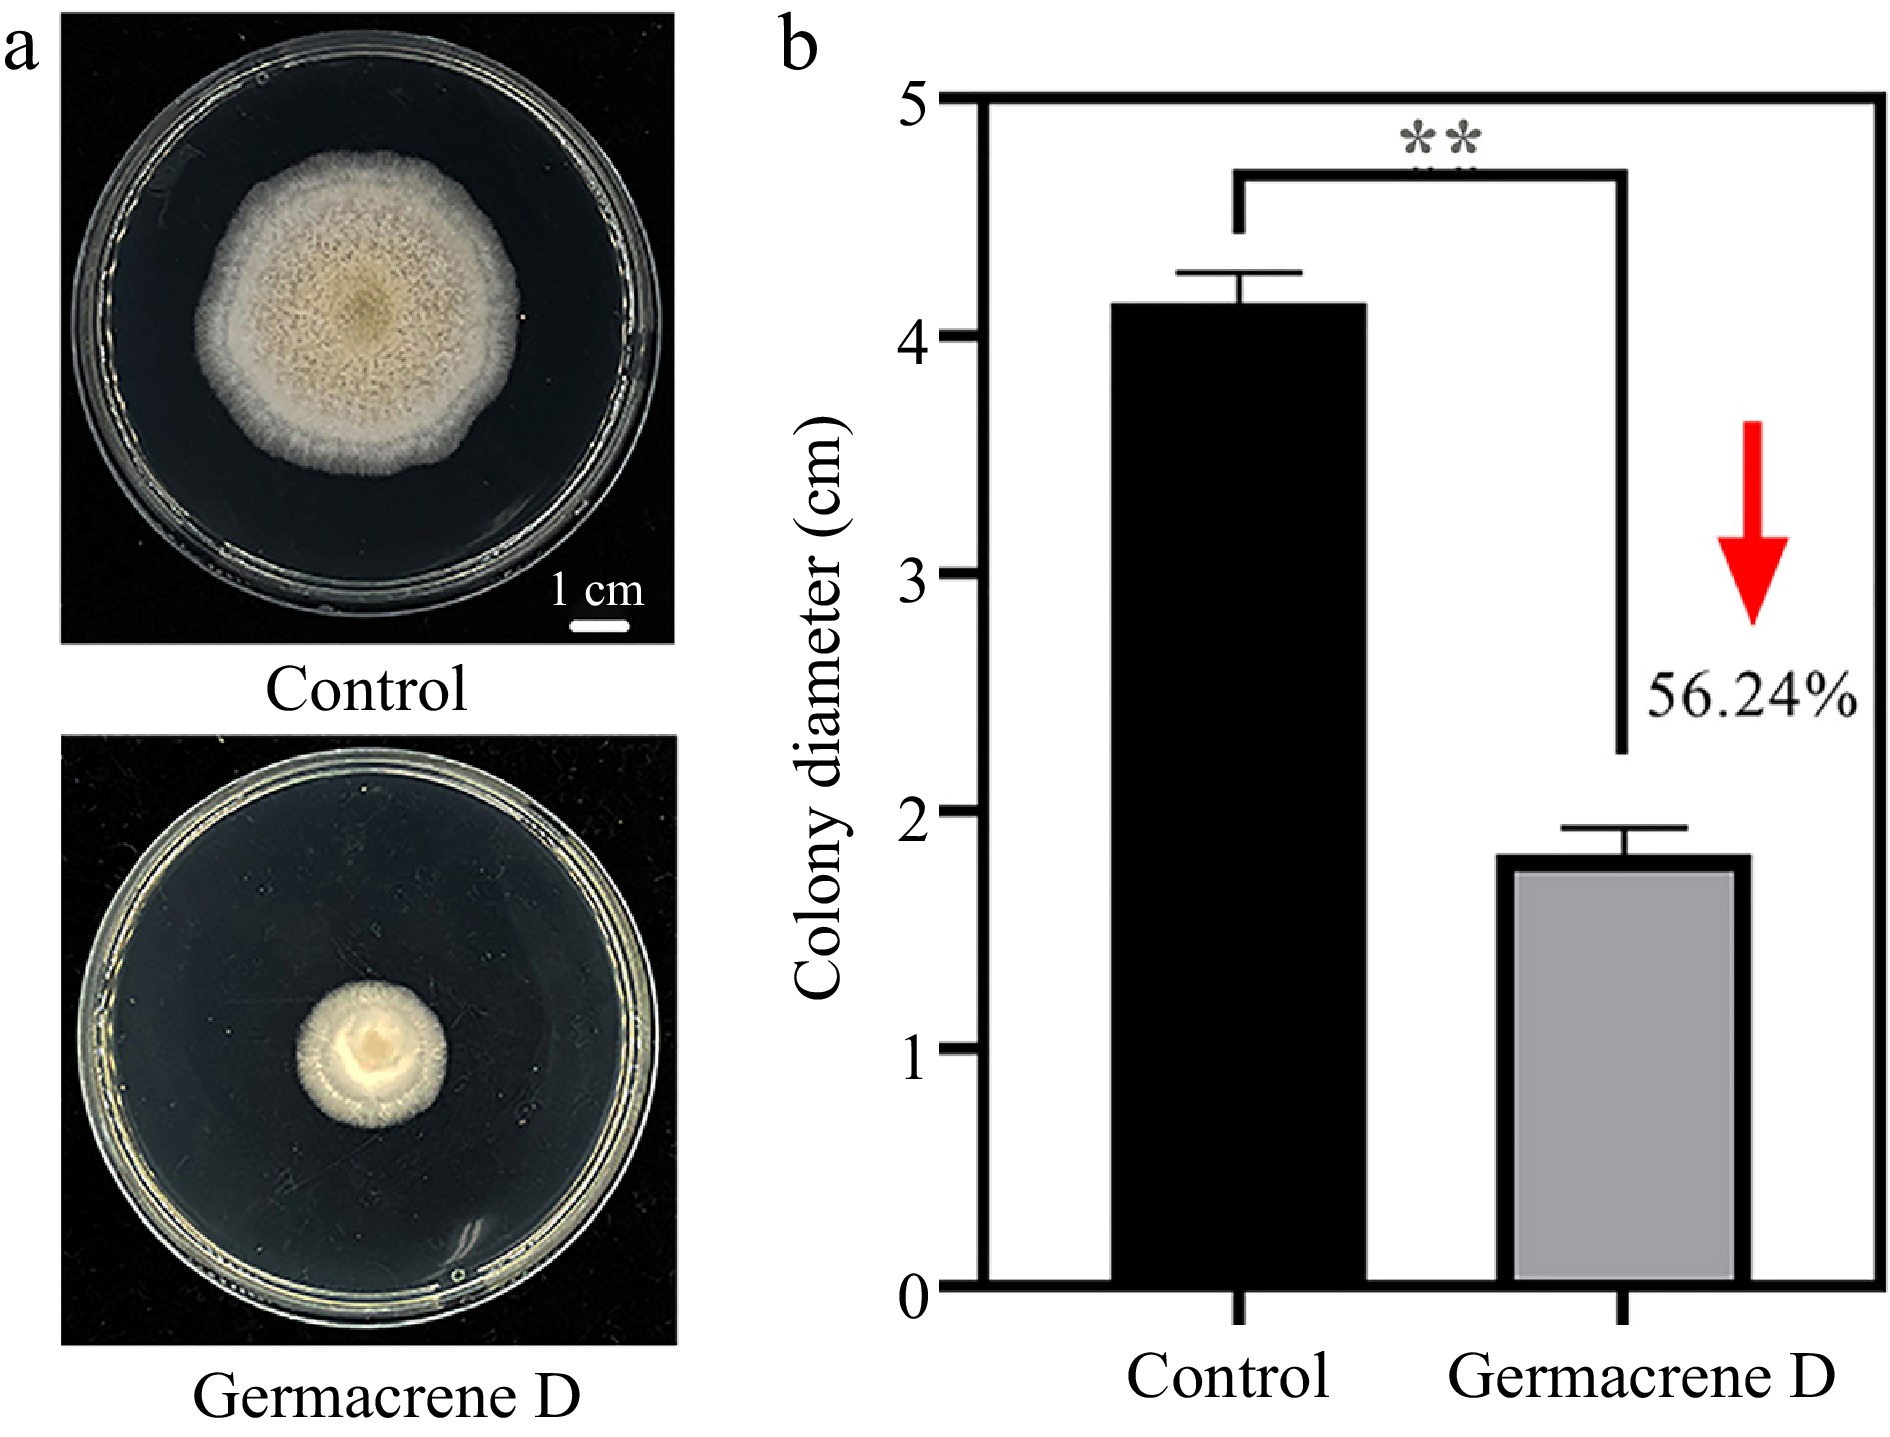
Figure 7.
Inhibition of hyphae growth of A. alternate by Germacrene D reagent. (a) The morphology of the colony on the PDA medium after 7 d. (b)Statistical difference of colony growth diameter between control and treatment.
-
Name Incidence rate (%) Percentage of spot area (%) Disease index (DSI) Resistance type C. japonese 73 5.9 24 R C. ornatum 100 6.7 33 MR A. vulgaris 100 6.2 33 MR A. leucophylla 100 7.5 33 MR A. parviflora 100 16.2 33 MR A. rubripes 100 15.1 33 MR A. annua 100 16.0 33 MR A. sieversiana 100 18.4 33 MR A. indices 100 24.1 33 MR A. viridisquama 100 19.3 33 MR A. yunnanensis 100 26.6 33 MR A. japonica 100 22.3 36 MR A. vulgaris Variegate 100 30.7 55 S A. pacificum 100 52.8 57 S Table 1.
Evaluation of disease resistance after inoculation of isolated leaves of CRG.
-
Name EXP 1 EXP 2 Average percentage
of spot area (%)Average DSI Resistance type Incidence rate (%) DSI Incidence rate (%) DSI C. japonese 83 28 92 30 6.6 29 R A. parviflora 100 32 83 28 5.7 30 R A. japonica 92 31 100 33 4.2 32 MR A. vulgaris 100 33 100 33 6.9 33 MR A. leucophylla 100 33 100 33 15.4 33 MR A. rubripes 100 33 100 33 10.4 33 MR A. yunnanensis 100 33 100 33 12.1 33 MR A. indices 100 33 100 33 19.2 33 MR A. viridisquama 100 33 100 33 20.1 33 MR A. sieversiana 100 33 100 33 18.0 33 MR A. annua 100 36 100 36 18.8 36 MR C. ornatum 100 40 100 38 16.1 39 MR A. vulgaris Variegate 100 42 100 44 20.5 43 MR A. pacificum 100 62 100 57 42.7 60 S Table 2.
Evaluation of disease resistance after inoculation of whole plants of CRG.
Figures
(7)
Tables
(2)