-
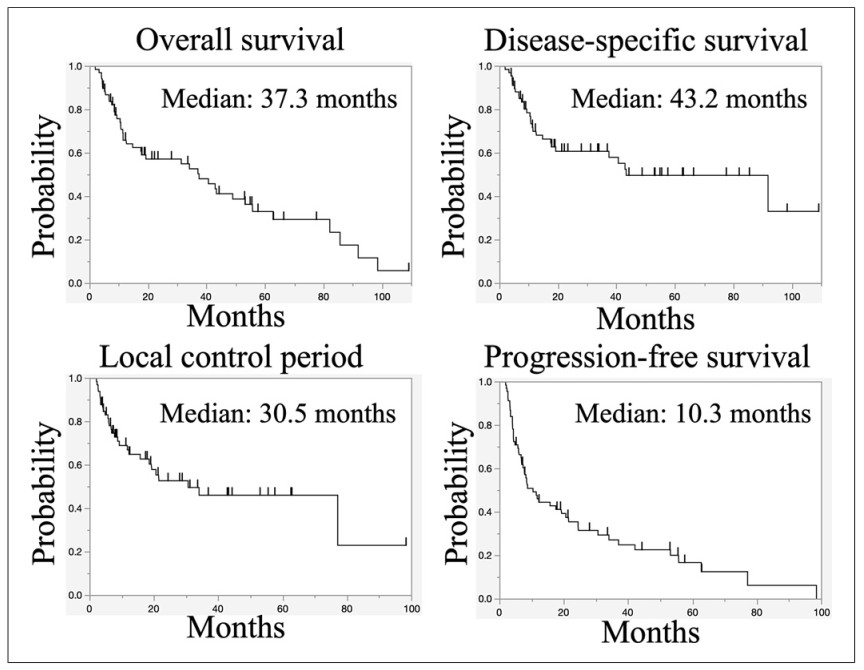
Figure 1.
Kaplan-Meier curves for OS, DSS, LC period, and PFS for all patients.
-
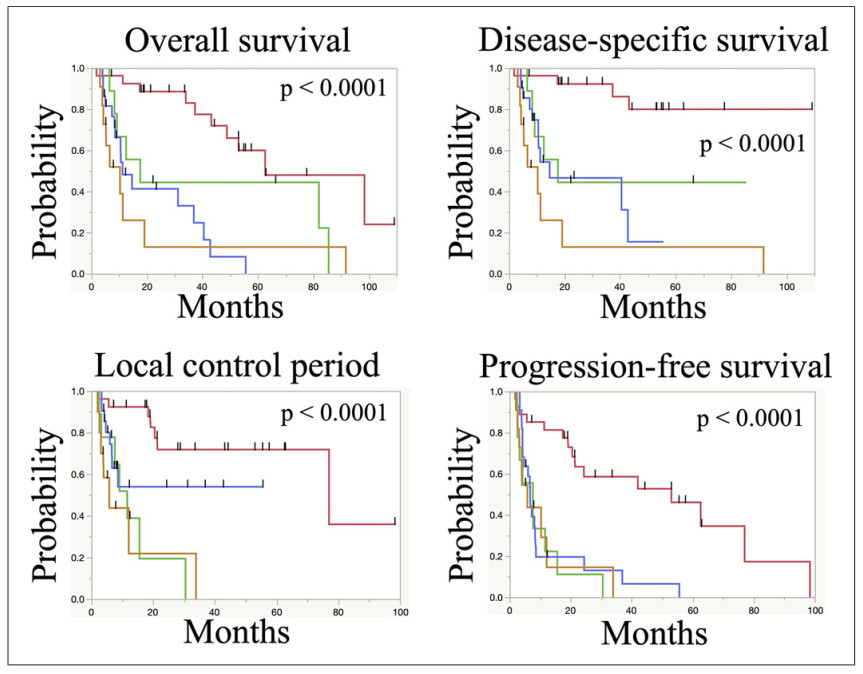
Figure 2.
Results of log-rank tests for Kaplan-Meier curves for OS, DSS, LC period, and PFS according to clinical stage. Stage Ⅰ: red line, stage Ⅱ: green line, stage Ⅲ: blue line, stage Ⅳ: brown line.
-
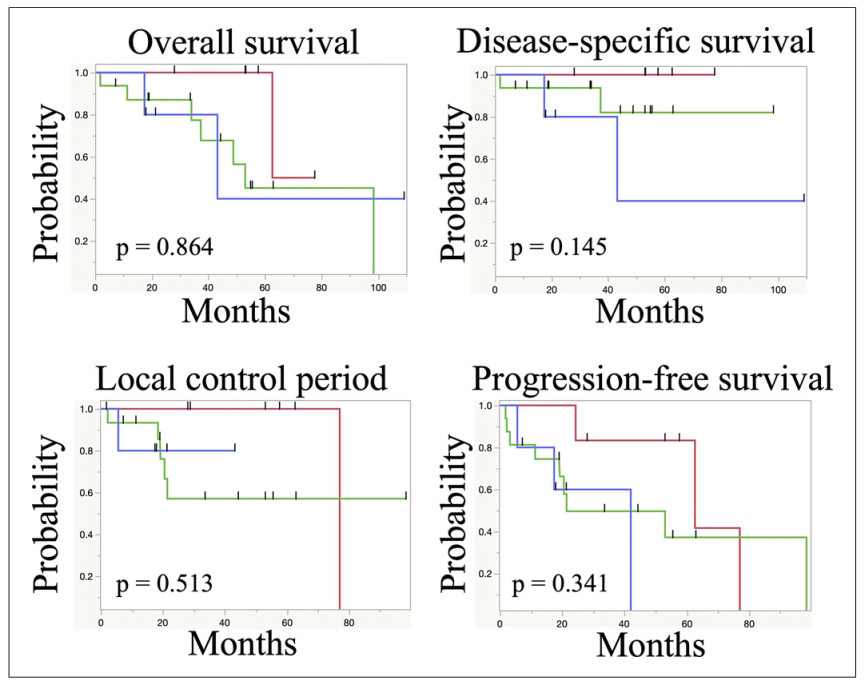
Figure 3.
Kaplan-Meier curves for OS, DSS, LC period, and PFS for patients with stage IT1aN0M0: red line, T1bN0M0: green line, T1N1M0: blue line.
-
n % Age Median 81 years (range 53–94 years) Gender Female 14 20.3 Male 55 79.7 PS 0 19 27.5 1 35 50.7 2 10 14.5 3 3 4.3 4 2 2.9 Tumor location Ut 9 13.0 Mt 33 47.8 Lt 23 33.3 Ae 1 1.4 Ce 3 4.3 Histology SCC 67 97.1 AC 1 1.4 Other 1 1.4 T stage T1 28 40.6 T2 4 5.8 T3 27 39.1 T4 10 14.5 N stage N0 29 42.0 N1 26 37.7 N2 13 18.8 N3 1 1.4 M stage M0 64 92.8 M1 5 7.2 Clinical stage Ⅰ 27 39.1 Ⅱ 9 13.0 Ⅲ 22 31.9 Ⅳ 11 15.9 Albumin level Median 3.6 g/dL (range 2.5–4.9 g/dL) Total radiation dose Median 60 Gy (range 50–66 Gy) PS, performance status; Ut, upper thoracic; Mt middle thoracic; Lt, lower thoracic; Ae abdomen esophagus; Ce, cervical esophagus; SCC, squamous cell carcinoma; AC, adenocarcinoma. Table 1.
Patients’ characteristics (n = 69)
-
OS DSS LC PFS HR 95% CI p value HR 95% CI p value HR 95% CI p value HR 95% CI p value Gender (male vs. female) 1.34 0.62–2.66 0.431 0.53 0.24–1.17 0.133 0.72 0.31–1.72 0.476 1.49 0.74–2.78 0.249 Age 1.03 0.99–1.08 0.090 1.03 0.98–1.09 0.200 0.97 0.93–1.01 0.155 1.00 0.96–1.03 0.856 PS 1.62 1.12–2.29 0.012 1.69 1.11–2.48 0.015 1.58 1.00–2.42 0.049 1.53 1.09–2.09 0.014 Tumor location (Ut vs. Mt vs. Lt-Ae vs. Ce) 1.48 0.98–2.24 0.065 1.63 0.99–2.68 0.053 1.31 0.80–2.14 0.287 1.46 1.01–2.09 0.042 T stage 1.95 1.47–2.62 <0.0001 2.43 1.70–3.56 <0.0001 1.92 1.36–2.78 0.0002 1.86 1.44–2.42 <0.0001 N stage 2.17 1.47–3.19 0.0002 2.43 1.54–3.81 0.0002 1.56 0.98–2.42 0.058 1.76 1.25–2.45 0.0002 M stage 3.56 1.04–9.29 0.044 4.12 1.20–10.96 0.028 1.68 0.27–5.80 0.515 2.76 0.82–6.99 0.093 Clinical stage 1.87 1.43–2.48 <0.0001 2.26 1.61–3.24 <0.0001 1.78 1.27–2.53 0.0008 1.75 1.36–2.25 <0.0001 Total radiation dose 0.96 0.87–1.06 0.429 0.92 0.82–1.03 0.152 0.87 0.76–0.98 0.023 0.91 0.83–1.00 0.052 Blood albumin level 0.36 0.19–0.68 0.002 0.39 0.18–0.81 0.013 0.54 0.04–1.38 0.108 0.50 0.29–0.86 0.013 OS, overall survival; DSS, disease-specific survival; LC, local control period; PFS, progression-free survival; PS, performance status; Ut, upper thoracic; Mt, middle thoracic; Lt, lower thoracic; Ae, abdomen esophagus; Ce, cervical esophagus. Table 2.
Univariate analysis for OS, DSS, LC, and PFS
-
OS DSS LC PFS HR 95% CI p value HR 95% CI p value HR 95% CI p value HR 95% CI p value PS 1.21 0.79–1.79 0.358 1.26 0.77–1.95 0.337 1.07 0.65–1.70 0.796 1.21 0.84–1.71 0.296 Tumor location (Ut vs. Mt vs. Lt-Ae vs. Ce) 1.55 1.10–2.19 0.012 Clinical stage 4.42 1.80–11.17 0.001 2.08 1.43–3.12 0.0001 1.86 1.28–2.74 0.001 1.65 1.25–2.18 0.0004 Total radiation dose 0.87 0.78–0.97 0.016 Blood albumin level 0.58 0.27–1.27 0.166 0.80 0.32–2.11 0.648 0.69 0.36–1.35 0.276 T stage, N stage, M stage, clinical stage were significant predictors in univariate analysis. Only clinical stage was included in multivariate analysis because these factors had correlations. OS, overall survival; DSS, disease-specific survival; LC, local control period; PFS, progression-free survival; PS, performance status; Ut, upper thoracic; Mt, middle thoracic; Lt, lower thoracic; Ae, abdomen esophagus; Ce, cervical esophagus. Table 3.
Multivariate analysis for OS, DSS, LC, and PFS
Figures
(3)
Tables
(3)