-
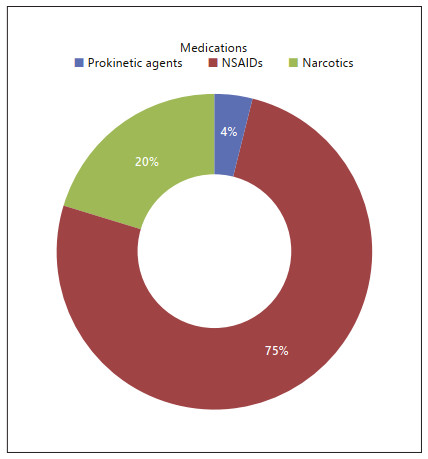
Figure 1.
Medications associated with RG in an urban minority patient population. RG, reactive gastropathy; NSAID, nonsteroidal anti-inflammatory drug.
-
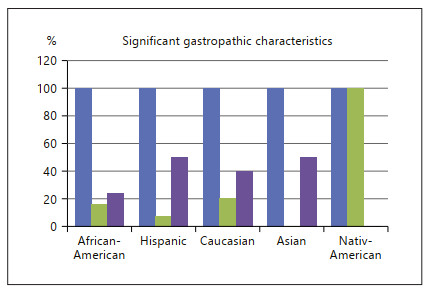
Figure 2.
Significant characteristics associated with RG stratified by ethnicity. RG, reactive gastropathy.
-
African American Hispanic Caucasian Asian Native American p value Patients, N 160 94 30 4 4 Age mean (SD) 61.95 (15.72) 64.55 (14.31) 49.57 (17.20) 67.00 (21.18) 69.00 (9.24) <0.001 BMI mean (SD) 28.73 (8.92) 29.33 (6.48) 27.41 (5.40) 26.46 (1.68) 24.21 (0.00) 0.67 Sex, n (%) M 46 (28.7) 37 (39.4) 16 (53.3) 0 (0.0) 2 (50.0) 0.03 F 114 (71.2) 57 (60.6) 14 (46.7) 4 (100.0) 2 (50.0) Smoking history, n (%) None 89 (55.6) 53 (56.4) 13 (43.3) 2 (50.0) 4 (100.0) 0.01 Active 18 (11.2) 7 (7.4) 10 (33.3) 0 (0.0) 0 (0.0) Former 33 (20.6) 20 (21.3) 7 (23.3) 0 (0.0) 0 (0.0) Unknown 20 (12.5) 14 (14.9) 0 (0.0) 2 (50.0) 0 (0.0) Alcohol use history, n (%) None 78 (48.8) 60 (63.8) 18 (60.0) 2 (50.0) 2 (50.0) 0.01 Active 35 (21.9) 4 (4.3) 8 (26.7) 0 (0.0) 0 (0.0) Former 17 (10.6) 11 (11.7) 0 (0.0) 0 (0.0) 0 (0.0) Unknown 30 (18.8) 19 (20.2) 4 (13.3) 2 (50.0) 2 (50.0) Narcotic use, n (%) No 140 (87.5) 84 (89.4) 28 (93.3) 4 (100.0) 4 (100.0) 0.75 Yes 20 (12.5) 10 (10.6) 2 (6.7) 0 (0.0) 0 (0.0) NSAID use, n (%) No 97 (60.6) 47 (50.0) 23 (76.7) 3 (75.0) 4 (100.0) 0.03 Yes 63 (39.4) 47 (50.0) 7 (23.3) 1 (25.0) 0 (0.0) Gastrointestinal prokinetic agent use, n (%) No 153 (95.6) 94 (100.0) 30 (100.0) 4 (100.0) 4 (100.0) 0.21 Yes 7 (4.4) 0 (0.0) 0 (0.0) 0 (0.0) 0 (0.0) Adenocarcinoma, n (%) No 158 (98.8) 94 (100.0) 30 (100.0) 4 (100.0) 4 (100.0) 0.8 Yes 2 (1.2) 0 (0.0) 0 (0.0) 0 (0.0) 0 (0.0) Intestinal metapalsia, n (%) No 142 (88.8) 78 (83.0) 26 (86.7) 4 (100.0) 4 (100.0) 0.71 Yes 16 (10.0) 16 (17.0) 4 (13.3) 0 (0.0) 0 (0.0) PPI therapy during endoscopy, n (%) No 119 (74.4) 47 (50.0) 18 (60.0) 2 (50.0) 4 (100.0) 0.002 Yes 37 (23.1) 47 (50.0) 12 (40.0) 2 (50.0) 0 (0.0) Gastroesophageal reflux disease, n (%) No 132 (82.5) 79 (84.0) 21 (70.0) 4 (100.0) 2 (50.0) 0.15 Yes 28 (17.5) 15 (16.0) 9 (30.0) 0 (0.0) 2 (50.0) Gallstones, n (%) No 158 (98.8) 92 (97.9) 30 (100.0) 4 (100.0) 4 (100.0) 0.92 Yes 2 (1.2) 2 (2.1) 0 (0.0) 0 (0.0) 0 (0.0) Diabetes mellitus, n (%) No 108 (67.5) 61 (64.9) 28 (93.3) 3 (75.0) 4 (100.0) 0.03 Yes 52 (32.5) 33 (35.1) 2 (6.7) 1 (25.0) 0 (0.0) Hypertension, n (%) No 54 (33.8) 33 (35.1) 21 (70.0) 3 (75.0) 2 (50.0) 0.002 Yes 106 (66.2) 61 (64.9) 9 (30.0) 1 (25.0) 2 (50.0) Cholecystectomy, n (%) No 157 (98.1) 93 (98.9) 28 (93.3) 4 (100.0) 4 (100.0) 0.43 Yes 3 (1.9) 1 (1.1) 2 (6.7) 0 (0.0) 0 (0.0) Appendectomy, n (%) No 160 (100.0) 88 (93.6) 26 (86.7) 4 (100.0) 4 (100.0) 0.002 Yes 0 (0.0) 6 (6.4) 4 (13.3) 0 (0.0) 0 (0.0) Bowel resection, n (%) No 152 (95.0) 92 (97.9) 30 (100.0) 4 (100.0) 4 (100.0) 0.55 Yes 8 (5.0) 2 (2.1) 0 (0.0) 0 (0.0) 0 (0.0) Gastrectomy, n (%) No 157 (98.1) 92 (97.9) 28 (93.3) 4 (100.0) 4 (100.0) 0.6 Yes 3 (1.9) 2 (2.1) 2 (6.7) 0 (0.0) 0 (0.0) Roux-en-Y gastrojejunostomy, n (%) No 156 (97.5) 94 (100.0) 30 (100.0) 4 (100.0) 4 (100.0) 0.5 Yes 4 (2.5) 0 (0.0) 0 (0.0) 0 (0.0) 0 (0.0) Pancreaticoduodenectomy, n (%) No 160 (100.0) 94 (100.0) 28 (93.3) 4 (100.0) 4 (100.0) 0.001 Yes 0 (0.0) 0 (0.0) 2 (6.7) 0 (0.0) 0 (0.0) Hernia repair, n (%) No 160 (100.0) 92 (97.9) 30 (100.0) 3 (75.0) 4 (100.0) <0.001 Yes 0 (0.0) 2 (2.1) 0 (0.0) 1 (25.0) 0 (0.0) NSAID, nonsteroidal anti-inflammatory drug. Table 1.
Demographic characteristics of study population stratified by ethnicity
-
African American Hispanic Caucasian Asian Native American p value Patients, N 160 94 30 4 4 Reactive gastropathy, n (%) No 1 (0.6) 0 (0.0) 0 (0.0) 0 (0.0) 0 (0.0) 0.93 Yes 159 (99.4) 94 (100.0) 30 (100.0) 4 (100.0) 4 (100.0) Gastritis, n (%) No 22 (13.8) 9 (9.6) 4 (13.3) 0 (0.0) 0 (0.0) 0.71 Yes 138 (86.2) 85 (90.4) 26 (86.7) 4 (100.0) 4 (100.0) Esophagitis, n (%) No 146 (91.2) 86 (91.5) 25 (83.3) 4 (100.0) 4 (100.0) 0.57 Yes 14 (8.8) 8 (8.5) 5 (16.7) 0 (0.0) 0 (0.0) Duodenitis, n (%) No 158 (98.8) 86 (91.5) 27 (90.0) 3 (75.0) 4 (100.0) 0.01 Yes 2 (1.2) 8 (8.5) 3 (10.0) 1 (25.0) 0 (0.0) Fibrosis, n (%) No 158 (98.8) 92 (97.9) 30 (100.0) 4 (100.0) 4 (100.0) 0.92 Yes 2 (1.2) 2 (2.1) 0 (0.0) 0 (0.0) 0 (0.0) Erosions, n (%) No 154 (96.2) 92 (97.9) 29 (96.7) 3 (75.0) 4 (100.0) 0.18 Yes 6 (3.8) 2 (2.1) 1 (3.3) 1 (25.0) 0 (0.0) Diverticulosis, n (%) No 158 (98.8) 94 (100.0) 30 (100.0) 4 (100.0) 4 (100.0) 0.8 Yes 2 (1.2) 0 (0.0) 0 (0.0) 0 (0.0) 0 (0.0) Abscess, n (%) No 158 (98.8) 94 (100.0) 30 (100.0) 4 (100.0) 4 (100.0) 0.8 Yes 2 (1.2) 0 (0.0) 0 (0.0) 0 (0.0) 0 (0.0) Intraepithelial lymphocytosis, n (%) No 156 (97.5) 88 (93.6) 28 (93.3) 4 (100.0) 4 (100.0) 0.54 Yes 4 (2.5) 6 (6.4) 2 (6.7) 0 (0.0) 0 (0.0) Schatzki ring, n (%) No 157 (98.1) 94 (100.0) 30 (100.0) 4 (100.0) 4 (100.0) 0.65 Yes 3 (1.9) 0 (0.0) 0 (0.0) 0 (0.0) 0 (0.0) Stricture, n (%) No 158 (98.8) 94 (100.0) 30 (100.0) 4 (100.0) 4 (100.0) 0.8 Yes 2 (1.2) 0 (0.0) 0 (0.0) 0 (0.0) 0 (0.0) Melanosis coli, n (%) No 158 (98.8) 94 (100.0) 28 (93.3) 4 (100.0) 4 (100.0) 0.11 Yes 2 (1.2) 0 (0.0) 2 (6.7) 0 (0.0) 0 (0.0) Foamy macrophages, n (%) No 160 (100.0) 92 (97.9) 30 (100.0) 4 (100.0) 4 (100.0) 0.37 Yes 0 (0.0) 2 (2.1) 0 (0.0) 0 (0.0) 0 (0.0) Ulcer, n (%) No 124 (77.5) 74 (78.7) 28 (93.3) 2 (50.0) 2 (50.0) 0.1 Yes 36 (22.5) 20 (21.3) 2 (6.7) 2 (50.0) 2 (50.0) Location, n (%) Antrum 158 (98.8) 91 (96.8) 28 (93.3) 4 (100.0) 4 (100.0) 0.45 Body 137 (85.6) 77 (81.9) 26 (86.7) 4 (100.0) 4 (100.0) 0.7 Duodenum 4 (2.5) 8 (8.5) 3 (10.0) 1 (25.0) 0 (0.0) 0.07 Esophagus 8 (5.0) 0 (0.0) 1 (3.3) 0 (0.0) 0 (0.0) 0.27 Incisura 26 (16.2) 6 (6.4) 6 (20.0) 0 (0.0) 4 (100.0) <0.001 Fundus 8 (5.0) 4 (4.3) 2 (6.7) 0 (0.0) 0 (0.0) 0.95 Pylorus 4 (2.5) 0 (0.0) 0 (0.0) 0 (0.0) 0 (0.0) 0.5 Hiatal hernia, n (%) No 143 (89.4) 86 (91.5) 29 (96.7) 3 (75.0) 4 (100.0) 0.52 Yes 17 (10.6) 8 (8.5) 1 (3.3) 1 (25.0) 0 (0.0) H. pylori, n (%) No 153 (95.6) 90 (95.7) 30 (100.0) 4 (100.0) 4 (100.0) 0.79 Yes 7 (4.4) 4 (4.3) 0 (0.0) 0 (0.0) 0 (0.0) Gastric polyp, n (%) No 132 (82.5) 79 (84.0) 22 (73.3) 4 (100.0) 2 (50.0) 0.25 Yes 28 (17.5) 15 (16.0) 8 (26.7) 0 (0.0) 2 (50.0) Tissue architectural changes, n (%) None 152 (95.0) 80 (85.1) 28 (93.3) 4 (100.0) 4 (100.0) 0.004 Hyperplastic 4 (2.5) 0 (0.0) 2 (6.7) 0 (0.0) 0 (0.0) Dysplastic 4 (2.5) 4 (4.3) 0 (0.0) 0 (0.0) 0 (0.0) Metaplastic 0 (0.0) 10 (10.6) 0 (0.0) 0 (0.0) 0 (0.0) Table 2.
Gastropathic characteristics of the study population stratified by ethnicity
Figures
(2)
Tables
(2)