-
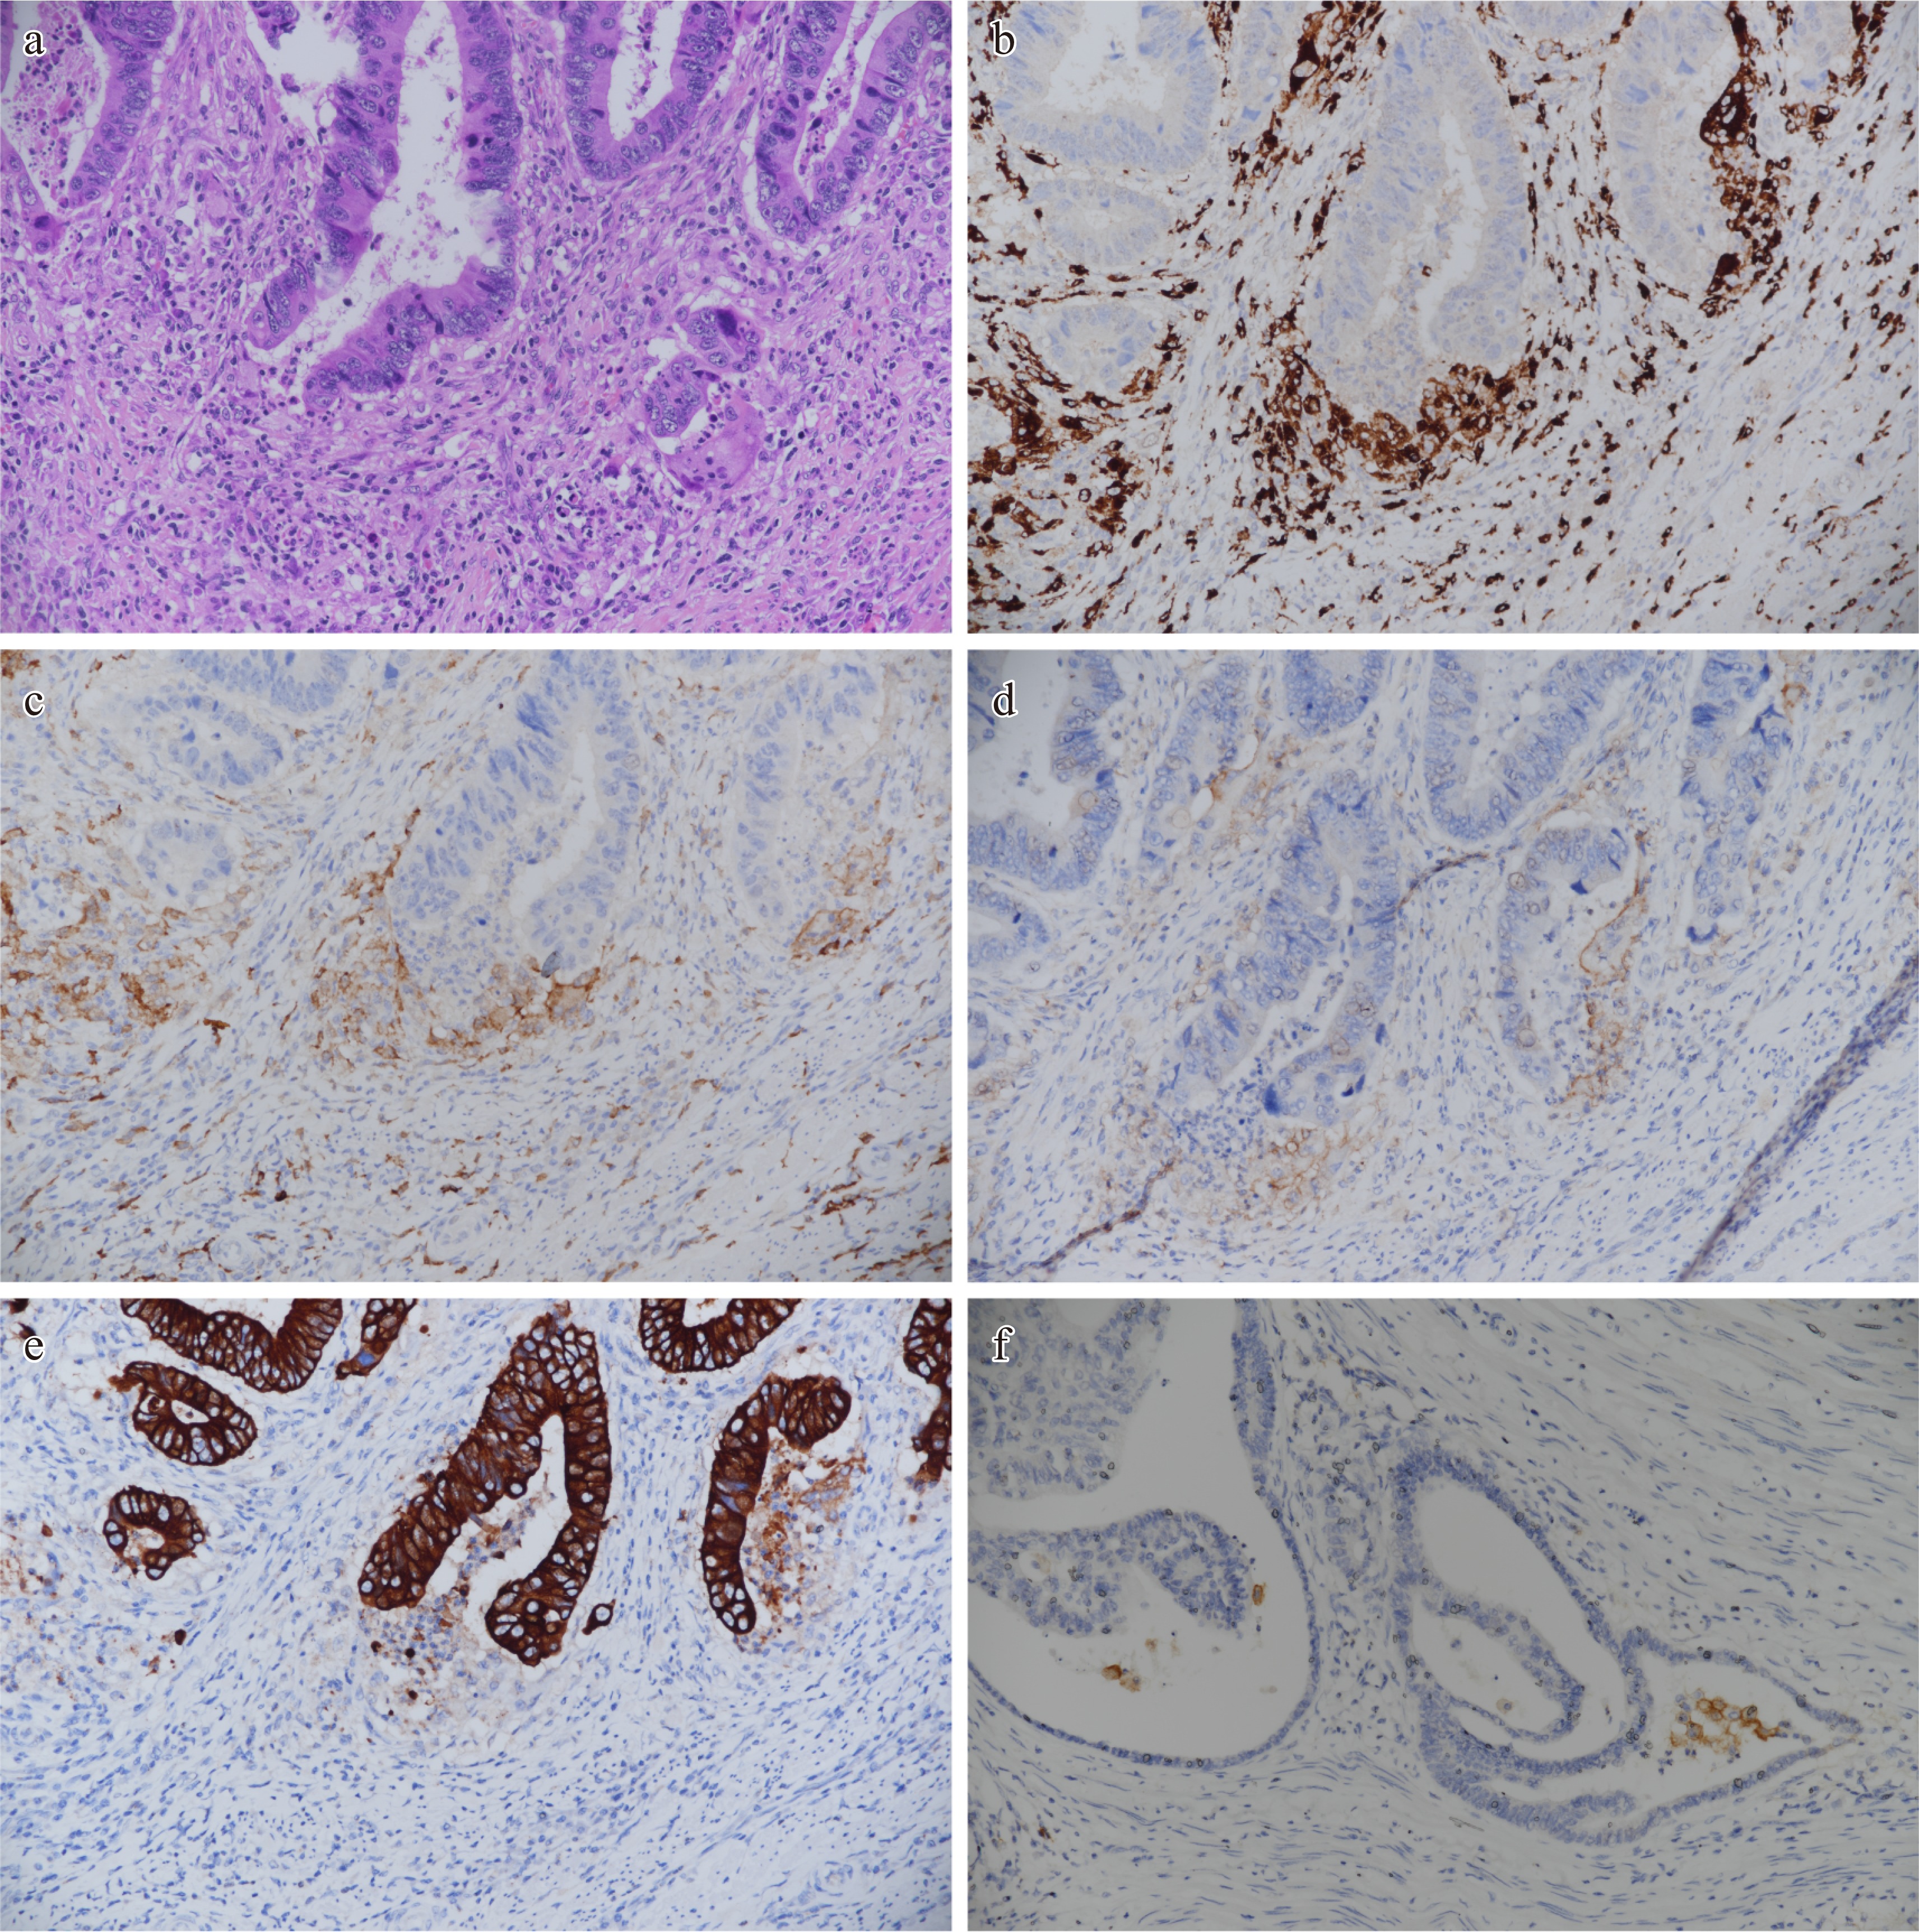
Figure 1.
Sample mapping of areas where PD-L1 macrophage score can be generated in the tumor gland microenvironment of colon adenocarcinoma. Immunohistochemical study findings in the same tumor microenvironment are shown. Similar findings can be replicated. (a) Especially tumor gland and gland rupture areas, HE 20×. (b) CD68 positive macrophages around the tumor gland, 20×. (c) CD163 positive macrophages in the tumor gland microenvironment, 20×. PD-L1 weak and moderately positive macrophages in the tumor gland microenvironment (PD-L1 macrophage score = PD-L1 positive macrophage number / Tumor cell number × 100). (d) The image that other immune cells are negative and it is possible to generate the PD-L1 macrophage score, 20×. (e) It is seen that cells expressing CD68, CD163 and PD-L1 in the same area do not stain with pancytokeratin, 20×. (f) Another distinct tumor area and PD-L1 positive macrophages around the tumor gland stained strongly positive, 20×.
Figures
(1)
Tables
(0)