-
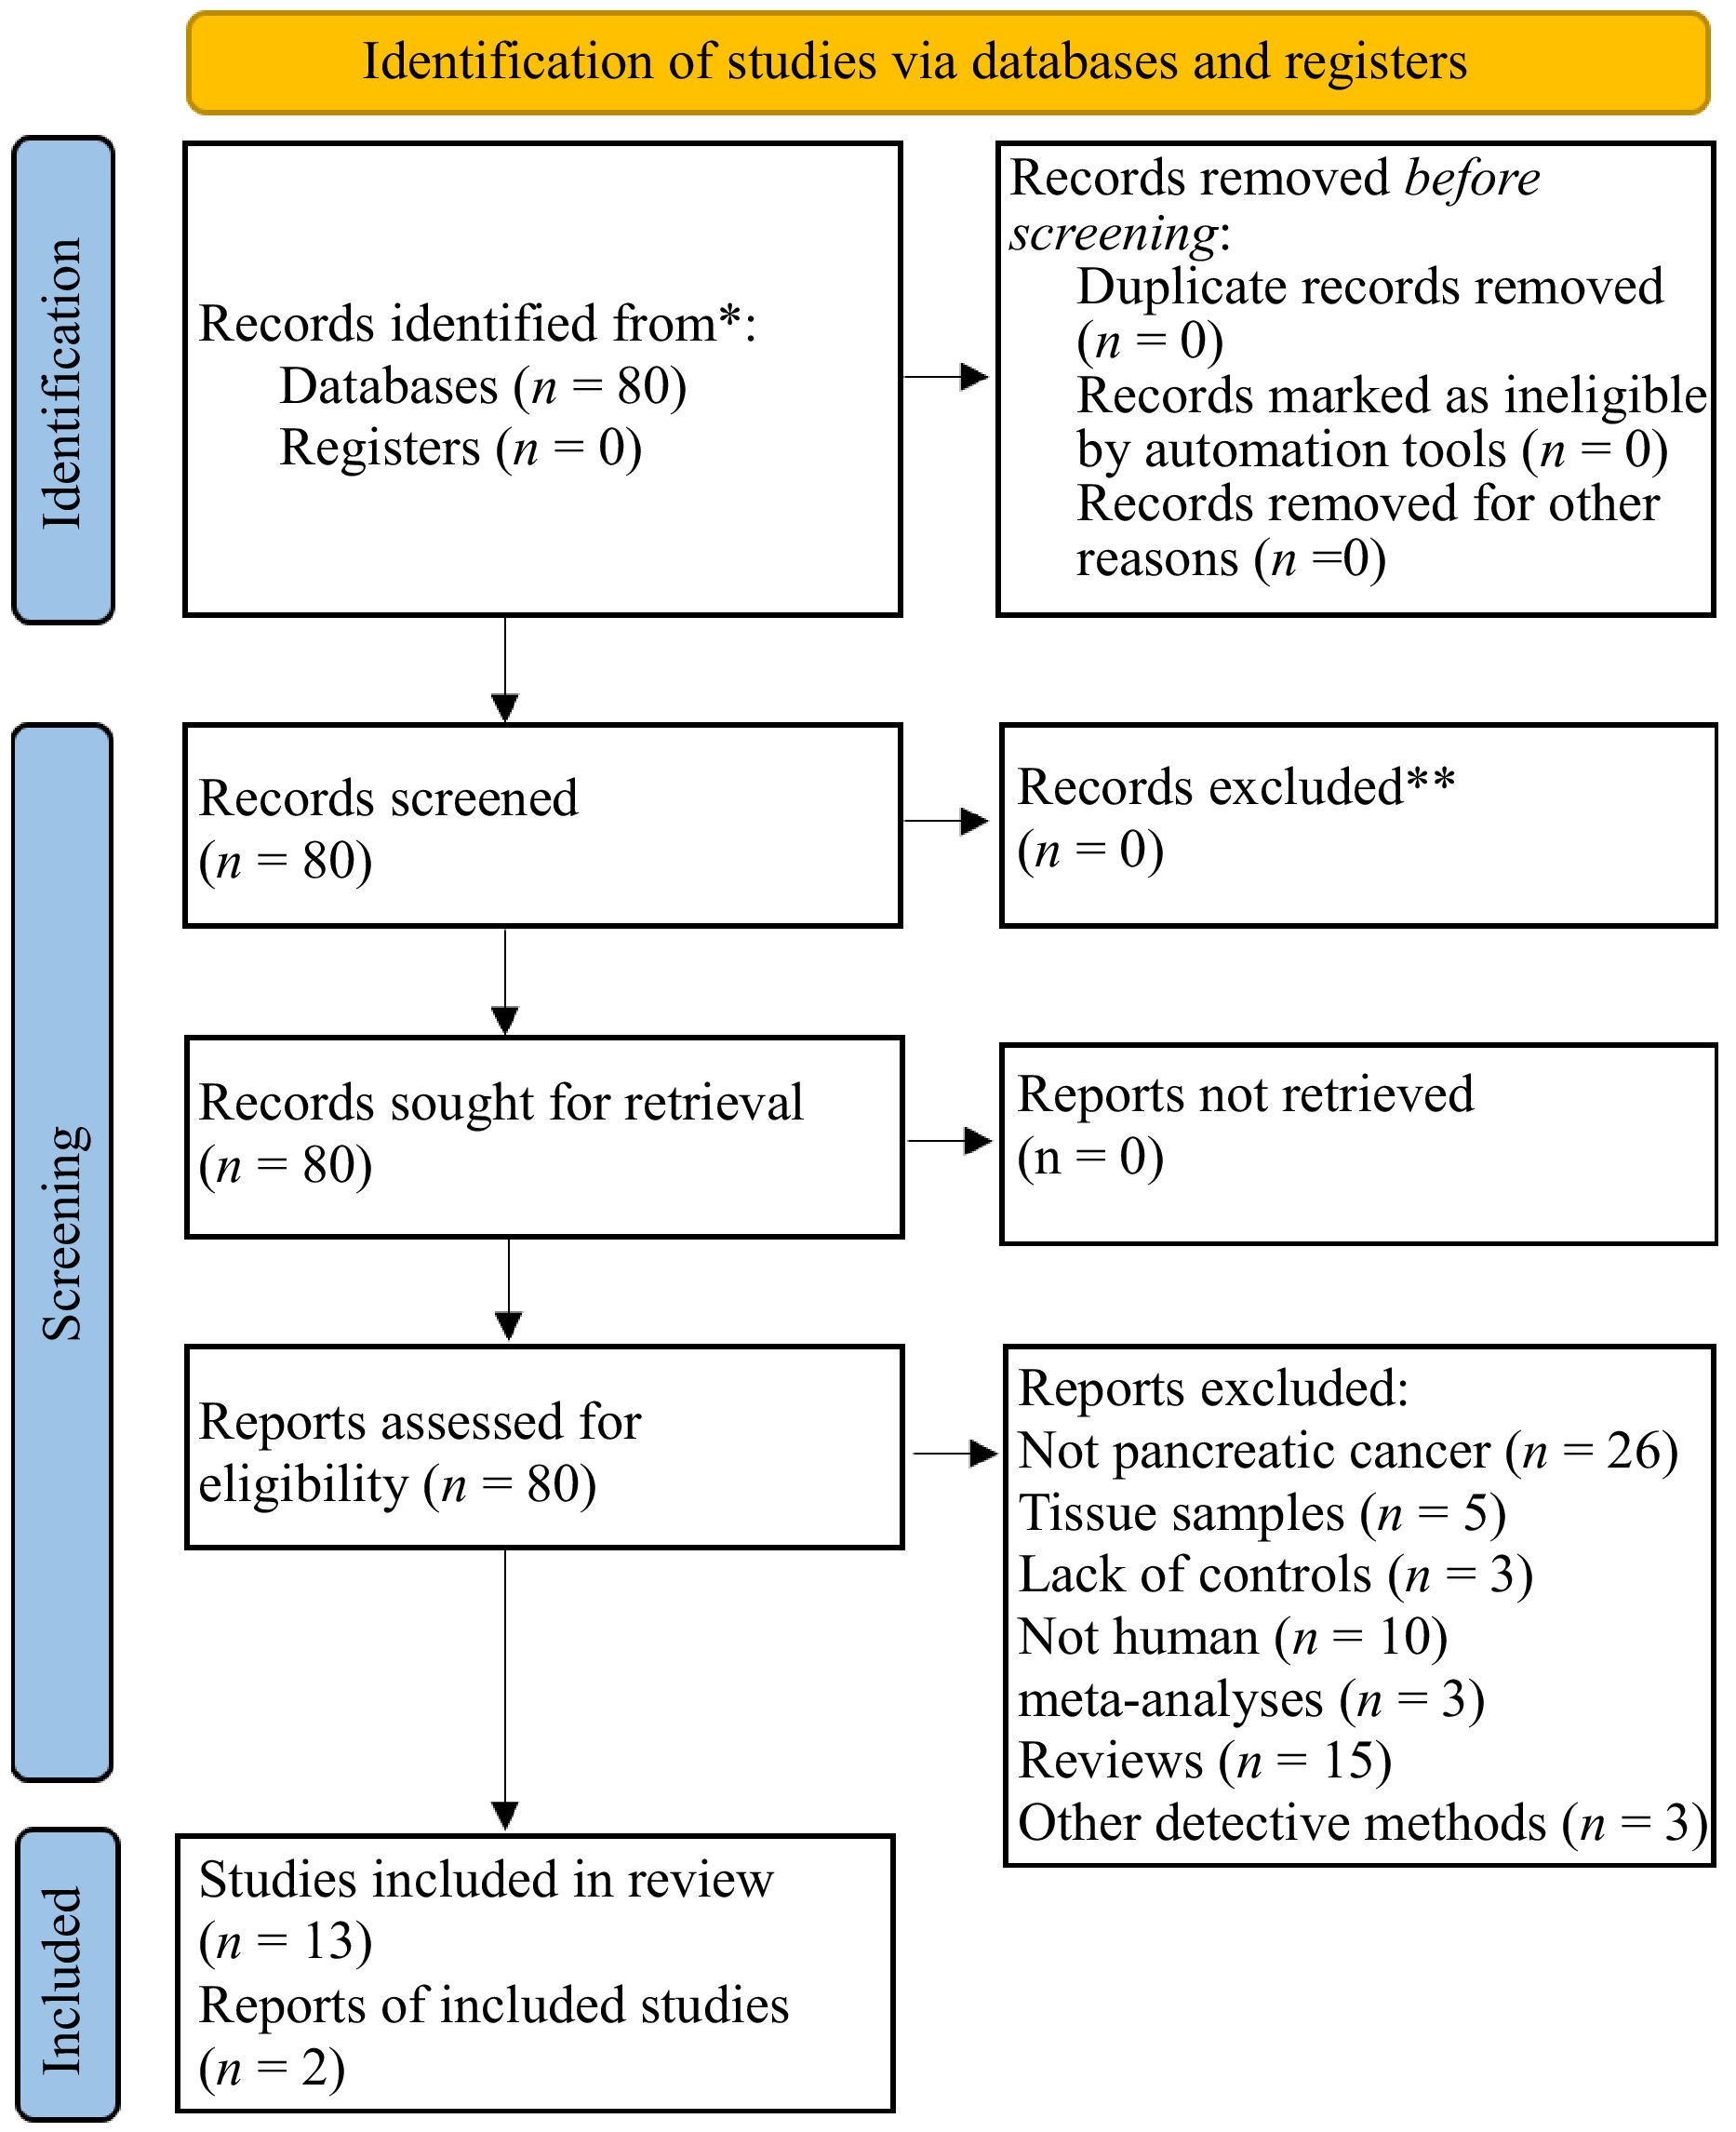
Figure 1.
Flowchart.
-
Study Country Publication type Study type NOS score Fan et al., 2018[26] USA Journal article Prospective cohort 8 Torres et al., 2015[31] USA Journal article Controlled 8 Olson et al., 2017[29] USA Journal article Pilot 7 Lin et al., 2013[34] USA Conference proceedings Pilot 7 Lu et al., 2019[28] China Journal article Controlled 8 Vogtmann et al., 2019[32] Iran Journal article Controlled 8 Ren et al., 2017[30] China Journal article Controlled 8 Half et al., 2019[27] Israel Journal article Controlled 8 Half et al., 2015[33] Israel Conference proceedings Pilot 6 Kartal et al., 2022[35] Germany Journal article Case–control 6 Chen et al., 2023[36] China Journal article Controlled 7 Hashimoto et al., 2022[38] Japan Journal article Controlled 8 Sono et al., 2024[39] Japan Journal article Controlled 7 Zhao et al., 2024[37] China Journal article Controlled 8 Yang et al., 2023[40] China Journal article Controlled 6 NOS, Newcastle-Ottawa Scale. USA, United States of America. Table 1.
Study characteristics.
-
Study Sample size Age % male BMI % smoking PC Control PC Control PC Control PC Control PC Control Fan et al., 2018[26] 361 371 68.5 68.3 57.1 57.1 − − 57.3 49.9 Torres et al., 2015[31] 8 100
(other disease 78 HC 22)71.1 60.7
(other cancers)75.0 50.0 − − − − Olson et al., 2017[29] 40 97
(IPMN 39; HC 58)< 70, 64.0%; ≥ 70, 35.0% < 70, 42.0%; ≥ 70, 59.0% (IPMN); < 70, 81.0%;
≥ 70, 19.0% (HC)53.0 56.0 (IPMN); 40.0 (HC) Normal 38.0%; abnormal 61.0% Normal 36.0%;
abnormal 64.0% (IPMN); normal 43.0%;
abnormal 57.0% (HC)44.0 46.0 (IPMN); 31.0 (HC) Lin et al., 2013[34] 13 15
(pancreatitis 3 HC 12)− − − − − − − − Lu et al., 2019[28] 30 25 50.8 ± 5.3 48.2 ± 6.0 70.0 80.0 22.5 ± 1.2 22.6 ± 1.6 − − Vogtmann et al., 2019[32] 273 285 < 70, 63.7%;
≥ 70, 36.3%< 70, 67.4%; ≥ 70, 32.6% 60.4 46.0 Normal 57.5%; abnormal 42.5% Normal 46.3%;
abnormal 53.7%30.5 25.6 Ren et al., 2017[30] 85 57 56.0 (33.0–78.0) 52.0 (43.0–67.0) 55.3 63.2 22.7 (19.5–26.0) 23.2 (18.5–27.1) − − Half et al., 2019[27] 30 35
(NAFLD 16; PCL 6 HC 13)68.9 ± 6.2 51.0 ± 10.8 (NAFLD);
66.0 ± 15.3 (PCL);
59.0 ± 8.7 (HC)53.3 75.0 (NAFLD);
83.3 (PCL); 46.2 (HC)− − − − Half et al., 2015[33] 15 15 − − − − − − − − Kartal et al., 2022[35] 57 79 (HC 50 CP 29) − − − − − − − − Chen et al., 2023[36] 40 54 (HC 50 CP 15) − − − − − − − − Hashimoto et al., 2022[38] 5 68 70.0−89.0 54.0 40.0 42.6 − − − − Sono et al., 2024[39] 30 18 63.7 63.0 53.3 66.7 22.0 24.5 36.7 88.9 Zhao et al., 2024[37] 29 9 67.6 ± 10.8 30.5 ± 6.8 58.6 33.3 22.4 ± 2.9 20.8 ± 1.5 − − Yang et al., 2023[40] 44 50 − − 47.7 − 22.4 ± 2.8 − − − /, no related information; BMI, body-mass index; HC, healthy control; IPMN, intraductal papillary mucinous neoplasms; NAFLD, non-alcoholic fatty liver disease; PCL, pre-cancerous lesions. Notes: * It was a prospective study including two large population-based cohorts whose BMI was described in Median or mean. Table 2.
Population characteristics.
-
Study Sample Temperature
for storageMeasurement
methodDiversity assessment Antibiotics Probiotic or
prebioticα-diversity β-diversity Fan et al., 2018[26] Oral wash −80 °C 16S V3–V4 Shannon, Simpson PCoA − − Torres et al., 2015[31] Saliva −80 °C 16S Chao1 ANOSIM Not in 2 wk − Olson et al., 2017[29] Saliva − 16S V4–V5 NP Shannon, Inverse Simpson NA Not in 30 d − Lin et al., 2013[34] Oral wash − 16S − − − − Lu et al., 2019[28] Tongue coat − 16S V3–V4 Shannon, Simpson, inverse Simpson, Obs, Chao 1, ACE PCoA Not in 8 wk Not in 8 wk Vogtmann et al., 2019[32] Saliva −70 °C 16S V4 Observed SVs, Shannon, Faith's PD PCoA − − Ren et al., 2017[30] Stool −80 °C 16S V3–V5 Shannon, Simpson, Chao 1 PCoA Not in 8 wk Not in 8 wk Half et al., 2019[27] Stool −80 °C 16S Shannon PCoA Not in 8 wk − Half et al., 2015[33] Stool − 16S − ANOSIM − − Kartal et al., 2022[35] Stool and saliva −80 °C 16S V4 Shannon, Simpson Unweighted TINA index − − Chen et al., 2023[36] Fecal and saliva −80 °C 16S V3–V4 Chao1, Shannon observed species, and PD whole tree PCoA Not in 4 wk Not in 4 wk Hashimoto et al., 2022[38] Stool and saliva −80 °C 16S Shannon PCoA Not in 6 months Not in 6 months Sono et al., 2024[39] Stool and saliva − 16S V3–V4 Observed features, Shannon BrayeCurtis dissimilarity QIIME 2 − − Zhao et al., 2024[37] Stool −80 °C 16S V3–V4 Chao 1 Acex, Shannon Simpson Sobs i Coverage Mothur software Qiime Not in 8 wk Not in 8 wk Yang et al., 2023[40] Stool −80 °C 16S Chao 1 Shannon PCoA − − −, no related information. d, day; wk, week. Table 3.
Methodologic characteristics.
-
Study Bacteria taxonomic level Phylum Class Order Family Genus Fan et al., 2018[26] Bacteroidetes (↑) SR1[C-1] (↑) Fusobacteriales (↓) Leptotrichiaceae (↓) Alloprevotella, Porphyromonas gingivalis, and Aggregatibacter actinomycetemcomitans (↑) Fusobacteria (↓) Fusobacteria (↓) Leptotrichia (↓) Torres et al., 2015[31] Firmicutes (↑) Leptotrichia Bacteroides (↑) Proteobacteria (↓) Porphyromonas Aggregatibacter Neisseria (↓) Olson et al., 2017[29] Firmicutes (↑) Bacilli (↑) Lactobacillales (↑) Streptococcaceae (↑) Streptococcus (↑) Proteobacteria (↓) Gammaproteobacteria; Betaproteobacteria (↓) Pasteurellales Neisseriales (↓) Pasteurellaceae Neisseriaceae (↓) Haemophilus Neisseria (↓) Lin et al., 2013[34] Bacteroides (↑) Corynebacterium Aggregatibacter (↓) Lu et al., 2019[28] Firmicutes, Fusobacteria and Actinobacteria (↑) Leptotrichiaceae, Fusobacteriaceae, Actinomycetaceae, Lachnospiraceae, Micrococcaceae, Erysipelotrichaceae, and Campylobacteraceae (↑) Leptotrichia, Fusobacterium, Actinomyces, Rothia, Solobacterium, Oribacterium, Campylobacter, Atopobium, and Parvimonas (↑) Bacteroidetes (↓) Prevotellaceae, Pasteurellaceae, and Porphyromonadaceae (↓) Porphyromonas, Haemophilus, and Paraprevotella (↓) Vogtmann et al., 2019[32] Enterobacteriales (↑) Enterobacteriaceae, Bacteroidaceae, Staphylococcaceae (↑) Lachnospiraceae G7 (↑) Haemophilus (↓) Ren et al., 2017[30] Bacteroidetes (↑) Prevotella, Veillonella, Klebsiella, Selenomonas, Hallella, Enterobacter, and Cronobacter (↑) Firmicutes and Proteobacteria (↓) Gemmiger, Bifidobacterium, Coprococcus, Clostridium IV, Blautia, Flavonifractor, Anaerostipes, Butyricicoccus, and Dorea (↓) Half et al., 2019[27] Bacteroidetes (↑) Bacteroidia; Verrucomicrobiae; Clostridia Bacteroidales; Verrucomicrobiales; Clostridiales Porphyromonadaceae; Verrucomicrobiaceae; Clostridiaceae1 Odoribacter, Akkermansia (↑) Firmicutes (↓) Clostridiumsensustricto1 (↓) Half et al., 2015[33] Bacteroidetes Verrucomicrobia (↑) Sutterella, Veillonella, Bacteroides, Odoribacter, and Akkermansia (↑) Firmicutes and Actinobacteria (↓) Kartal et al., 2022[35] Veillonella atypica, Fusobacterium, nucleatum/hwasookii, Alloscardovia, omnicolens (↑) Romboutsia timonensis, Faecalibacterium, rausnitzii, Bacteroides, coprocola, Bifidobacterium, and bifidum (↓) Chen et al., 2023[36] Bacteroidetes (↑) Veillonella, Peptostreptococcus, Akkermansia, Parvimonas, Solobacterium, Olsenella, and Escherichia-Shigella (↑) Firmicutes (↑) Proteobacteria (↑) Verrucomicrobia (↑) Hashimoto et al., 2022[38] Actinomyces, Lactobacillus, Streptococcus, and Veillonella (↑) Anaerostipes (↓) Sono et al., 2024[39] Firmicutes (↑) Streptococcus (↑) Proteobacteria (↓) Neisseria (↓) Zhao et al., 2024[37] Moraella, Sphingomonas Oxalobacteriae Yang et al., 2023[40] Firmicutes, Bacteroidetes, Proteobacteria, and Actinobacteria (↑) Streptococcus, Lactobacillus, and Bifidobacterium (↑) Table 4.
Discriminating taxa.
-
Study Models Sensitivity Specificity AUC Lu et al., 2019[28] Fusobacterium, Leptotrichia, and Porphyromonas 0.771 0.786 0.802 Ren et al., 2017[30] Based on the 40 genera 0.859 0.667 0.842 Half et al., 2019[27] Based on discriminating taxa 0.769 0.8 0.825 Chen et al., 2023[36] Random forest − − 0.916 Yang et al., 2023[40] Random forest − − 0.927 AUC, area under the receiver operator characteristic curve. Table 5.
Diagnostic models.
Figures
(1)
Tables
(5)