-
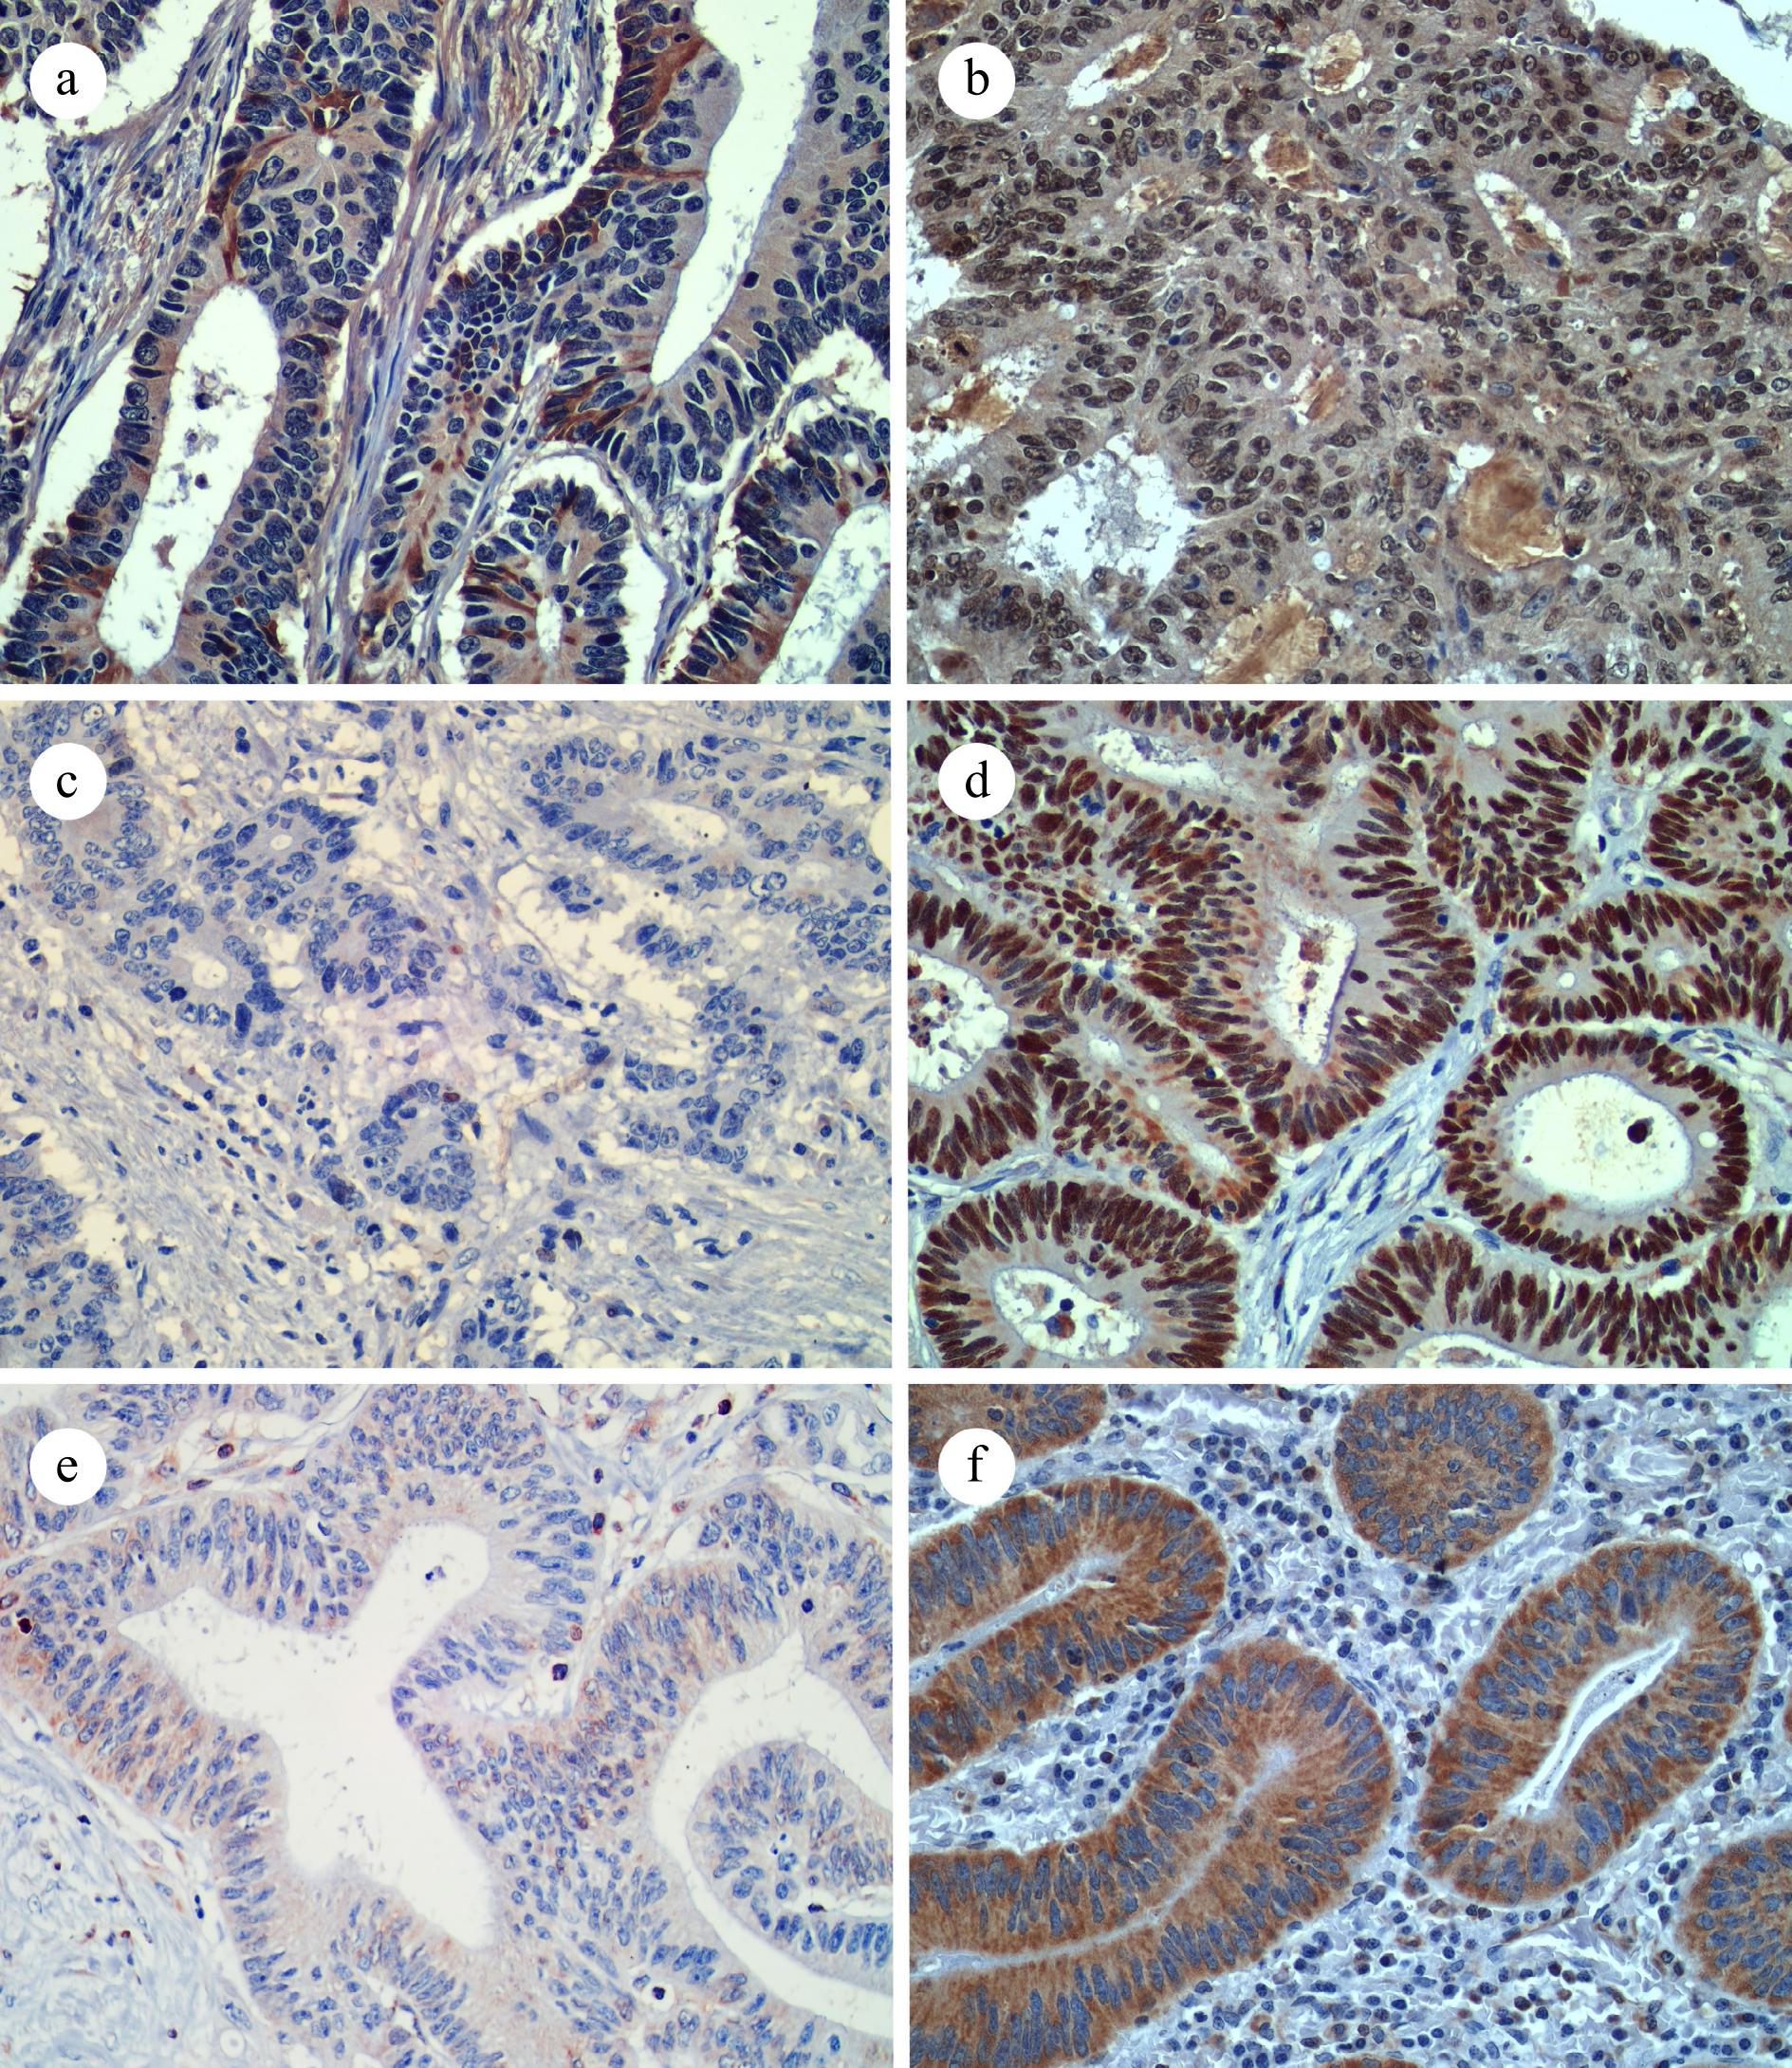
Figure 1.
Representative IHC images for (a) low DEK expression, (b) high DEK expression, (c) p53 negative expression, (d) p53 positive expression, (e) Bcl-2 negative expression, and (f) Bcl-2 positive expression. (400x, IHC).
-
Characteristic No. of cases (%) Age < 50 years 12 (23.5%) > 50 years 39 (76.5%) Mean (standard deviation) 56.84 (± 13.00%) Sex Male 27 (52.9%) Female 24 (47.1%) Tumor location Colon 33 (64.7%) Rectum 18 (35.3%) Largest tumor dimension < 5 cm 17 (33.3%) > 5 cm 34 (66.7%) Margin status Negative 38 (74.5%) Positive 13 (25.5%) Histology grade Low grade 41 (80.4%) High grade 10 (19.6%) Depth of invasion (pT) Submucosa (pT1) 0 (0) Muscularis propria (pT2) 13 (25.5%) Subserosa (pT3) 30 (58.8%) Invades other organs/perforates peritoneal visceral (pT4) 8 (15.7%) Lymphovascular invasion Absent 36 (70.6%) Present 15 (29.4%) Perineural invasion Absent 44 (86.3%) Present 7 (13.7%) Lymph node metastasis Absent 28 (54.9%) Present 23 (45.1%) Tumor stages Localized (I-IIA) 25 (49%) Advanced (IIB-IV) 26 (51%) Table 1.
Clinicopathological characteristics of the research sample (n = 51).
-
Characteristic DEK p53 Bcl-2 Low High p Negative Positive p Negative Positive p Tumor location Colon 13 20 0.669a 17 16 0.212a 1 32 0.282a Rectum 6 12 6 12 2 16 Largest tumor dimension < 5 cm 6 11 0.838a 7 10 0.69a 2 15 0.255a > 5 cm 13 21 16 18 1 33 Margin status Negative 11 27 0.05a 17 21 0.929a 1 37 0.156a Positive 8 5 6 7 2 11 Histology grade Low grade 13 28 0.146a 16 25 0.154b 0 41 0.006a High grade 6 4 7 3 3 7 Depth of invasion (pT) T1−T2 3 10 0.323a 5 8 0.577a 1 12 1.00a T3−T4 16 22 20 18 2 36 Lymphovascular invasion Absent 11 25 0.125a 18 18 0.276a 3 33 0.546a Present 8 7 5 10 0 15 Perineural invasion Absent 17 27 0.669a 21 23 0.436b 3 41 1.00a Present 2 5 2 5 0 7 The values are presented as No. of cases. a Chi-square test. b Fisher test. Table 2.
Clinicopathological characteristics and its association with DEK, p53, and Bcl-2 expression in colorectal cancers (n = 51).
-
Parameter Tumor stage p LN metastasis p Localized
(I-IIA)Advanced
(IIB-IV)Absent Present DEK Low 5 14 0.012a 6 13 0.010a High 20 12 22 10 p53 Negative 15 8 0.036a 16 7 0.056a Positive 10 18 12 16 Bcl-2 Negative 1 2 1.00a 1 2 0.583a Positive 24 24 27 21 The values are presented as No. of cases. LN, lymph node. a Chi-square test. Table 3.
Analysis of DEK, p53, and Bcl-2 association with tumor stage and lymph node metastasis (n = 51).
-
p53 p Bcl-2 p Negative Positive Negative Positive DEK Low 5 14 0.038a 17 2 0.547a High 18 14 31 1 The values are presented as No. of cases. a Chi-square test. Table 4.
Analysis of DEK association with p53 and Bcl-2 (n = 51).
-
B SE Wald OR CI (95%) p Lower Upper DEK 1.323 0.658 4.040 3.756 1.034 13.652 0.044 p53 −0.936 0.623 2.260 0.392 0.116 1.329 0.133 B, Coefficient. SE, standard error. Wald, Wald statistic. OR, odd ratio. CI, confidence interval. Table 5.
Multivariate analysis (using binomial logistic regression) of DEK and p53 association with advanced-stage tumor (n = 51).
Figures
(1)
Tables
(5)