-
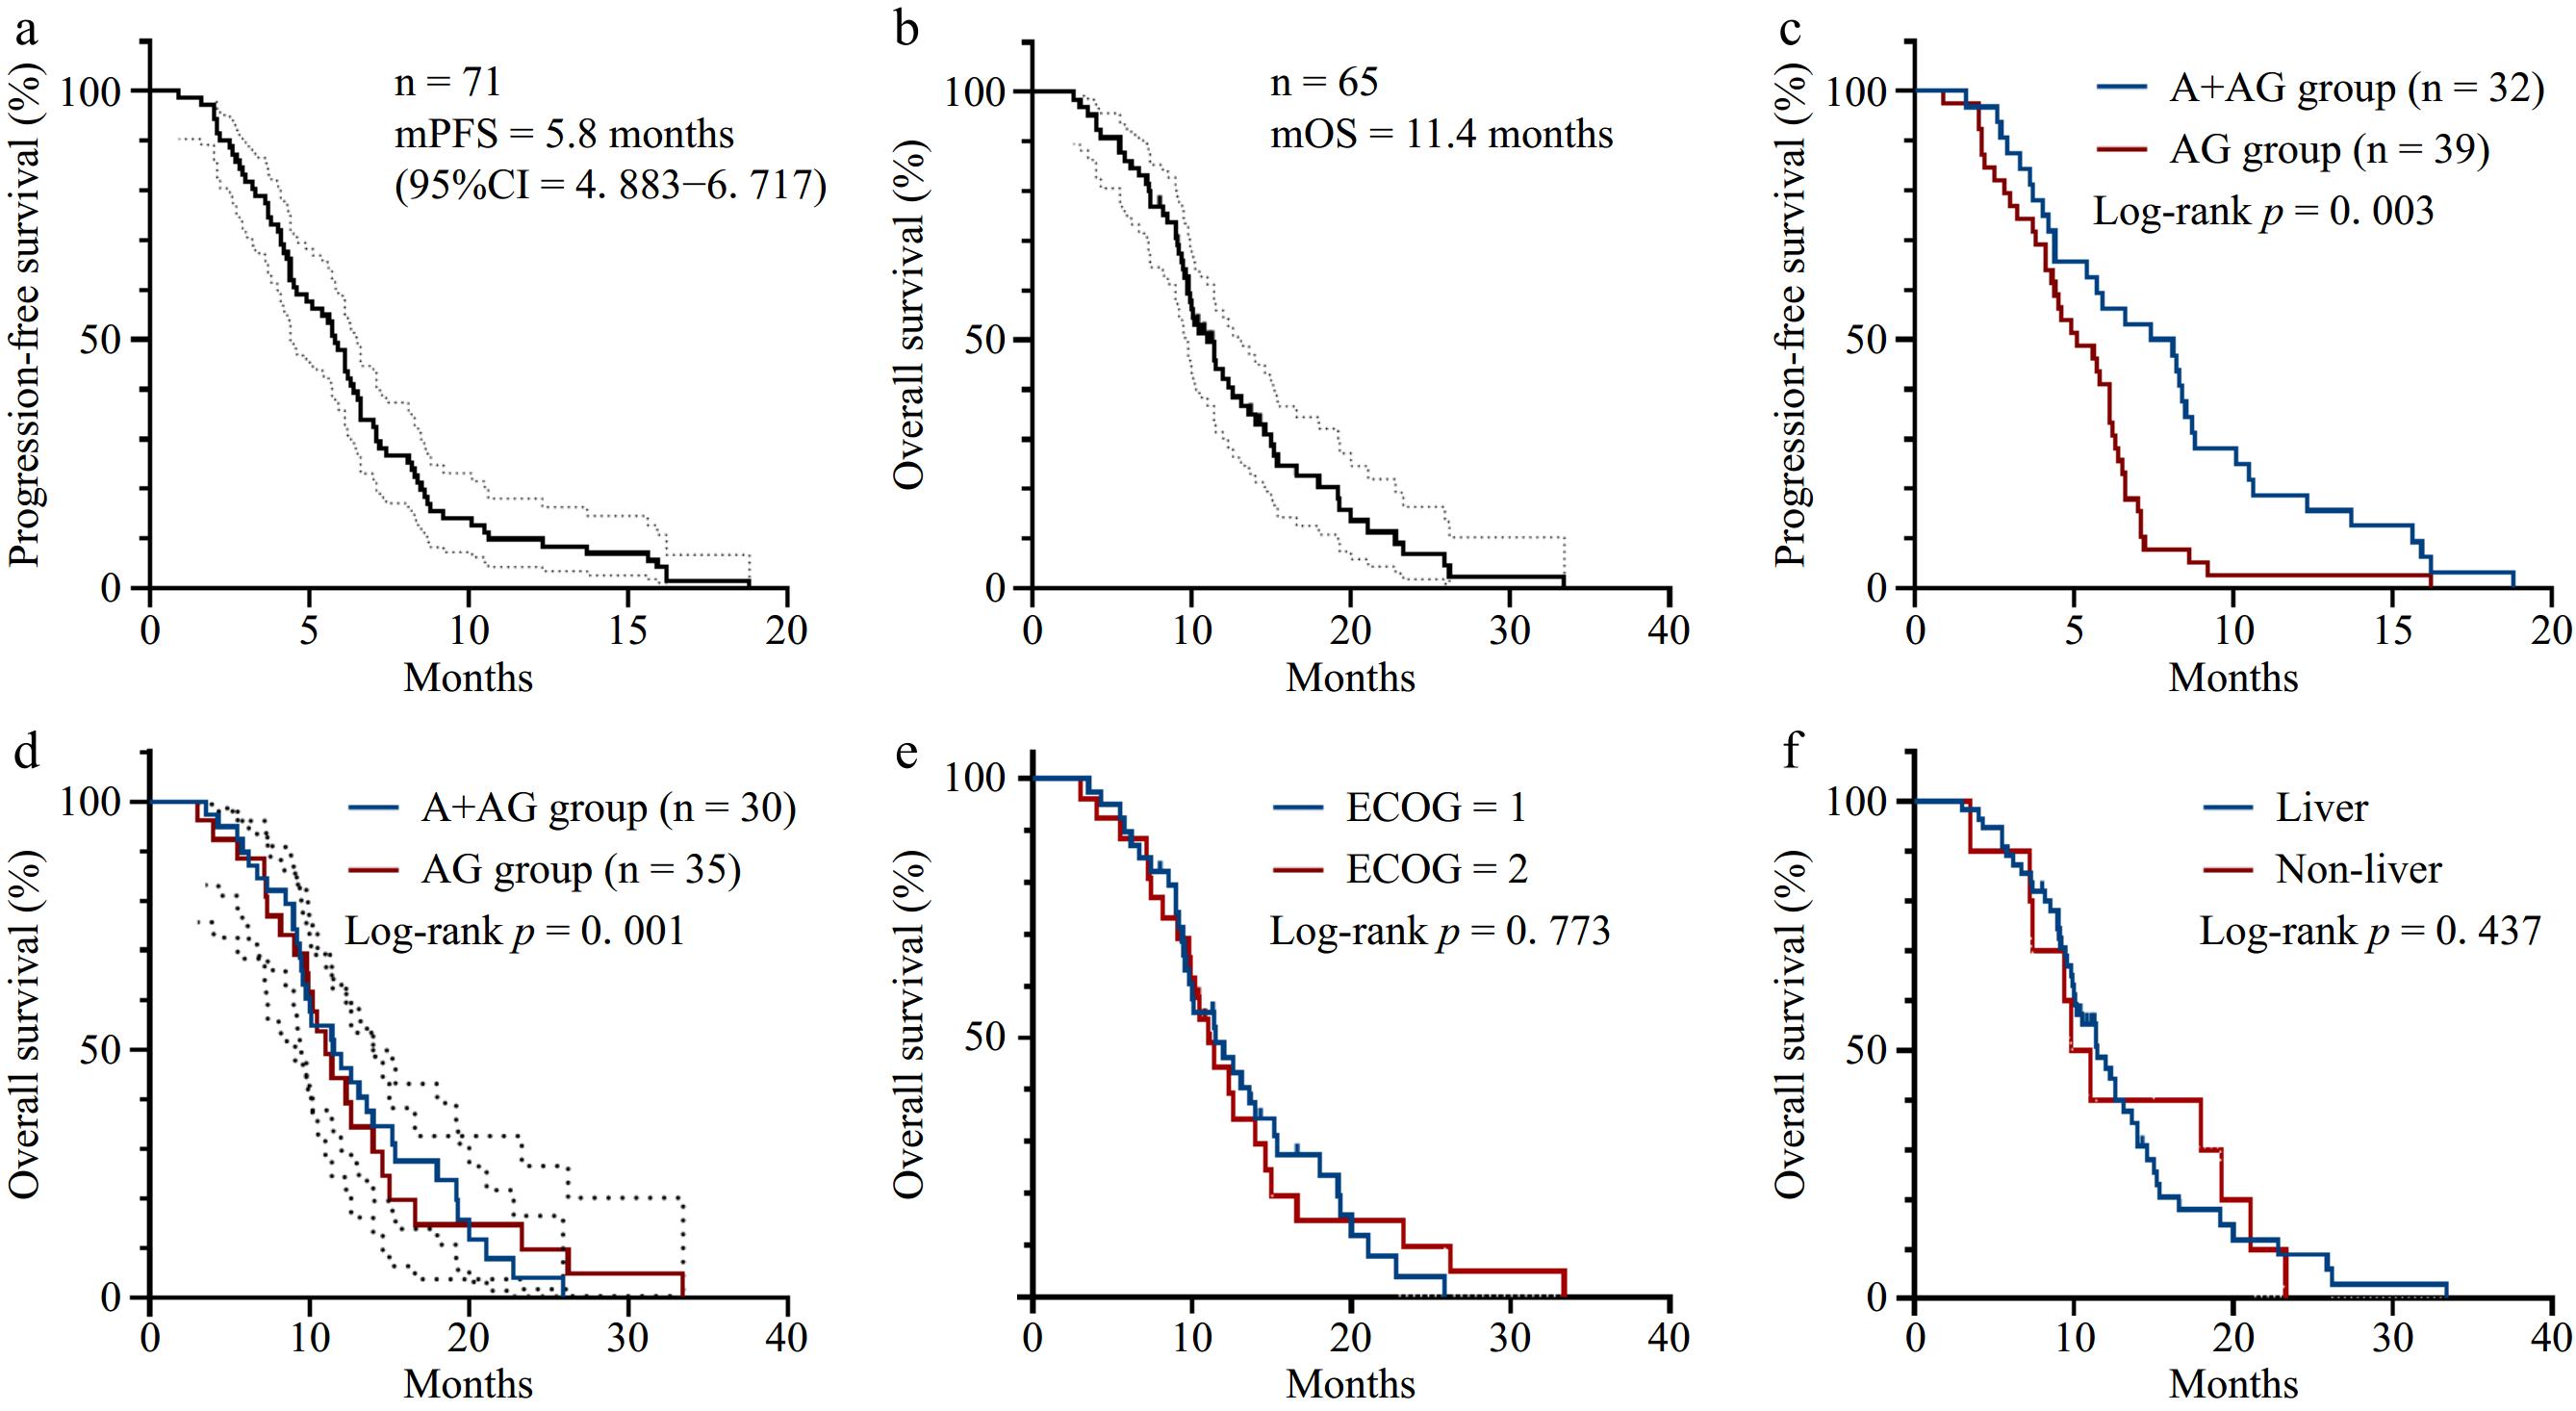
Figure 1.
Survival curves of patients in this study. (a) PFS survival curve of the overall population with mPFS of 5.8 months (95% CI = 4.883−6.717). (b) OS survival curve of the overall population with mOS of 11 months (95% CI = 9.355−13.505). (c) PFS survival curves of the A + AG regimen group and the AG regimen group (p = 0.003). (d) OS survival curves of the A + AG regimen group and AG regimen group (p = 0.001). (e) OS survival curves according to the ECOG score. (f) OS survival curves according to the metastasis site.
-
Clinical characteristics A + AG group
(n = 32)AG group
(n = 39)p-value Gender 0.551 Male 20 (62.5%) 27 (69.2%) Female 12 (37.5%) 12 (30.8%) Age (years, $ \overline{x}\pm s $ 64.0 ± 10.0 66.9 ± 8.7 0.199 Smoking history 10 (31.3%) 10 (25.6%) 0.601 Drinking history 11 (34.4%) 15 (38.5%) 0.722 Past medical history Hypertension 14 (43.8%) 15 (38.5%) 0.652 Diabetes 10 (31.3%) 13 (33.3%) 0.852 BMI (kg/m2), $\overline{x}\pm s $ 22.6 ± 2.5 21.4 ± 2.8 0.089 ECOG score 0.801 0−1 19 (59.4%) 22 (56.4%) 2 13 (40.6%) 17 (43.6%) Pathological type 0.782 Adenocarcinoma 28 (87.5%) 36 (92.3%) Other types 4 (12.5%) 3 (7.7%) Metastatic site Liver 25 (78.1%) 23 (59.0%) 0.086 Lung 10 (31.3%) 15 (38.5%) 0.527 Peritoneum 4 (12.5%) 9 (23.1%) 0.252 Lymph node 17 (53.1%) 21 (53.8%) 0.952 CA19-9 (U/ml) 0.307 ≤ 27 9 (28.1%) 7 (21.9%) > 27 23 (71.9%) 32 (78.1%) TR (u/ml) 0.185 ≤ 4 12 (37.5%) 9 (23.1%) > 4 20 (62.5%) 30 (76.9%) The figures in parentheses indicate the proportion of patients as percentages. Table 1.
Patient characteristics.
-
Tumor response A + AG group (n = 32) AG group (n = 39) p-value CR 0 0 PR 4 2 SD 24 27 PD 4 10 ORR 4 (12.5%) 2 (5.1%) 0.399 DCR 28 (87.5%) 29 (74.4%) 0.233 Table 2.
Comparison of tumor response status between the two groups.
-
Clinical features Univariate analysis Multivariate analysis HR 95% CI p HR 95% CI p Gender Male 1.00 Female 0.70 0.34−1.44 0.331 Age 1.03 0.99−1.07 0.141 BMI (kg/m2 ) 1.09 0.96−1.24 0.205 Hypertension True 1.000 False 0.909 0.467−1.769 0.778 ECOG score 1.24 0.64−2.38 0.526 Pathological type Adenocarcinoma 1.00 1.00 Other types 10.20 2.24−46.53 0.003 1.07 0.18−6.52 0.943 Lymph node metastasis True 1.00 False 0.72 0.37−1.42 0.342 Liver metastasis True 1.00 False 1.28 0.67−2.46 0.461 Pulmonary metastasis True 1.00 False 0.79 0.40−1.55 0.492 Peritoneal metastasis True 1.00 False 0.70 0.32−1.53 0.372 CA199 level Negative 1.00 Positive 1.97 0.85−4.58 0.113 TR 0.96 0.85−1.07 0.457 Table 3.
Univariate and multivariate analysis of factors influencing PFS in patients in the AG regimen group.
-
Clinical features Univariate analysis Multivariate analysis HR 95% CI p HR 95% CI p Gender Male 1.00 Female 1.30 0.62−2.73 0.487 Age 1.00 0.96−1.05 0.981 BMI (kg/m2 ) 1.01 0.90−1.14 0.858 Hypertension True 1.00 False 0.59 0.28−1.22 0.156 ECOG score 1.13 0.56−2.26 0.737 Pathological type Adenocarcinoma 1.00 1.00 Other types 11.28 2.45−51.98 0.002 3.34 0.51−21.82 0.208 Lymph node metastasis True 1.00 False 0.88 0.44−1.77 0.719 Liver metastasis True 1.00 False 0.64 0.30−1.37 0.253 Pulmonary metastasis True 1.00 False 0.88 0.44−1.78 0.725 Peritoneal metastasis True 1.00 False 1.35 0.58−3.14 0.482 CA199 level Negative 1.00 1.00 Positive 2.95 1.18−7.35 0.020 3.34 1.12−10.22 0.031 TR 1.05 0.93−1.18 0.461 Table 4.
Univariate and multivariate analysis of factors influencing OS in patients in the AG regimen group.
-
Clinical features Univariate analysis Multivariate analysis HR 95% CI p HR 95% CI p Gender Male 1.00 Female 0.72 0.35−1.50 0.383 Age 1.00 0.96−1.04 0.941 BMI (kg/m2 ) 0.98 0.85−1.14 0.789 Hypertension True 1.00 False 0.79 0.38−1.64 0.521 ECOG score 0.97 0.47−2.00 0.934 Pathological type Adenocarcinoma 1.00 Other types 1.27 0.43−3.70 0.664 Lymph node metastasis True 1.00 False 0.98 0.48−1.99 0.950 Liver metastasis True 1.00 False 1.92 0.78−4.72 0.155 Pulmonary metastasis True 1.00 False 1.40 0.62−3.18 0.424 Peritoneal metastasis True 1.00 False 0.78 0.27−2.26 0.649 CA199 level Negative 1.00 1.00 Positive 2.31 0.93−5.77 0.073 2.39 0.94−6.06 0.067 TR 1.17 1.03−1.33 0.014 1.11 0.97−1.28 0.128 Table 5.
Univariate and multivariate analysis of factors influencing PFS in patients in the A + AG regimen group.
-
Clinical features Univariate analysis Multivariate analysis HR 95% CI p HR 95% CI p Gender Male 1.00 Female 1.34 0.55−3.25 0.521 Age 1.06 0.96−1.05 0.056 1.06 0.98−1.15 0.170 BMI (kg/m2 ) 1.07 0.88−1.31 0.475 Hypertension True 1.00 1.00 False 0.37 0.14−1.00 0.050 0.84 0.24−2.92 0.789 ECOG score 0.78 0.31−1.95 0.588 Pathological type Adenocarcinoma 1.00 Other types 1.38 0.39−4.89 0.614 Lymph node metastasis True 1.00 False 1.18 0.49−2.87 0.709 Liver metastasis True 1.00 False 0.56 0.18−1.75 0.321 Pulmonary metastasis True 1.00 False 0.86 0.35−2.10 0.735 Peritoneal metastasis True 1.00 False 1.48 0.34−6.47 0.605 CA199 level Negative 1.00 Positive 1.83 0.67−5.05 0.242 TR 1.18 1.01−1.38 0.035 1.07 0.88−1.31 0.496 Table 6.
Univariate and multivariate analysis of factors influencing OS in patients in the A + AG regimen group.
-
Grade III adverse reactions Grade III/IV adverse reactions Group A + AG Group AG p value Group A + AG Group AG p value Leucopenia 17 (53.2%) 23 (58.9%) 0.800 13 (40.6%) 12 (30.8%) 0.387 Decreased hemoglobin 17 (53.1%) 16 (41.1%) 0.437 4 (12.5%) 7 (17.9%) 0.763 Thrombocytopenia 15 (46.9%) 21 (53.9%) 0.729 11 (34.4%) 8 (20.5%) 0.189 Hypoalbuminemia 13 (40.6%) 20 (51.3%) 0.511 8 (25.0%) 7 (17.9%) 0.469 Diarrhea 19 (59.3%) 18 (46.1%) 0.384 2 (6.3%) 1 (2.6%) 0.585 Pleural and abdominal fluid 8 (25.0%) 3 (7.7%) 0.094 3 (9.4%) 5 (12.8%) 0.936 Nausea and vomiting 18 (56.2%) 26 (66.7%) 0.513 7 (21.9%) 6 (15.4%) 0.482 Fatigue and poor appetite 24 (75.0%) 29 (74.4%) 1.000 5 (15.6%) 3 (7.7%) 0.500 Hepatic dysfunction 11 (34.4%) 13 (33.3%) 1.000 9 (28.1%) 4 (10.3%) 0.053 Hemorrhage 3 (9.4%) 1 (2.6%) 0.471 1 (3.1%) 0 0.921 Hypertension 8 (25.0%) 5 (12.8%) 0.312 14 (43.8%) 11 (28.2%) 0.172 Hand-foot syndrome 6 (18.7%) 5 (12.8%) 0.153 2 (6.3%) 0 0.200 Hyperlipidemia 10 (31.2%) 10 (25.6%) 0.797 6 (18.8%) 3 (7.7%) 0.301 Proteinuria 16 (50.0%) 17 (43.6%) 0.764 4 (12.5%) 2 (5.1%) 0.399 Table 7.
Comparison of adverse reactions between the two groups.
Figures
(1)
Tables
(7)