-
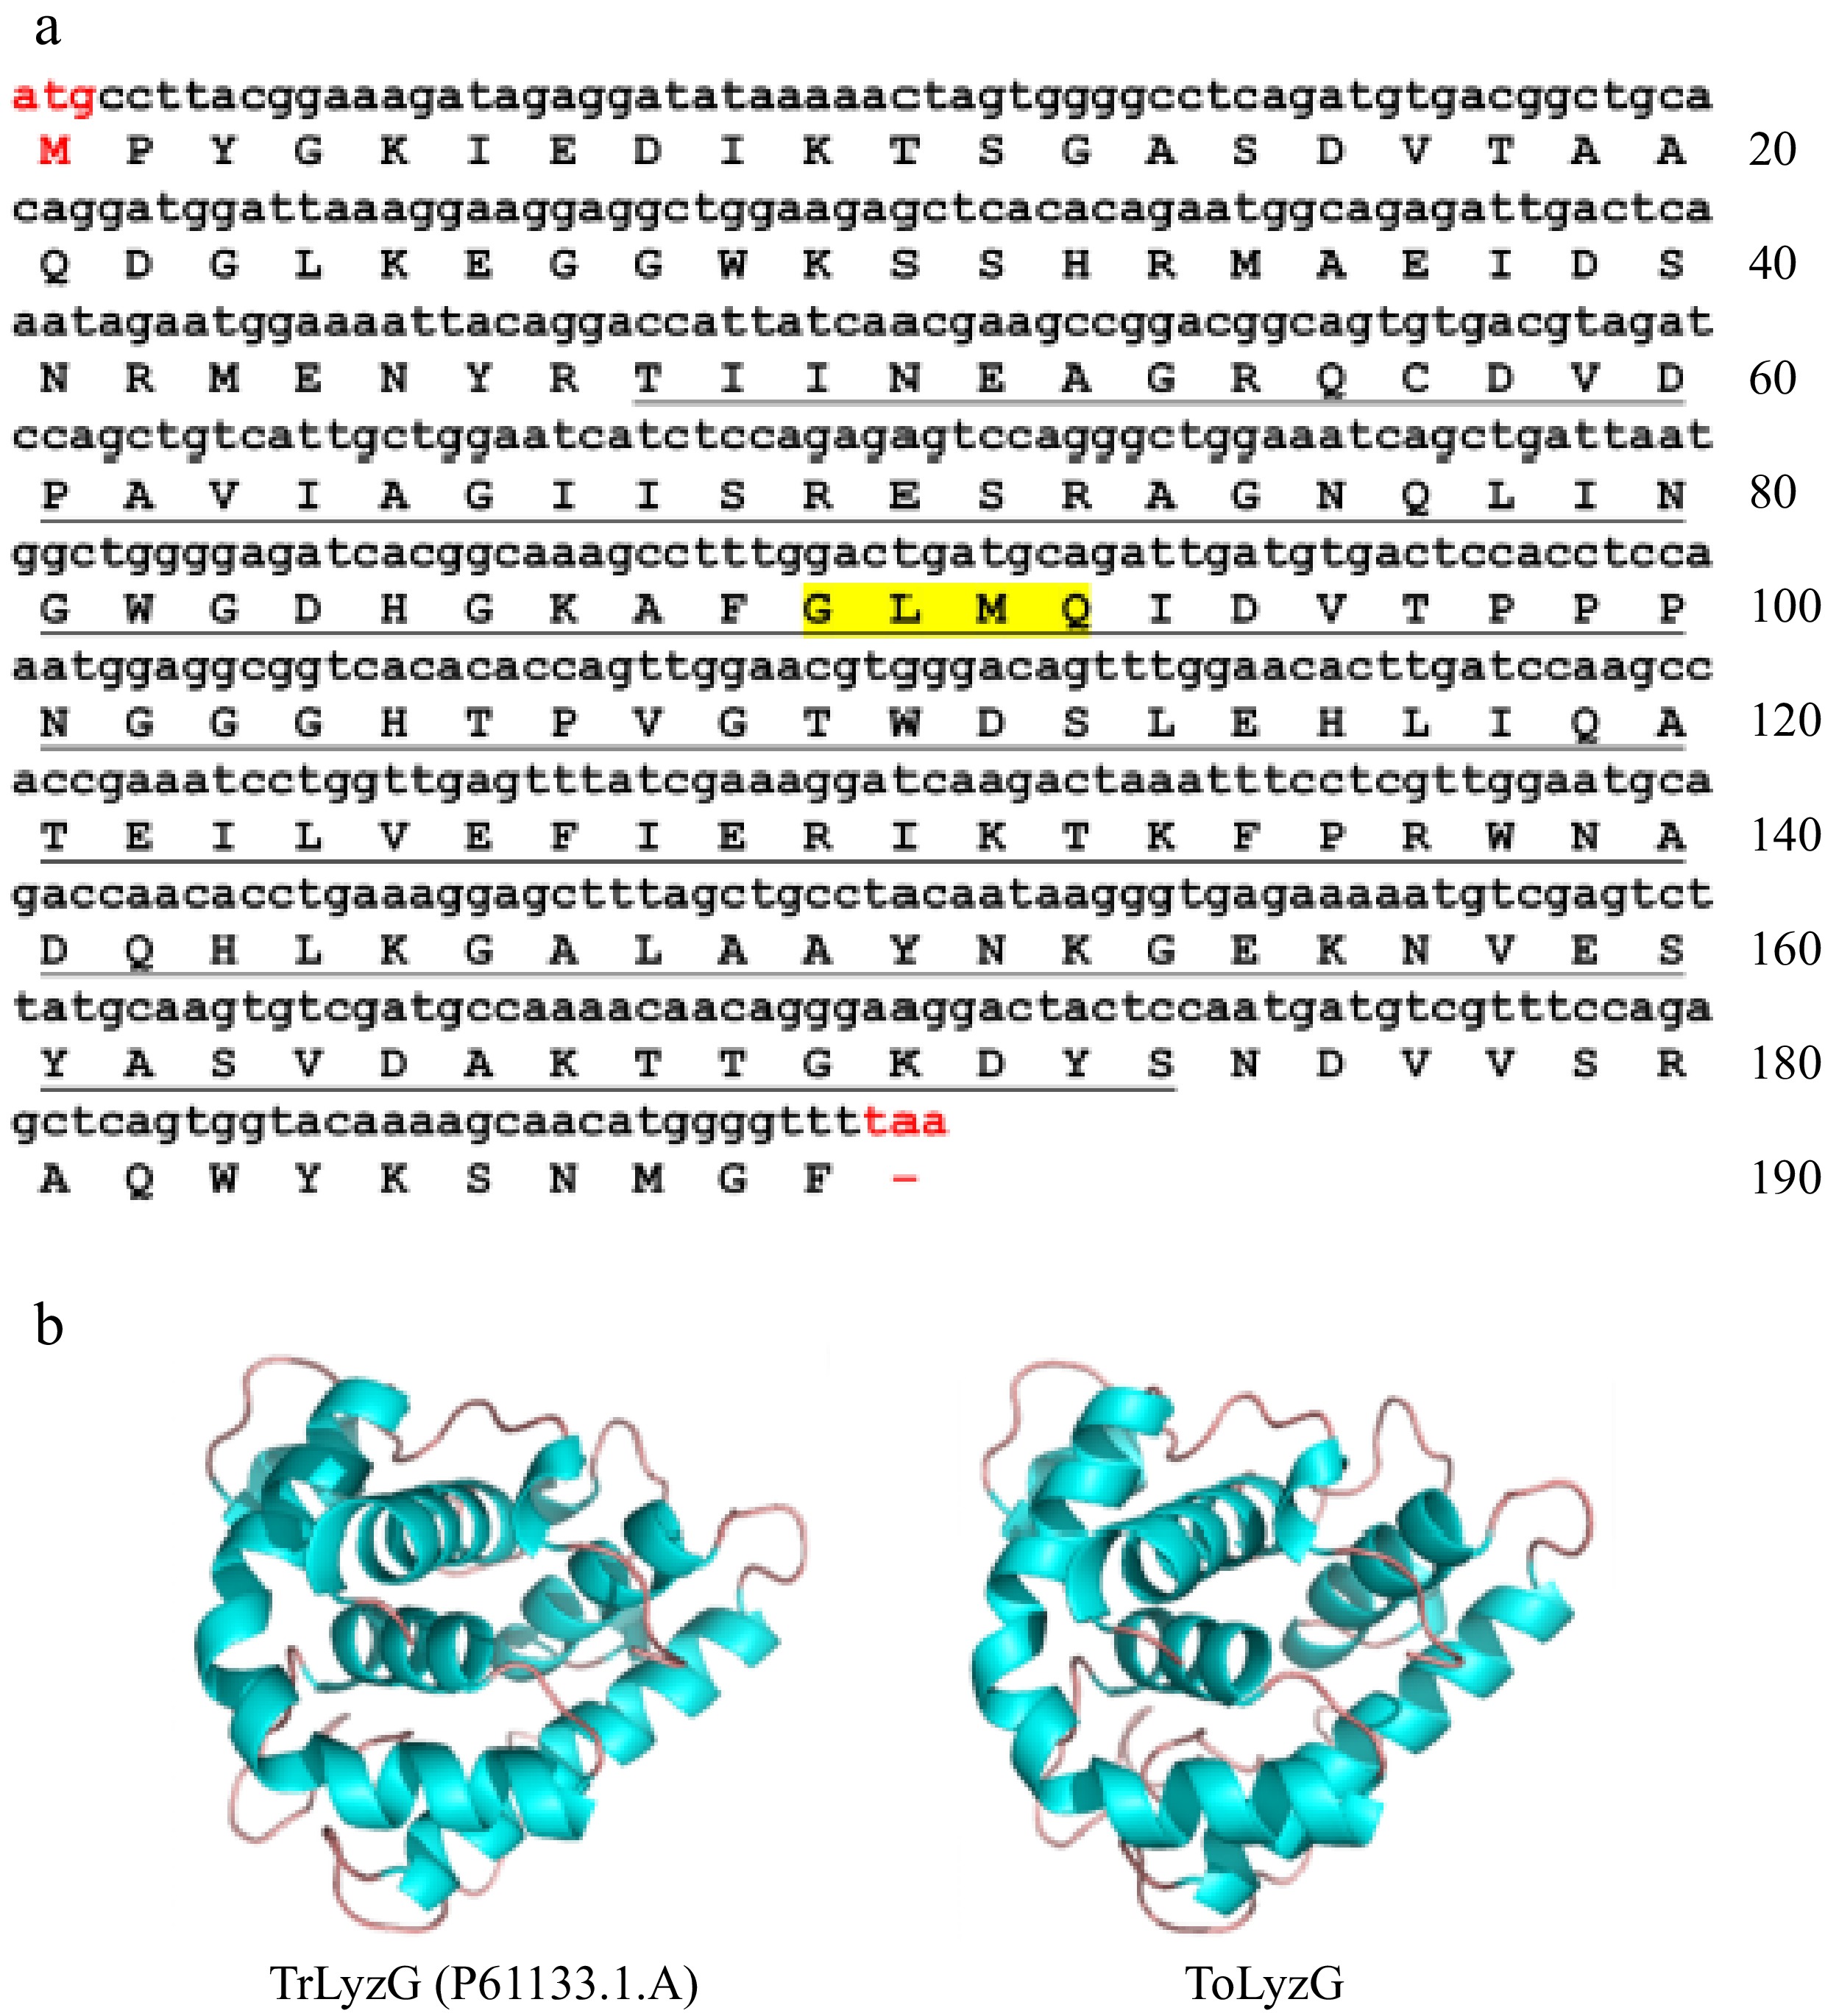
Figure 1.
Bioinformatics analysis of ToLyzG. (a) Nucleotide and amino acid sequence of ToLyzG from T. obscurus. The numbers on the right indicate the total number of amino acids in each line, with the start codon (ATG) and stop codon (TAA) highlighted in red. The predicted SLT domain is underlined, and the GLMQ motif is shaded in yellow. (b) 3D structure prediction of ToLyzG. The blue spirals depict the helical regions, while the brown lines signify the coiled regions.
-
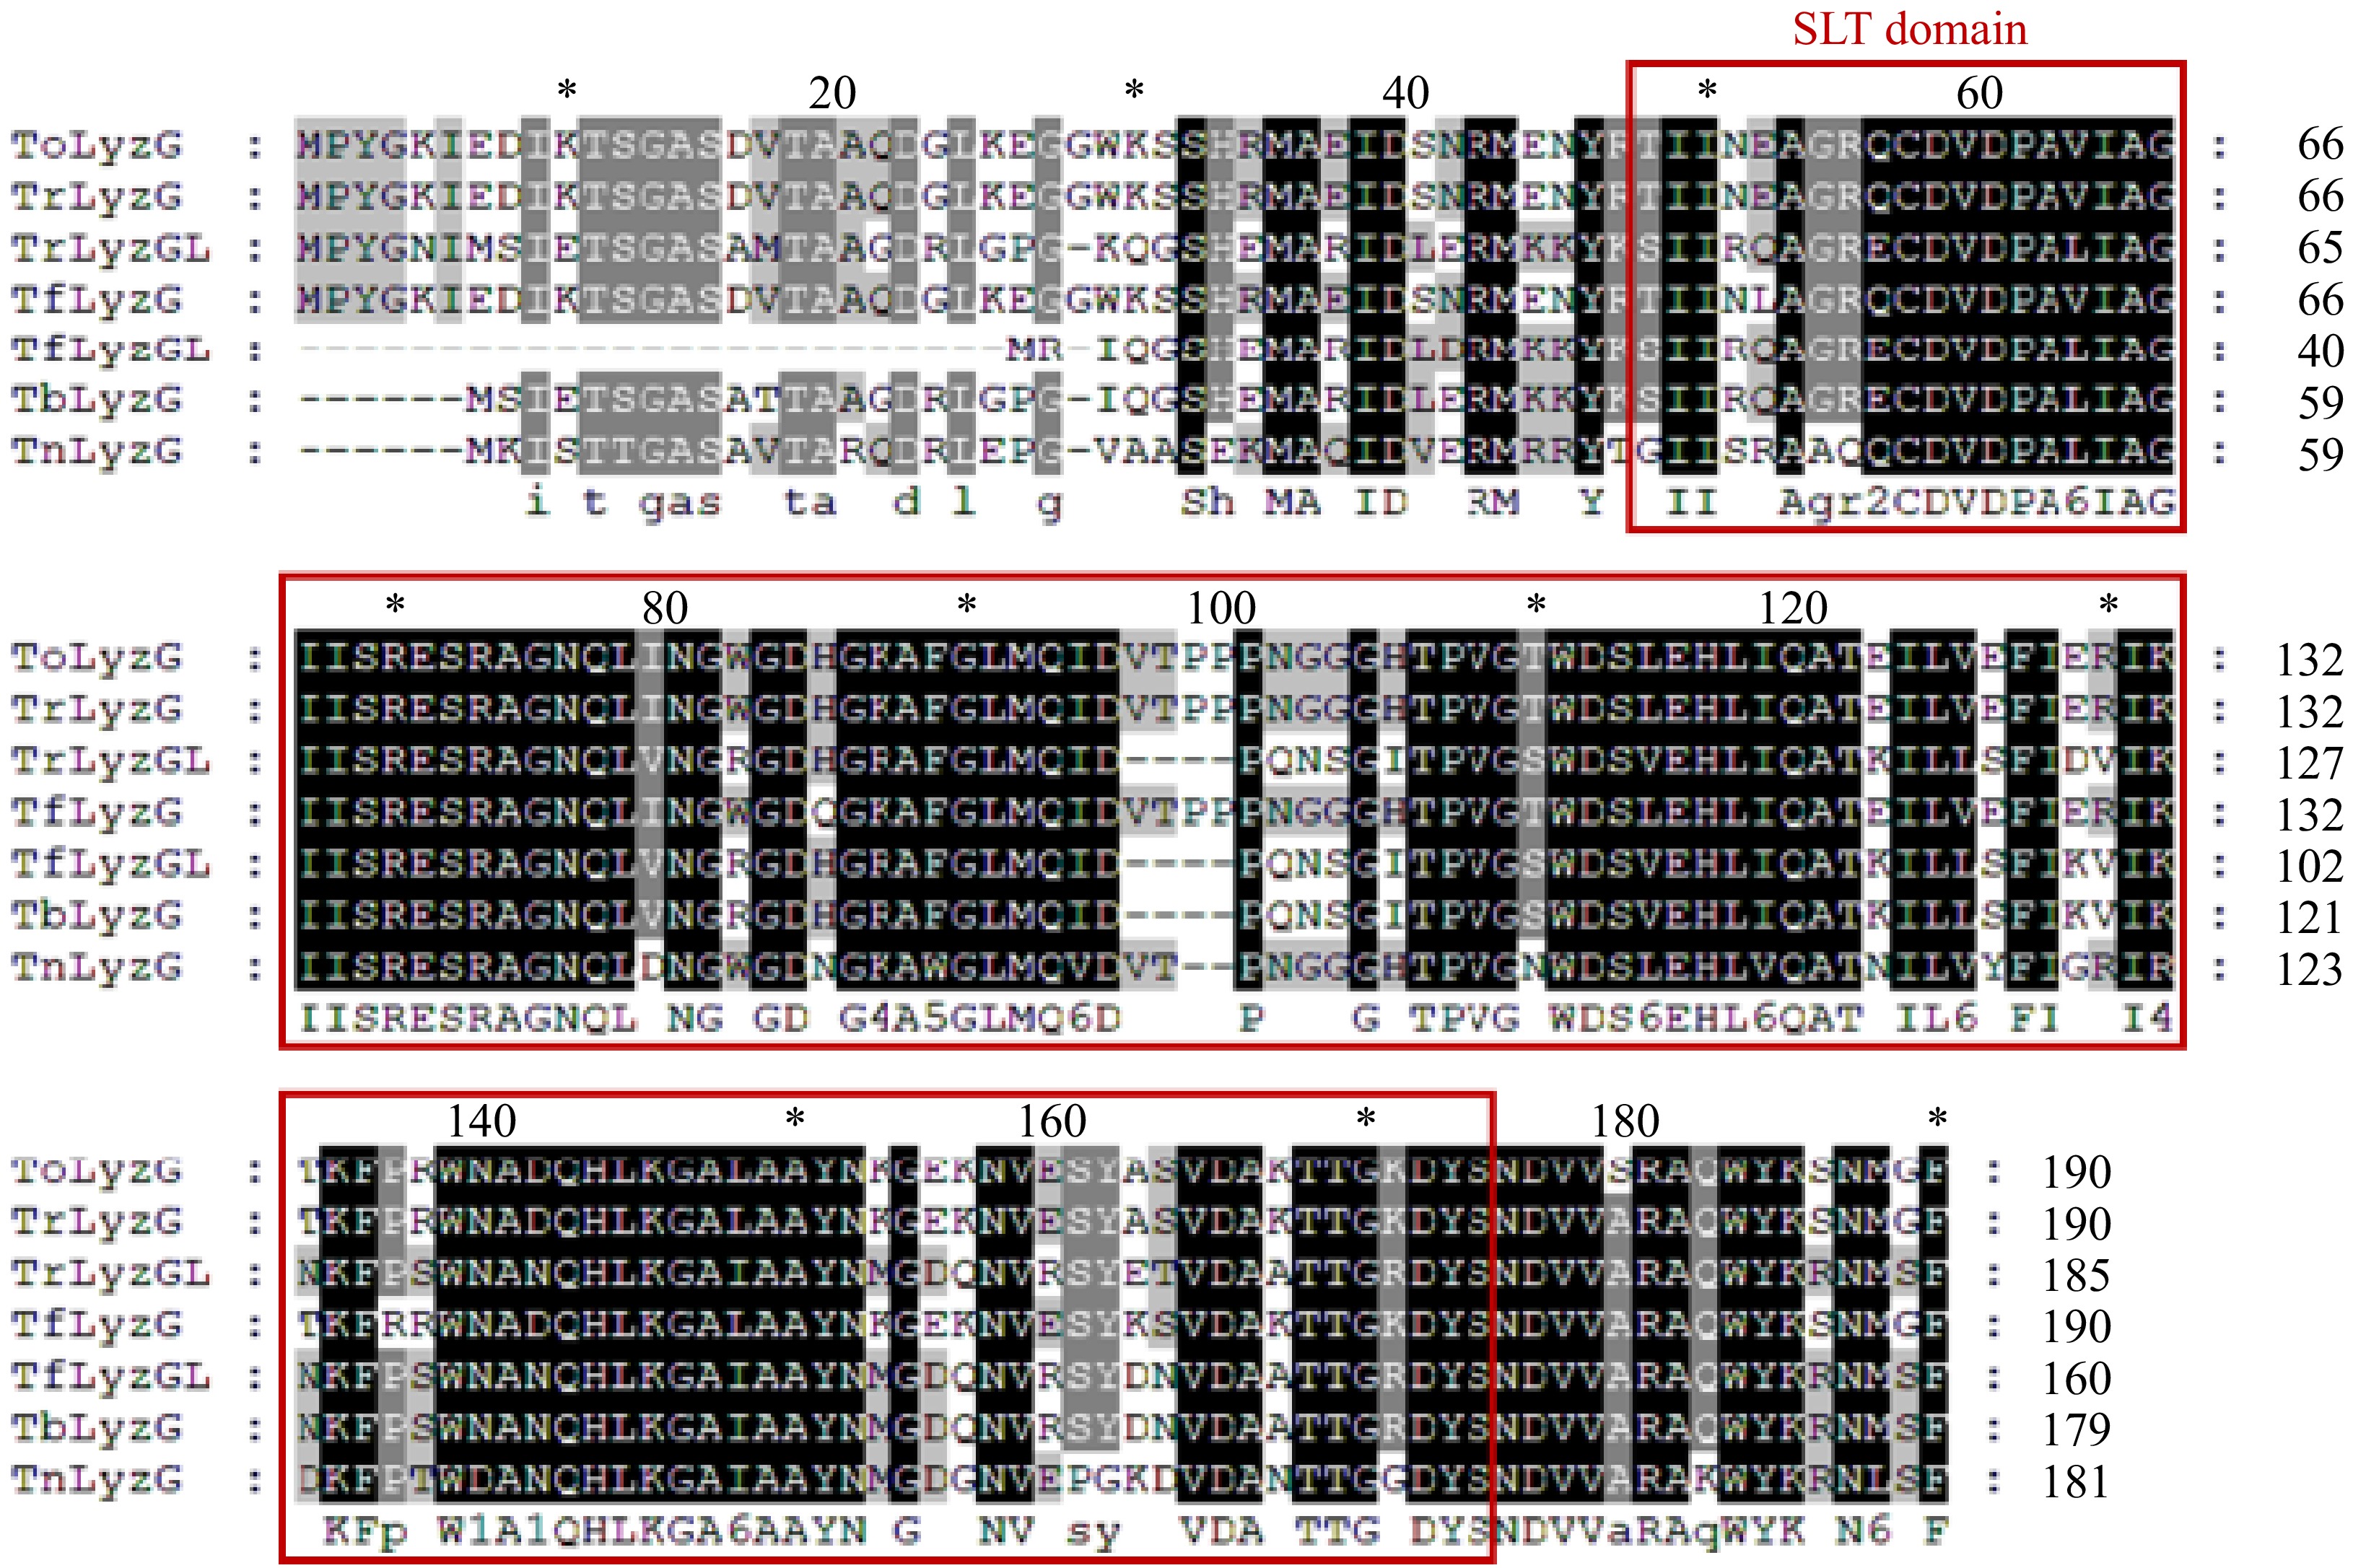
Figure 2.
Comparison of the amino acid sequences of ToLyzG with known g-type lysozymes in pufferfish. The red boxes represent the SLT domains.
-
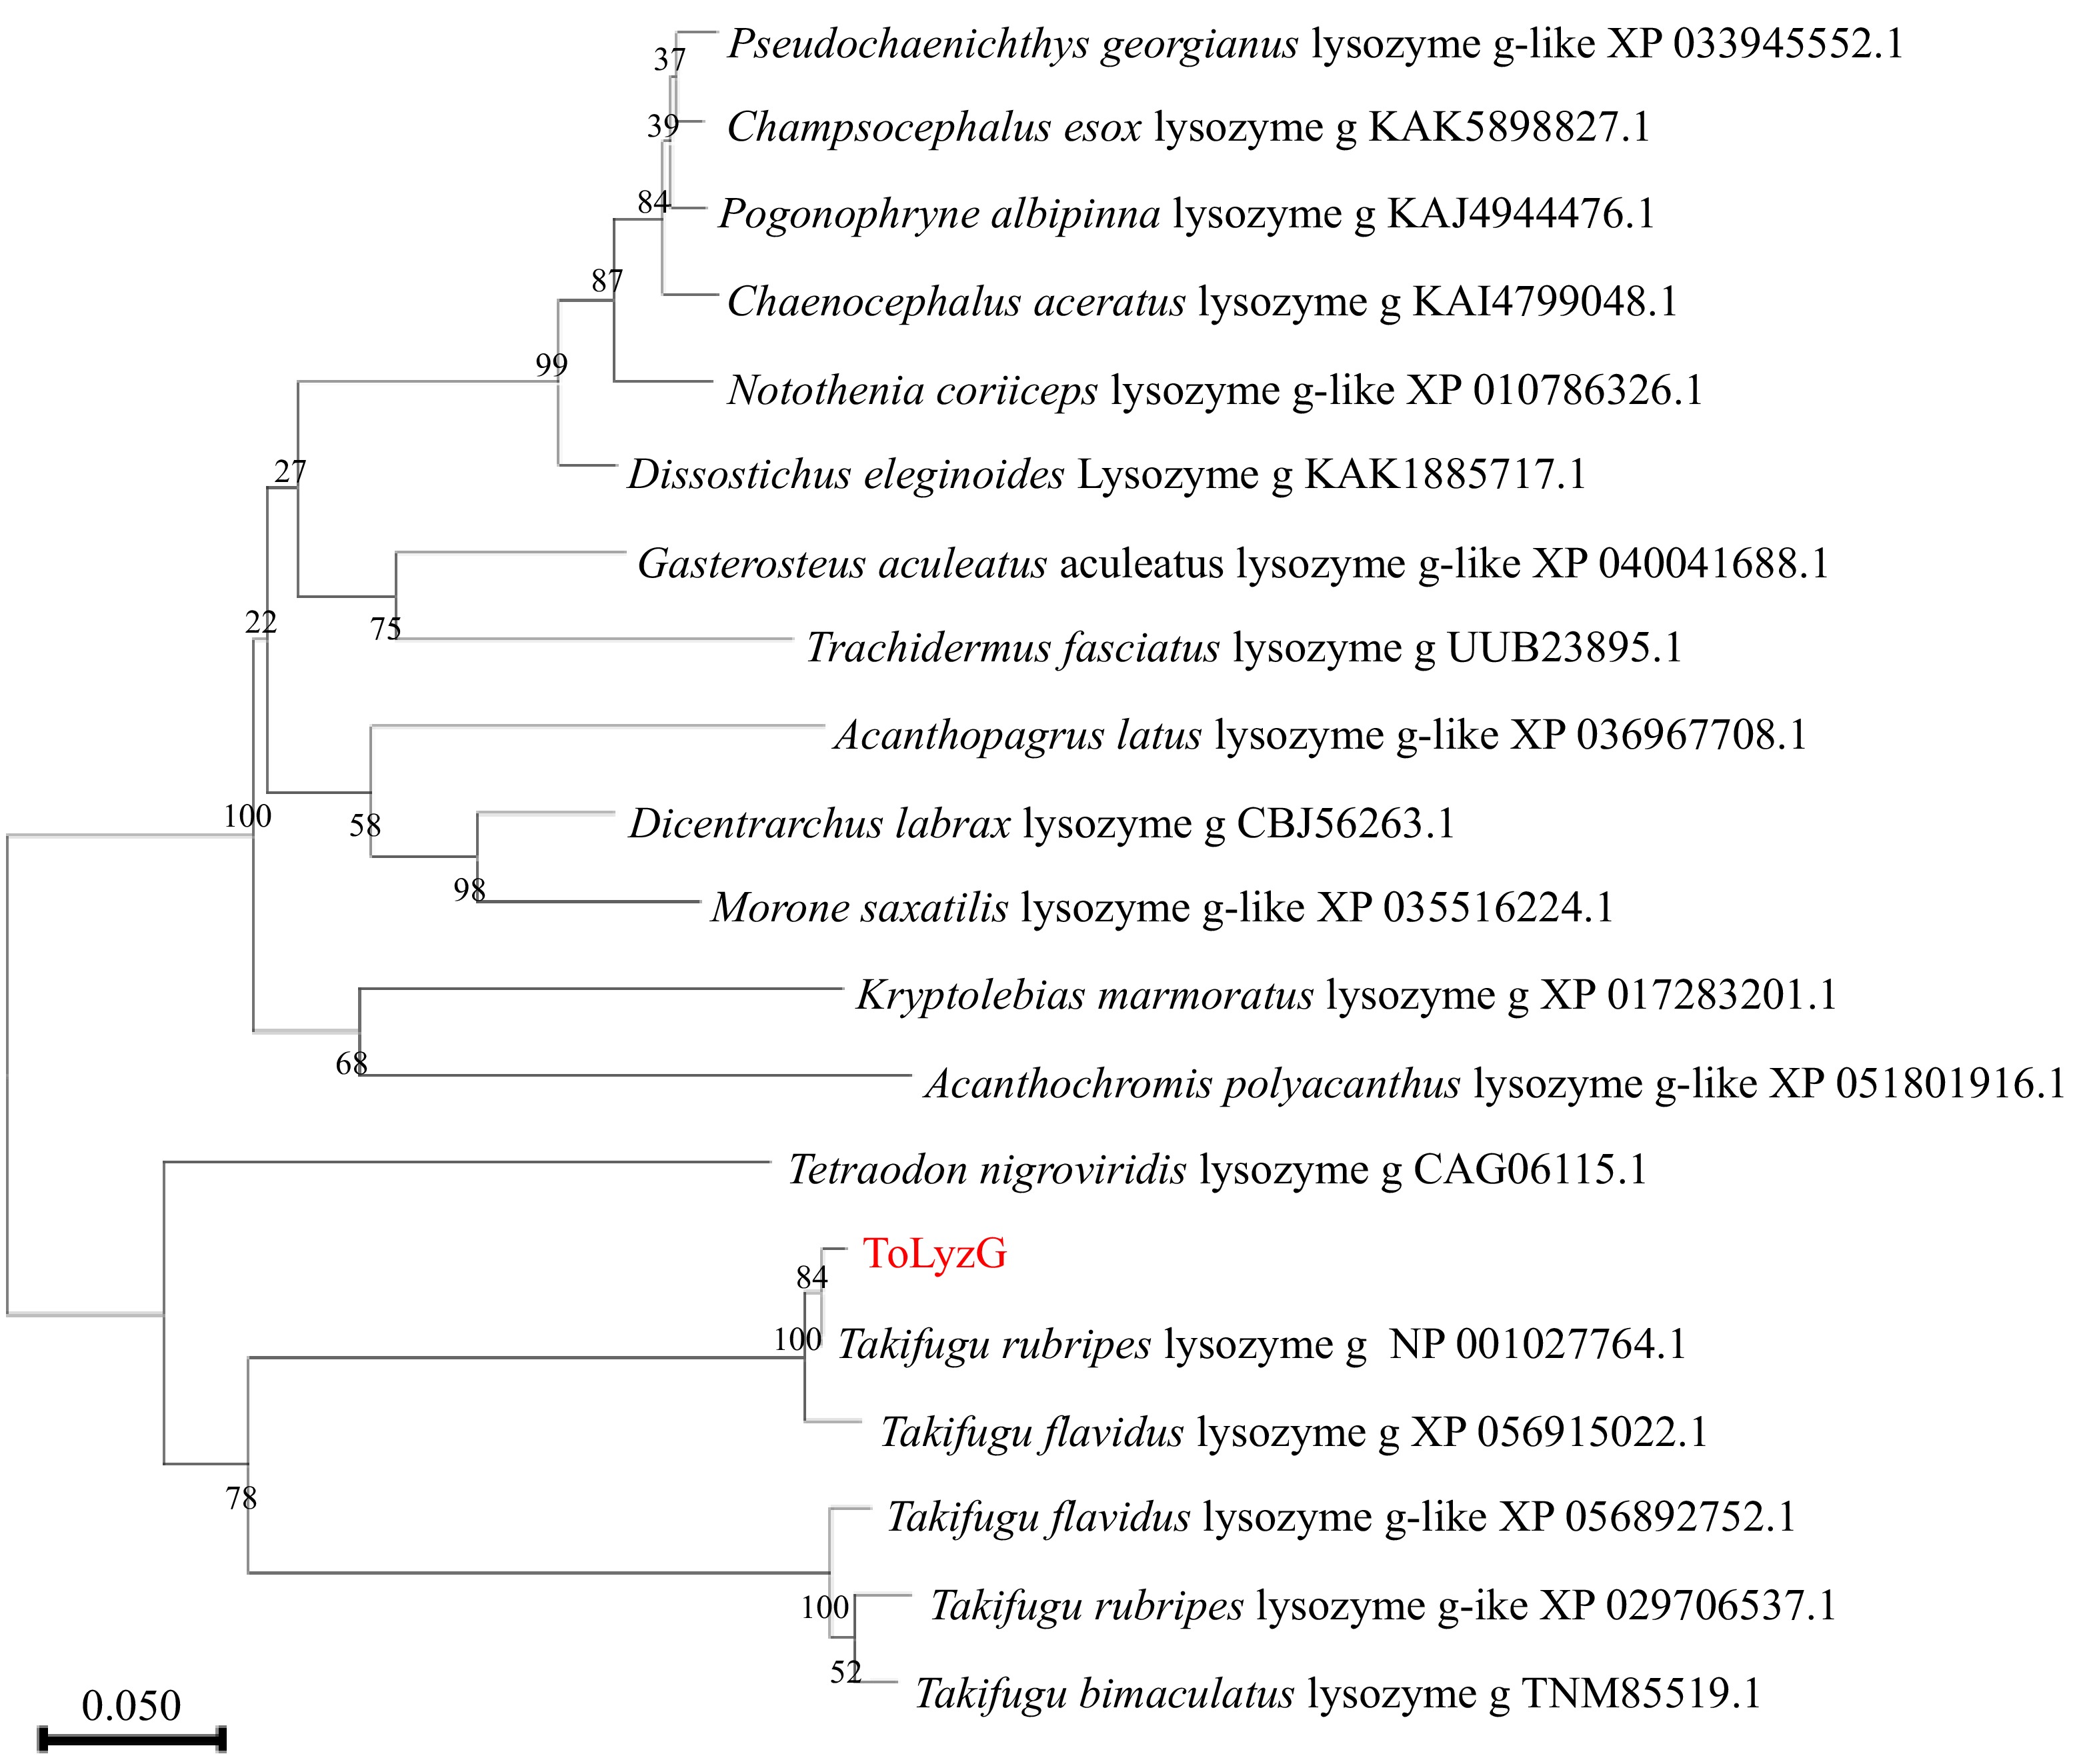
Figure 3.
Phylogenetic tree of g-type lysozymes from different organisms. The evolutionary history of the analyzed taxa was represented by a bootstrap consensus tree inferred from 1000 replicates. The bootstrap values are indicated at the branch points (forks) of the tree. Follow the branches, the species names, and their corresponding accession numbers are provided.
-
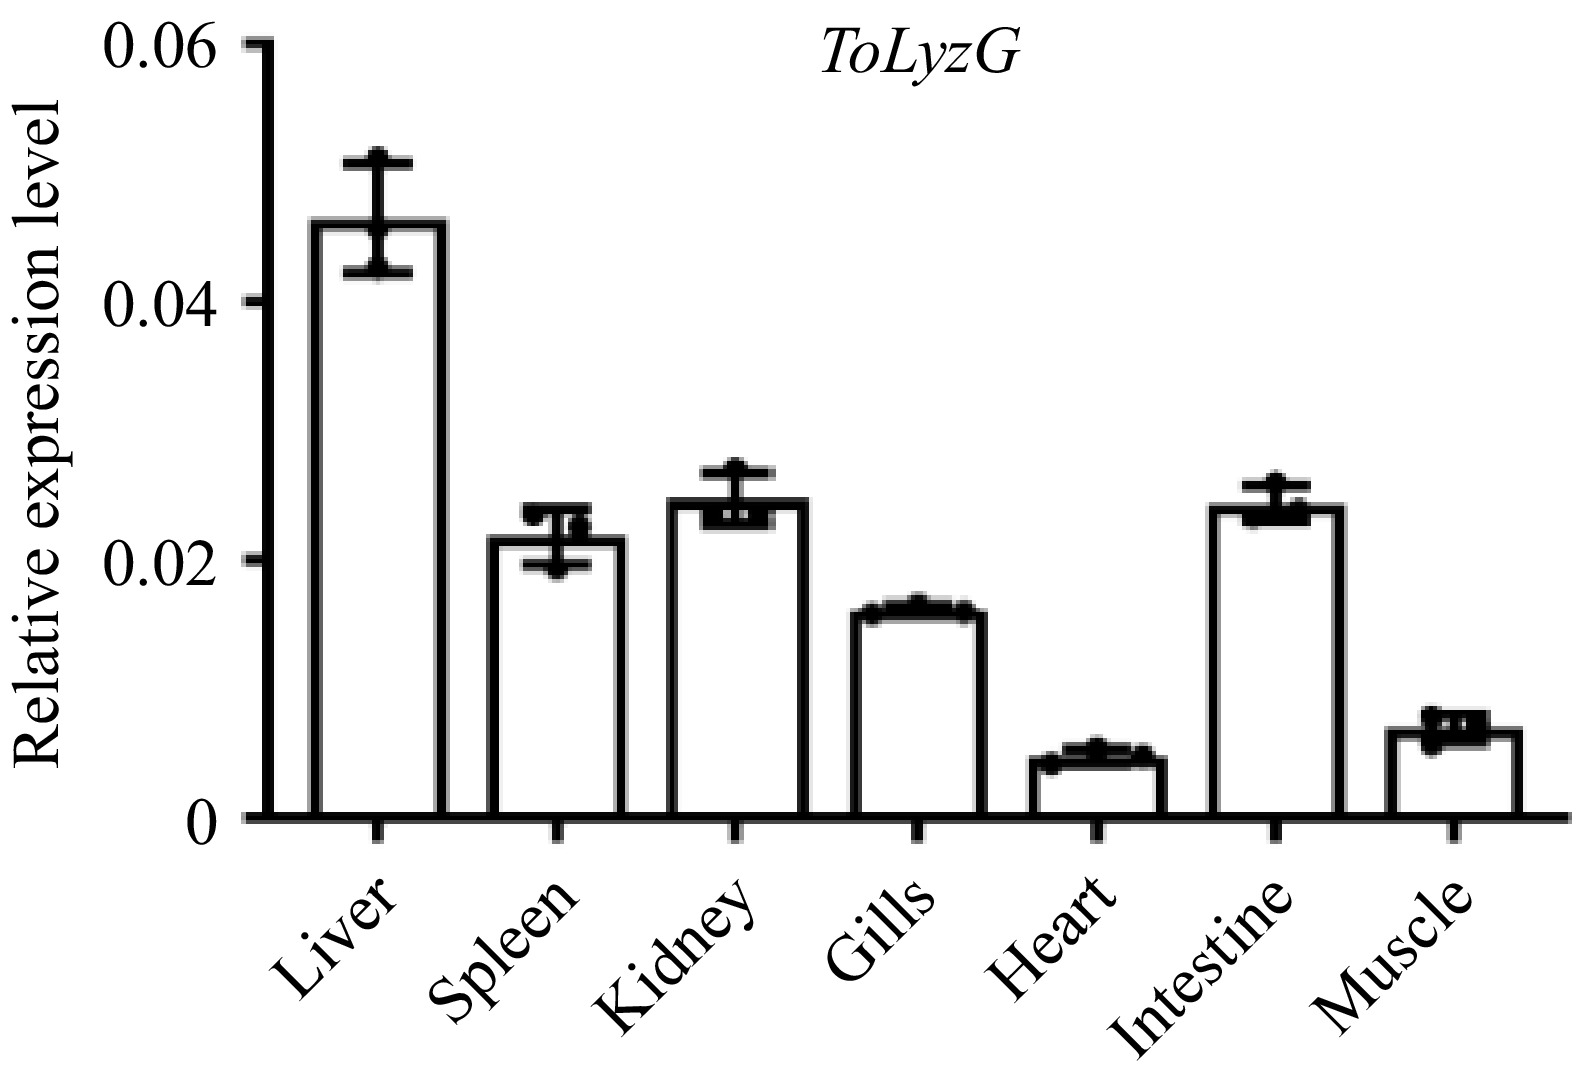
Figure 4.
Tissue distribution of ToLyzG. The expression of ToLyzG gene in six tissue samples of T. obscurus was quantified using RT-qPCR. β-actin served as the internal reference gene for normalization. Data are presented as the mean ± SD (n = 3).
-
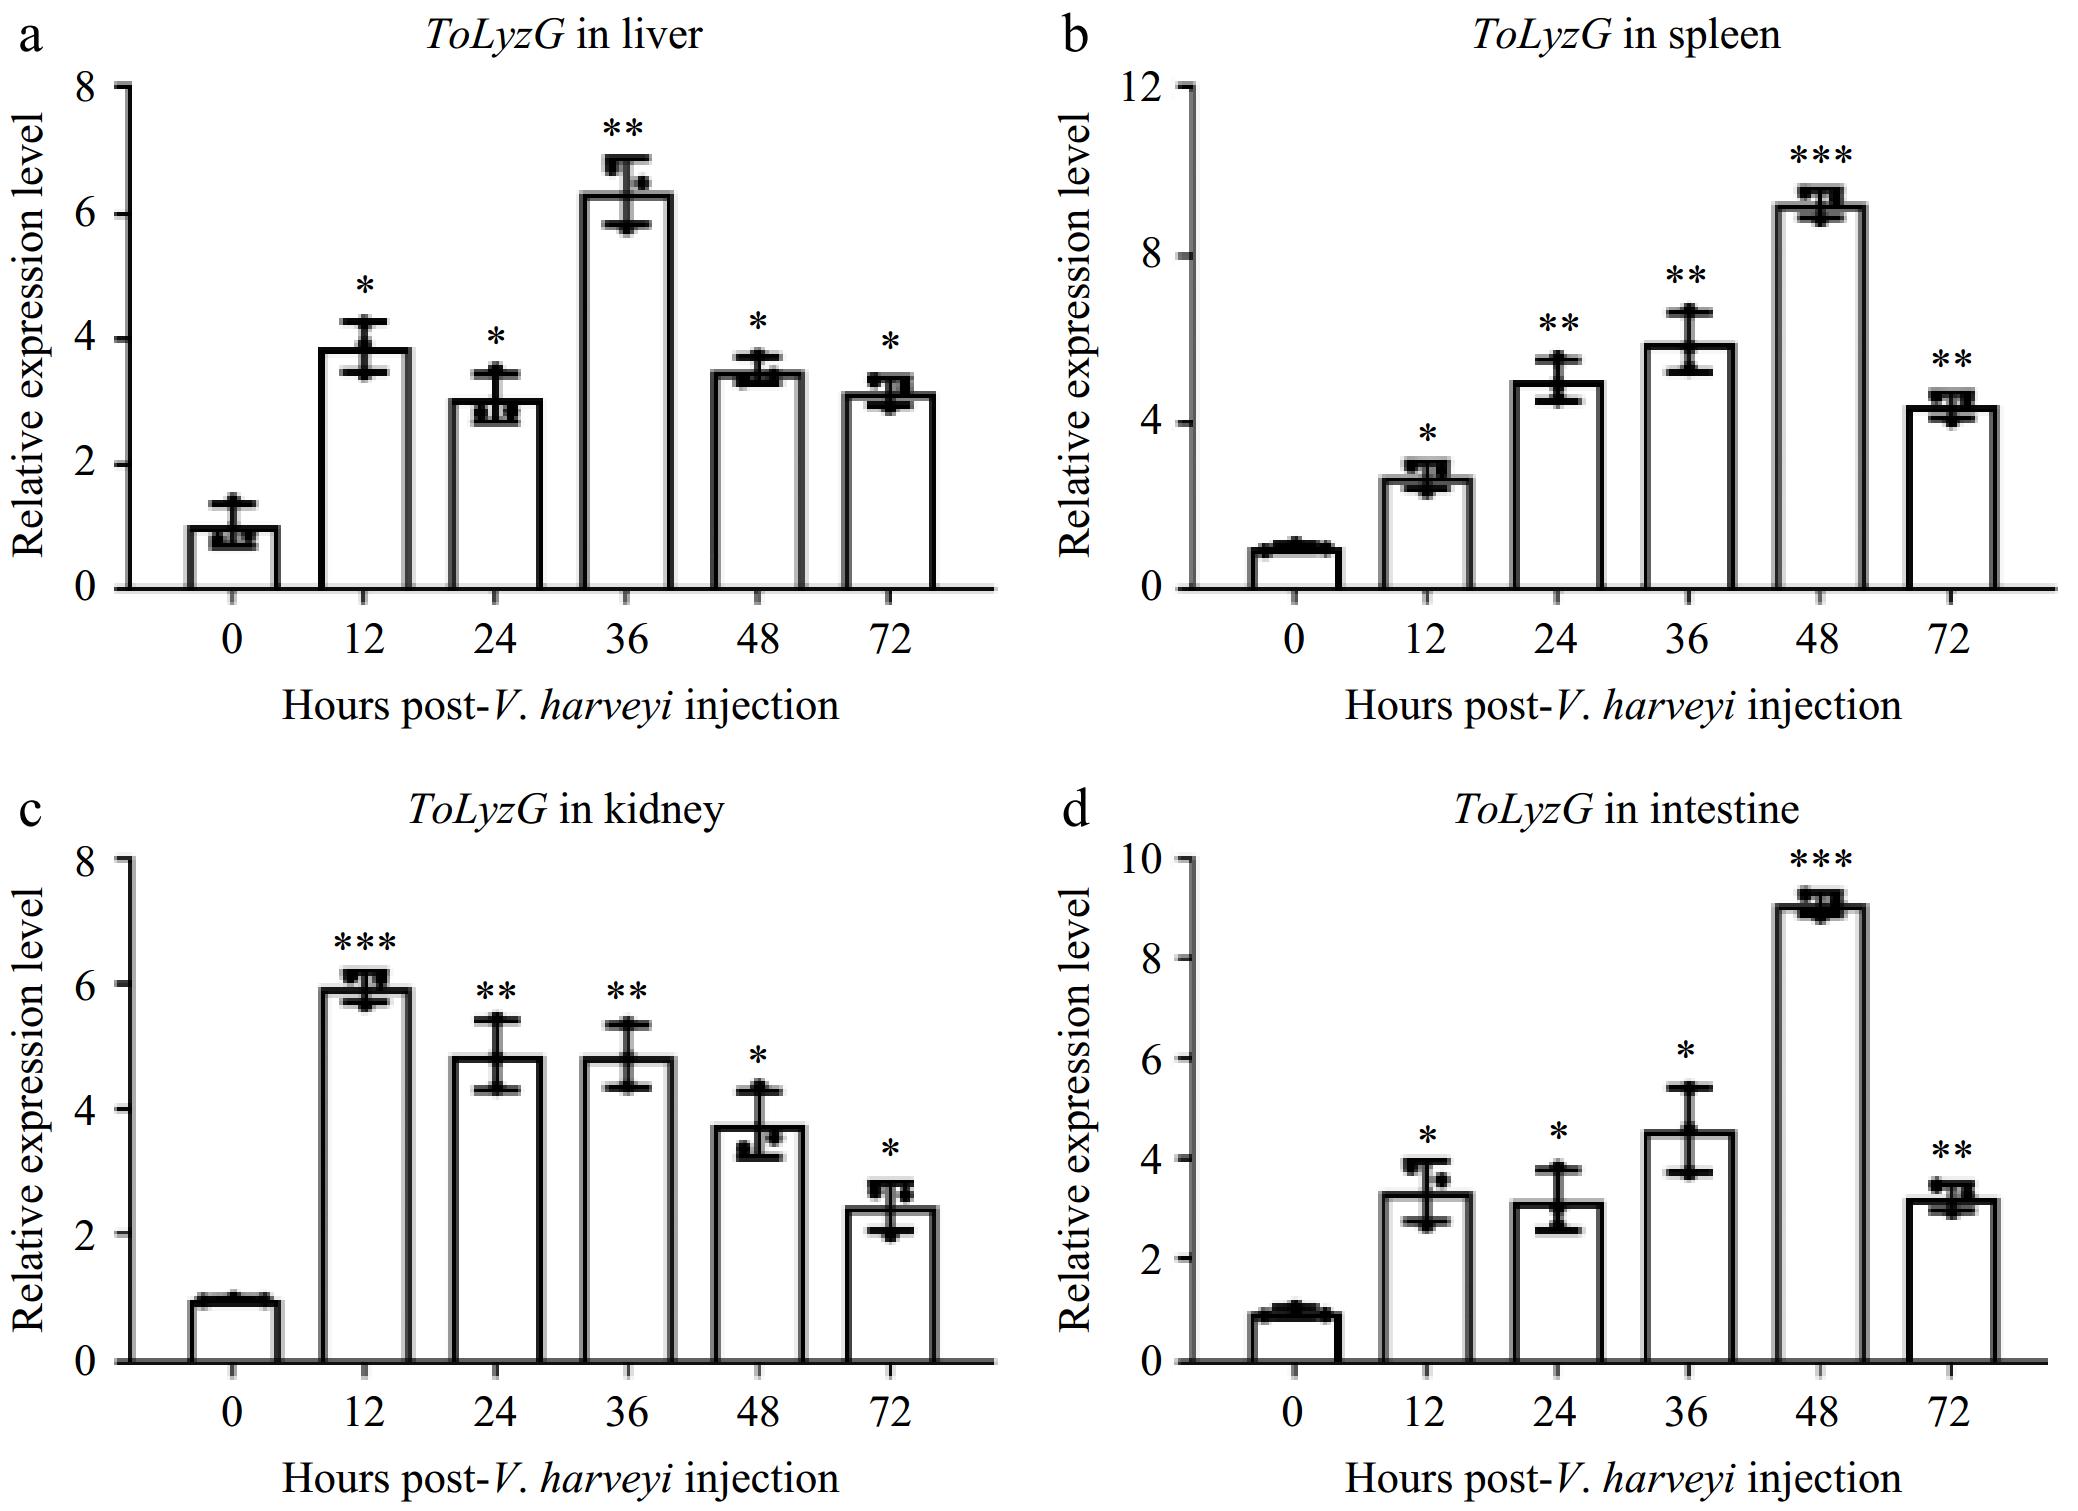
Figure 5.
ToLyzG mRNA expression after V. harveyi challenge. Different time courses of ToLyzG expression in the (a) liver, (b) spleen, (c) kidney, and (d) intestine at 0, 12, 24, 36, 48, and 72 h post-injection with V. harveyi was analyzed by RT-qPCR. Data are shown as an average of three independent replicates ± SD. Significant differences are indicated by asterisks, * p < 0.05, ** p < 0.01, *** p < 0.001.
-
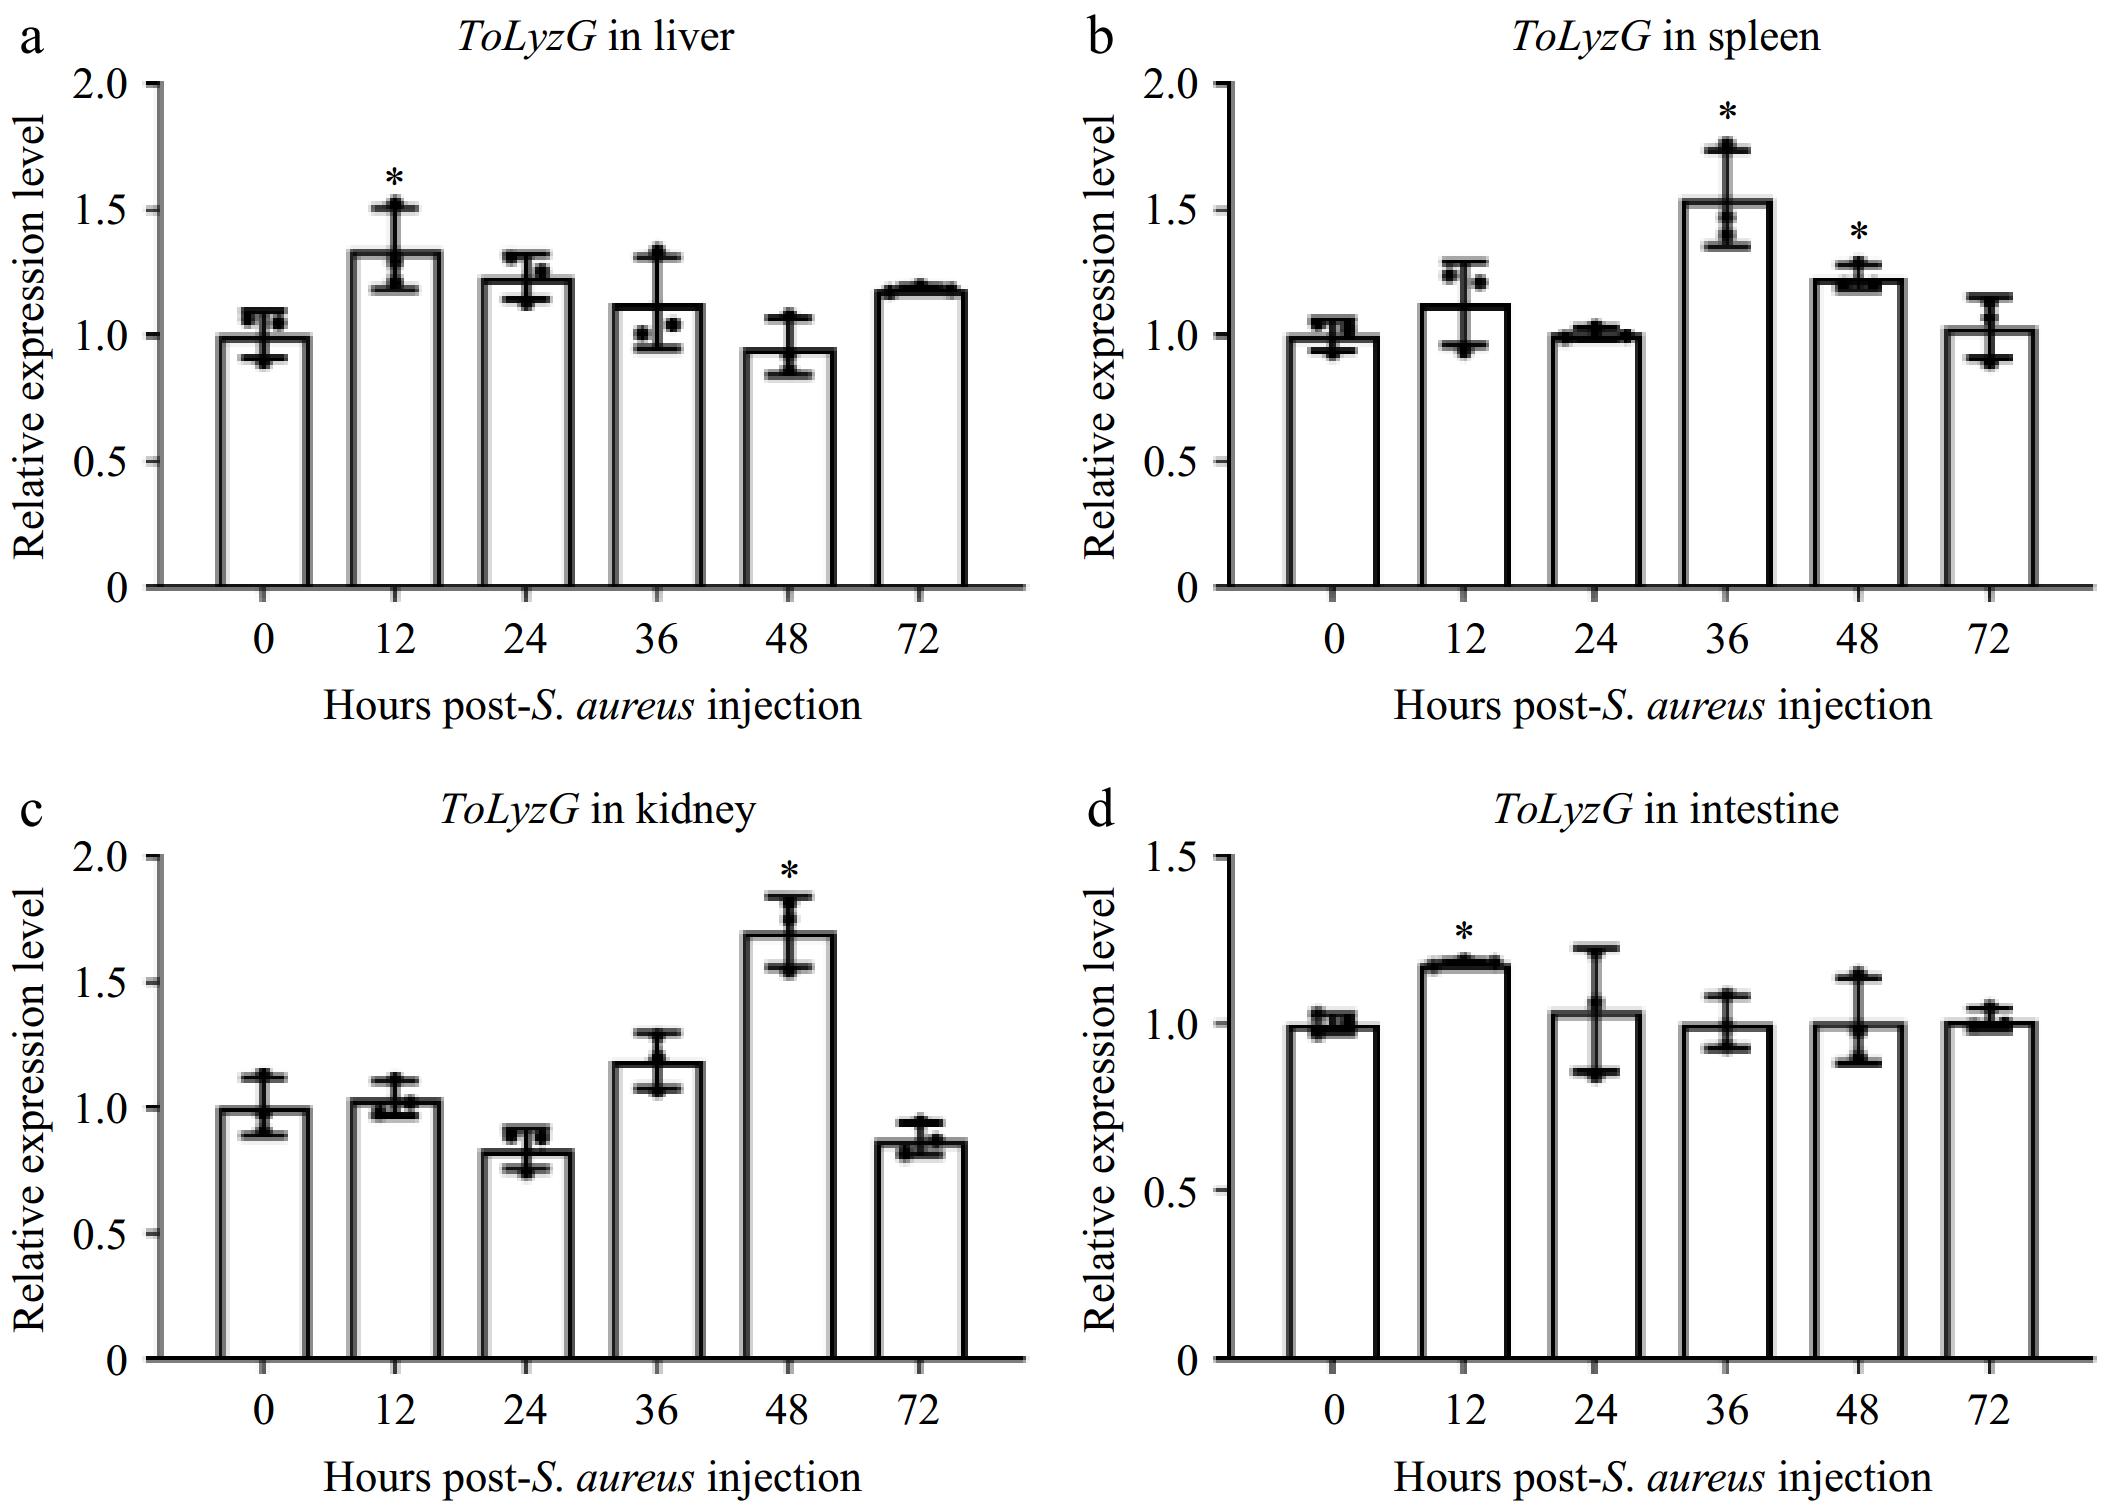
Figure 6.
ToLyzG mRNA expression after S. aureus challenge. Different time course of ToLyzG expression in the (a) liver, (b) spleen, (c) kidney, and (d) intestine at 0, 12, 24, 36, 48, and 72 h post-injection with S. aureus was analyzed by RT-qPCR. Data are represented as the mean ± SD (n = 3). Significant differences are indicated by asterisks, * p < 0.05.
-
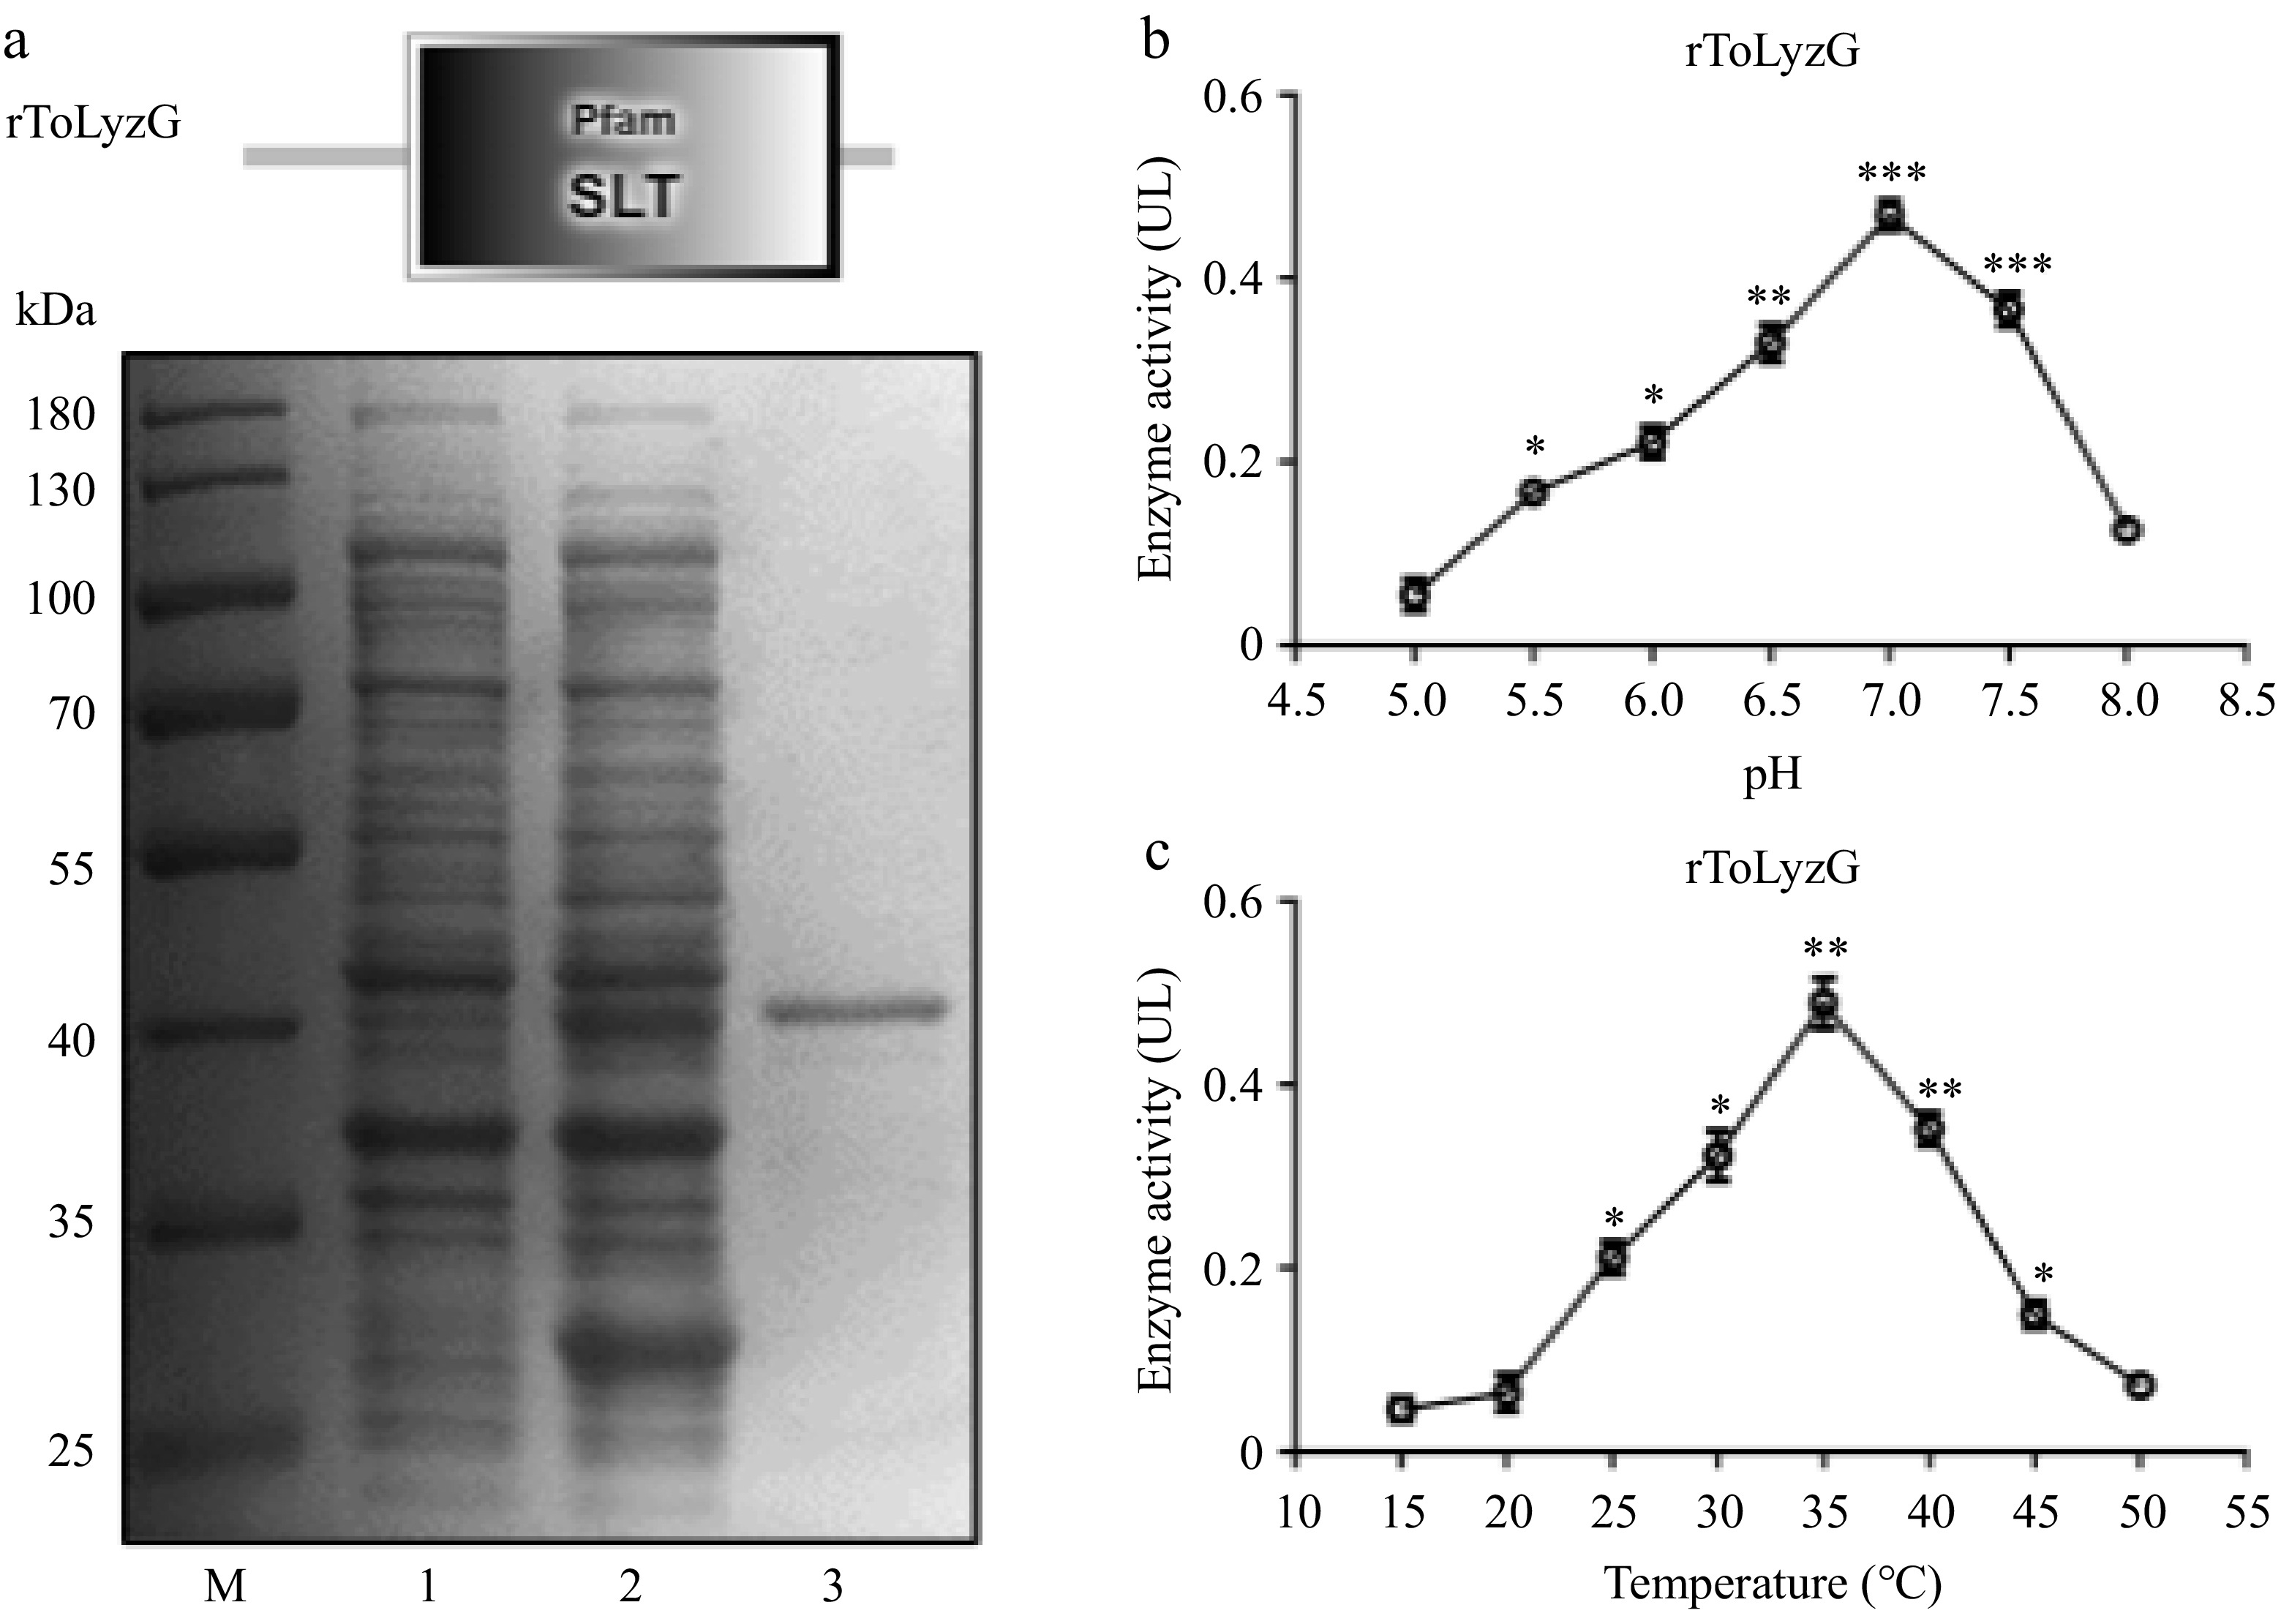
Figure 7.
Prokaryotic recombinant expression and purification of ToLyzG. (a) SDS-PAGE analysis of rToLyzG in E. coli BL21 (DE3). Lane M: protein molecular standard; lane 1: pET-32a-ToLyzG in BL21 (DE3), not induced with IPTG; lane 2: pET-32a-ToLyzG in BL21 (DE3), IPTG-induced for 5 h; lane 3: purified rToLyzG. Lytic activity of rToLyzG at various (b) pH and (c) temperatures measured by turbidimetric assay. Lytic activities are expressed as mean UL. Data are presented as the mean ± SD (n = 3). Significant differences are shown with asterisks, * p < 0.05, ** p < 0.01, *** p < 0.001.
-
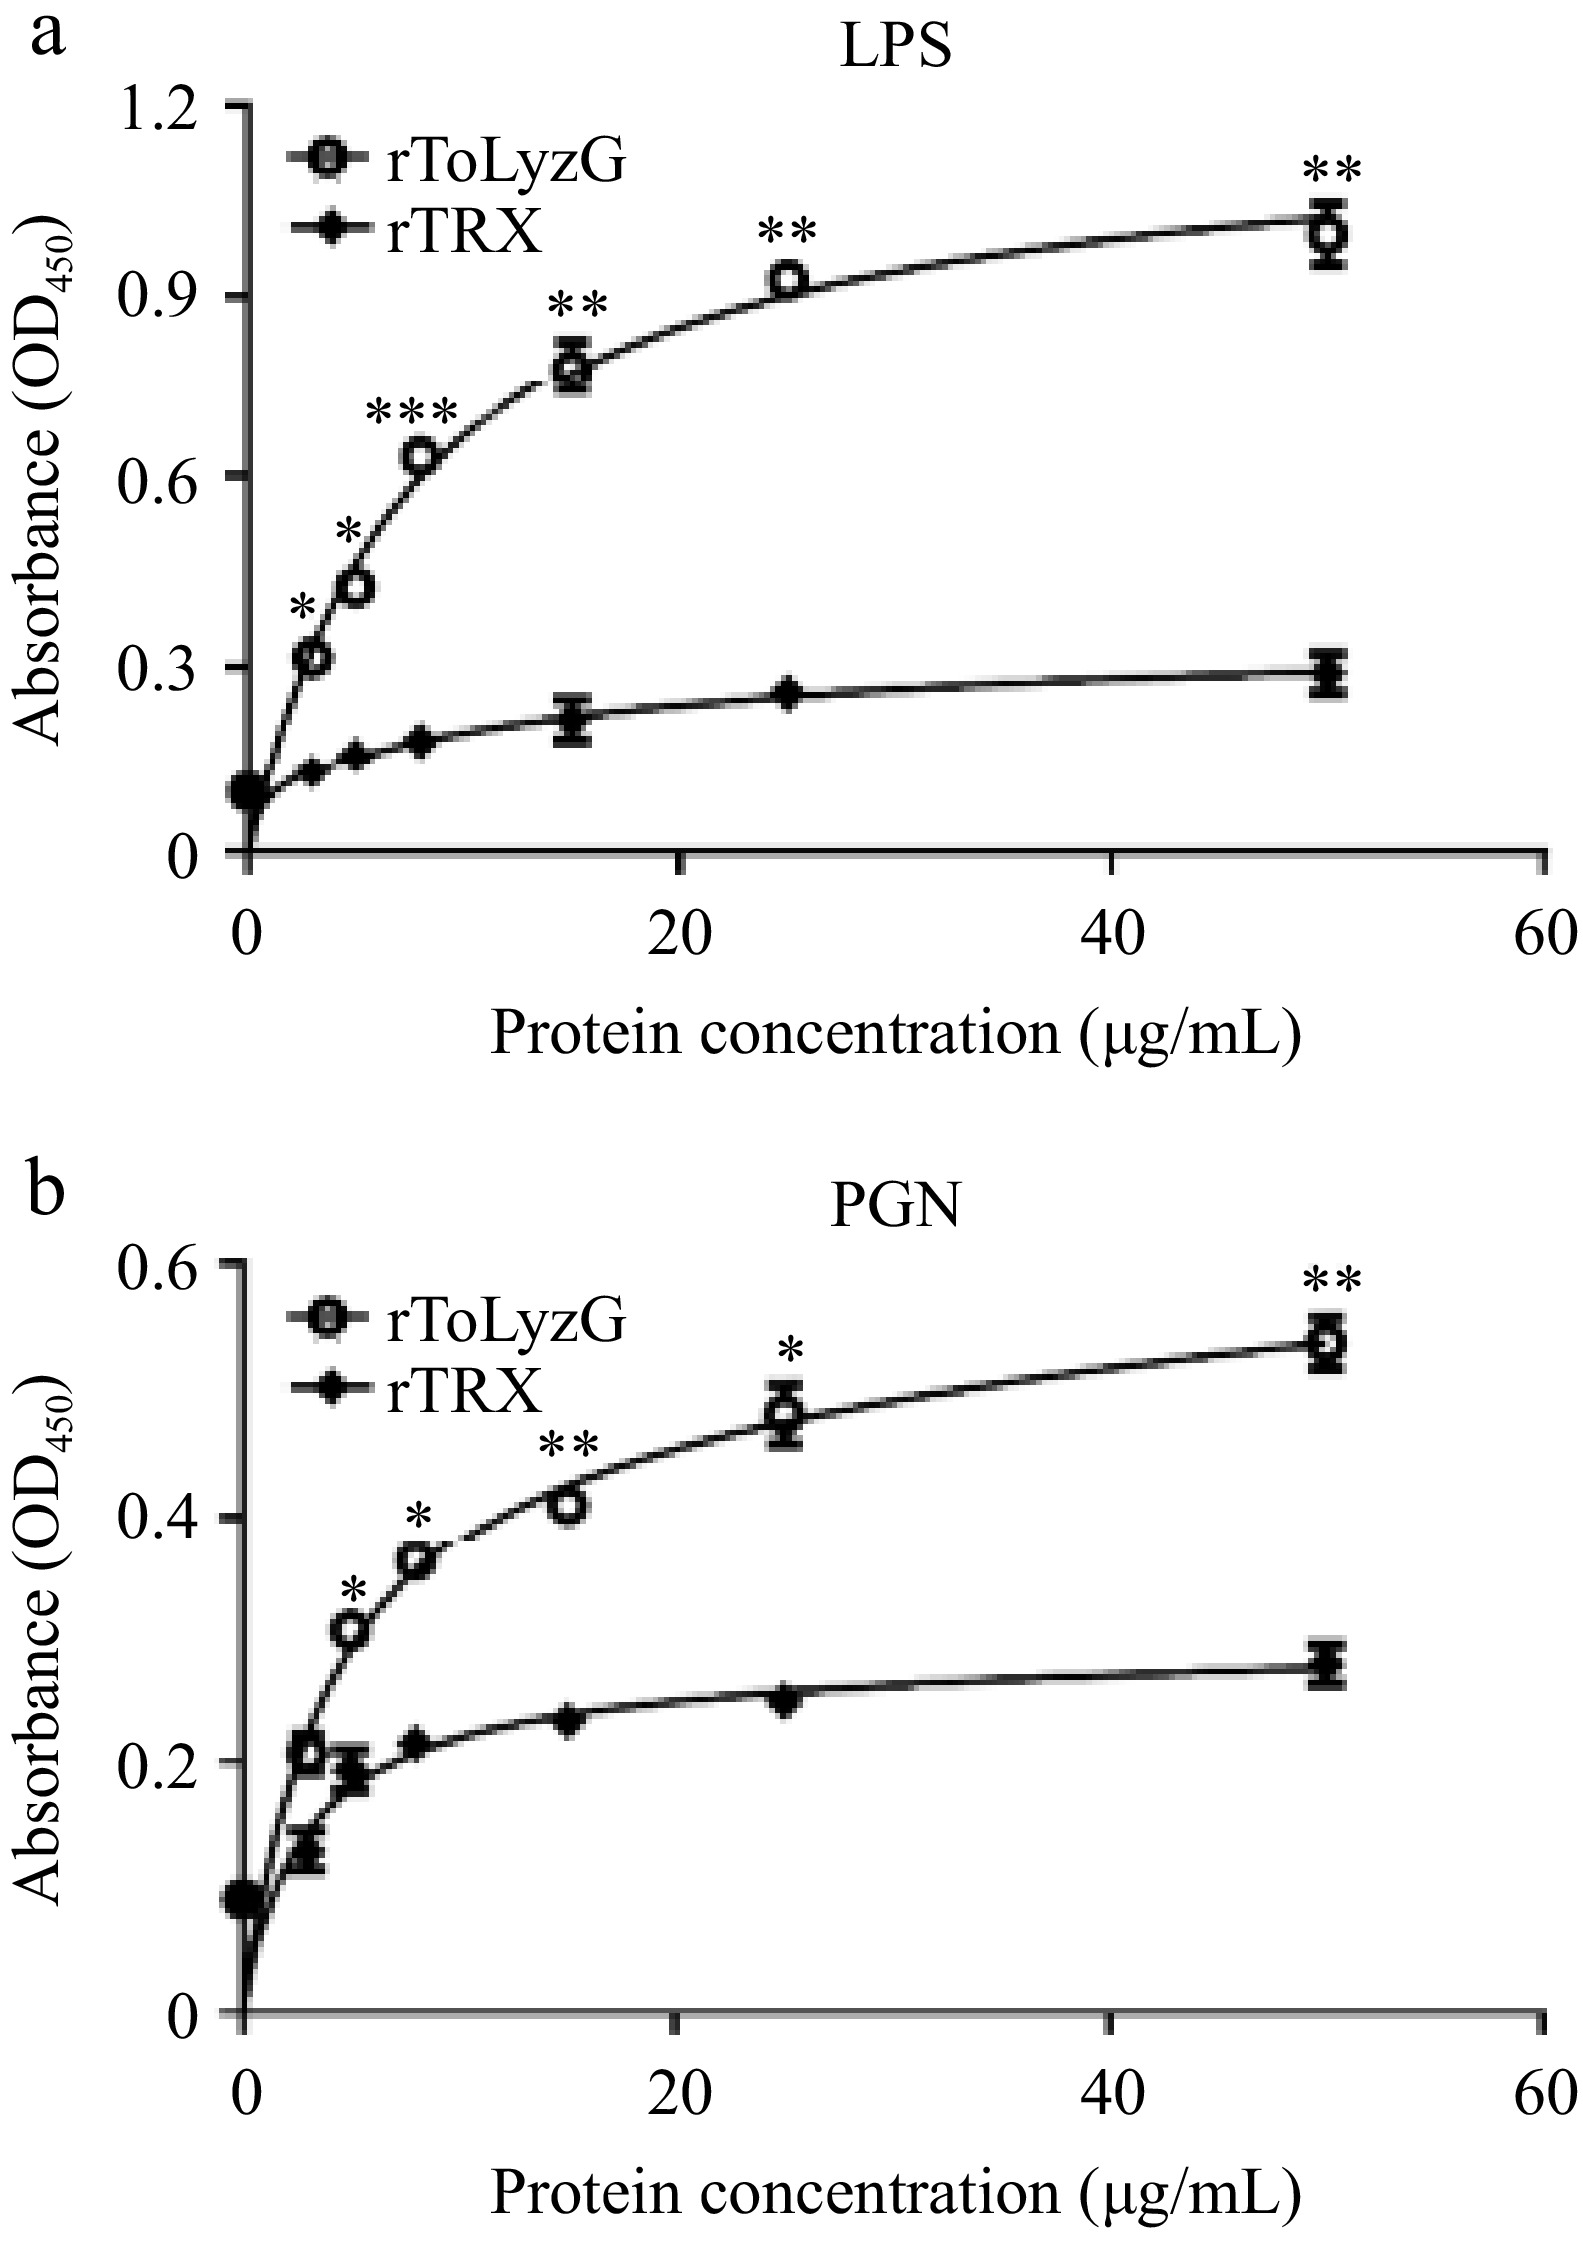
Figure 8.
Carbohydrate binding ability of rToLyzG. The binding of different concentrations of rToLyzG to (a) LPS and (b) PGN was assessed by ELISA, with rTRX serving as a control. Data are presented as the mean ± SD (n = 3). Significant differences are shown with asterisks, * p < 0.05, ** p < 0.01, *** p < 0.001.
-
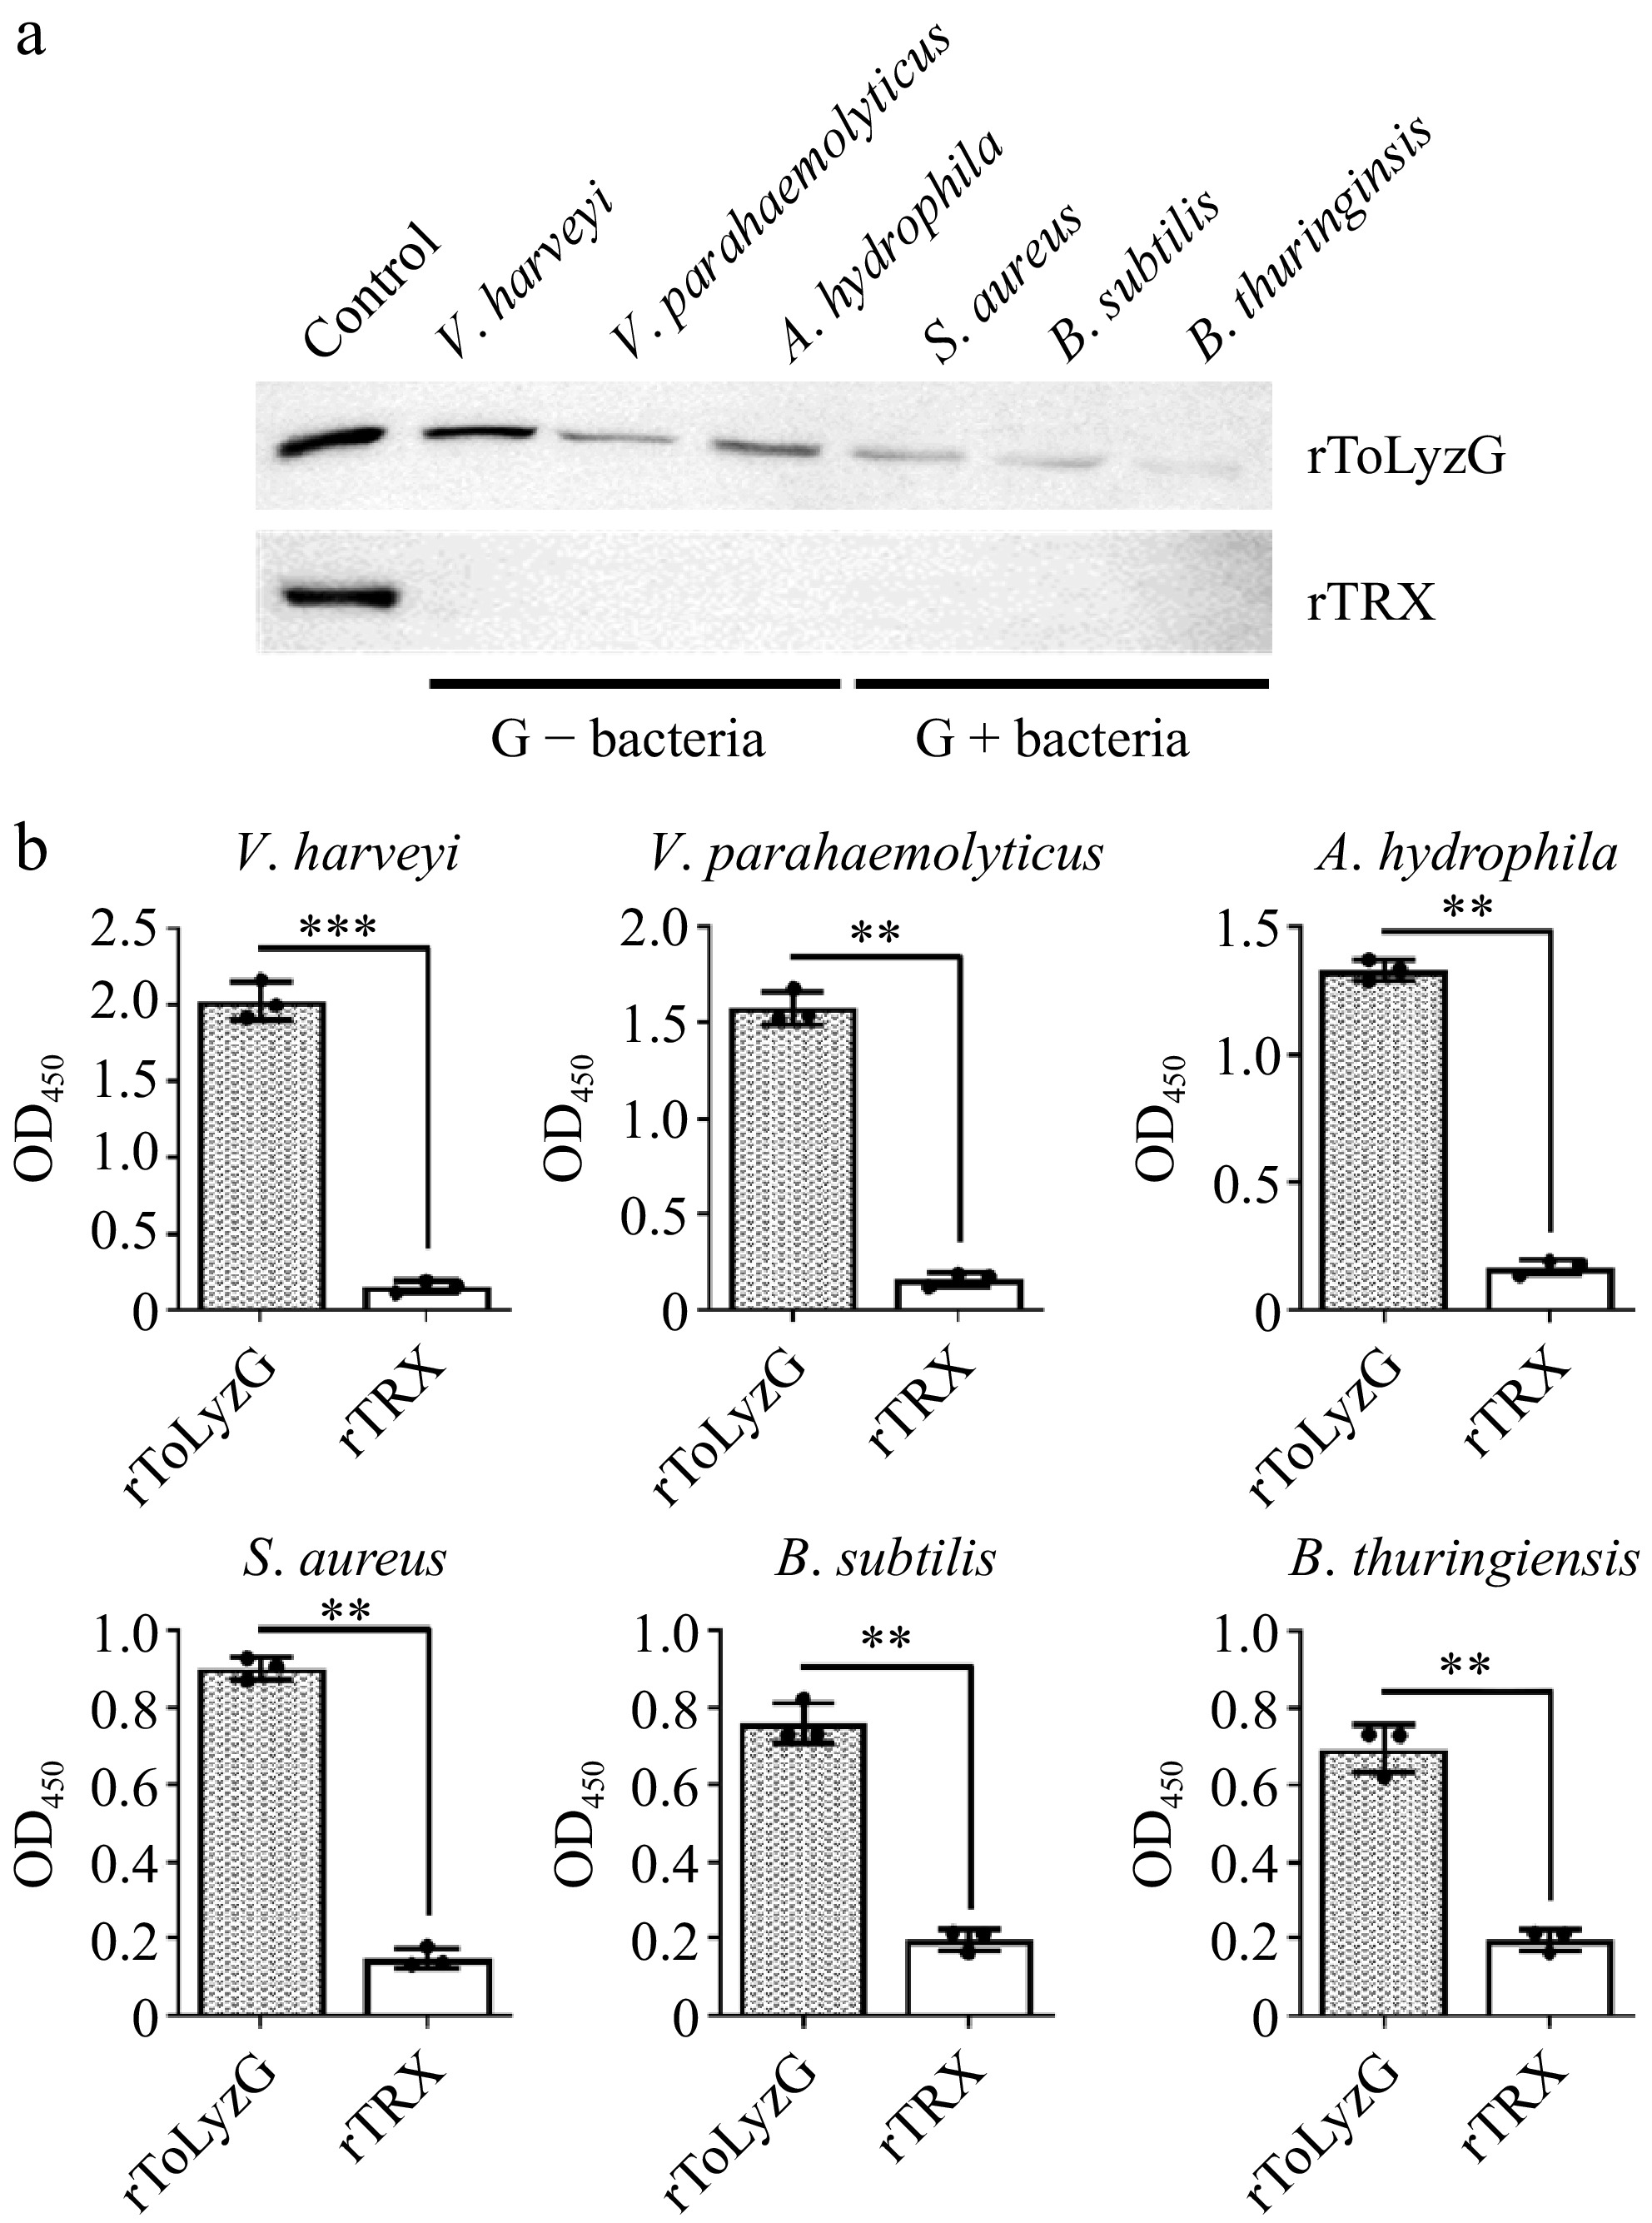
Figure 9.
Binding of rToLyzG to bacteria. The binding activity of rToLyzG to different bacteria, including V. harveyi, V. parahaemolyticus, A. hydrophila, S. aureus, B. subtilis, and B. thuringiensis was determined by (a) Western blot and (b) ELISA. rTRX was used as a negative control. Significant differences are represented with asterisks, ** p < 0.01, *** p < 0.001.
-
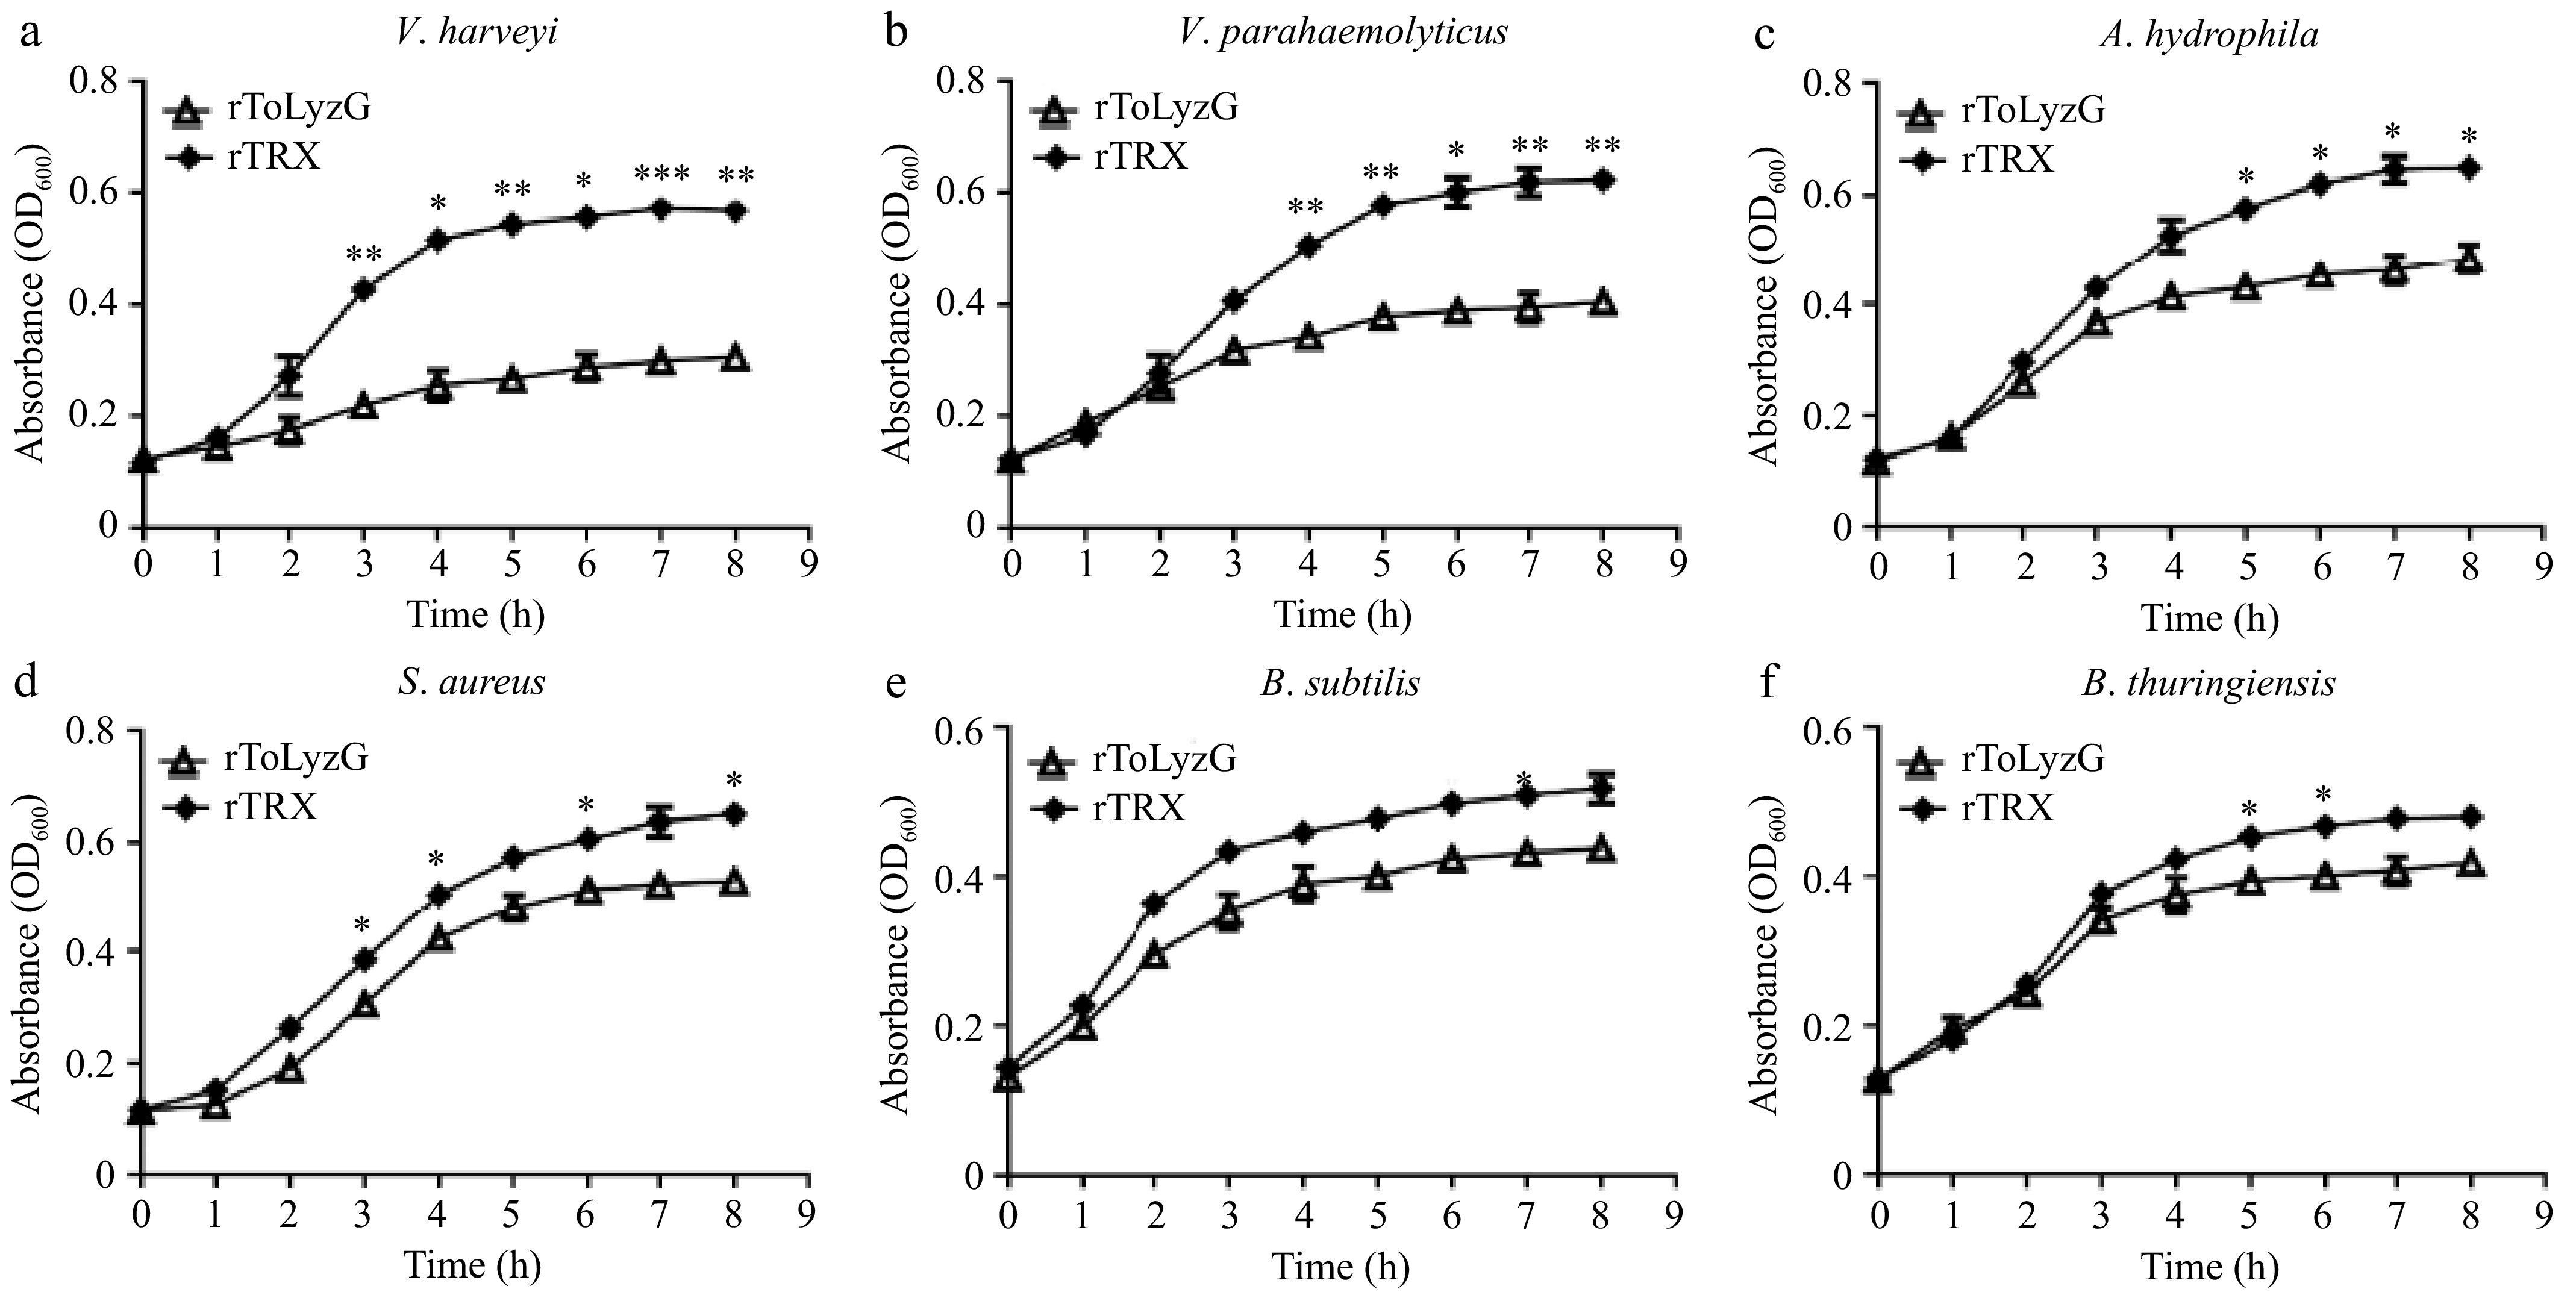
Figure 10.
Antimicrobial activity of rToLyzG against different microbes. (a) V. harveyi, (b) V. parahaemolyticus, (c) A. hydrophila, (d) S. aureus, (e) B. subtilis, or (f) B. thuringiensis was inoculated with rToLyzG protein. Bacterial growth was evaluated by measuring the absorbance at 600 nm every 1 h. rTRX was used as the control. Significant differences are represented with asterisks, * p < 0.05, ** p < 0.01, *** p < 0.001.
-
Primers Nucleotide sequence (5'-3') Tm value
(°C)ToLyzG-F CAAGCCACCGAAATCCTGGTTGAGTT 70.5 ToLyzG-R GACATTTTTCTCACCCTTATTGTAGGCAGC 69.0 ToLyzG-qF CACCGAAATCCTGGTTGAGT 57.2 ToLyzG-qR CACCCTTATTGTAGGCAGCTAA 57.2 β-actin-qF GACAGCTATGTGGGAGATGAAG 56.5 β-actin-qR GGAGCTCGTTATAGAAGGTGTG 56.3 ToLyzG-exF GCCATGGCTGATATCGGATCCATGCCTTACGGAAAGATAGAGGATATA 84.6 ToLyzG-exR ACGGAGCTCGAATTCGGATCCAAACCCCATGTTGCTTTTGTACCACTG 89.5 Table 1.
Primers used in this study.
-
Bacteria UL Vibrio harveyi 0.865 Vibrio parahaemolyticus 0.785 Aeromonas hydrophila 0.658 Staphylococcus aureus 0.516 Bacillus subtilis 0.483 Bacillus thuringiensis 0.466 Table 2.
Lytic activity of rToLyzG against bacteria.
Figures
(10)
Tables
(2)