-
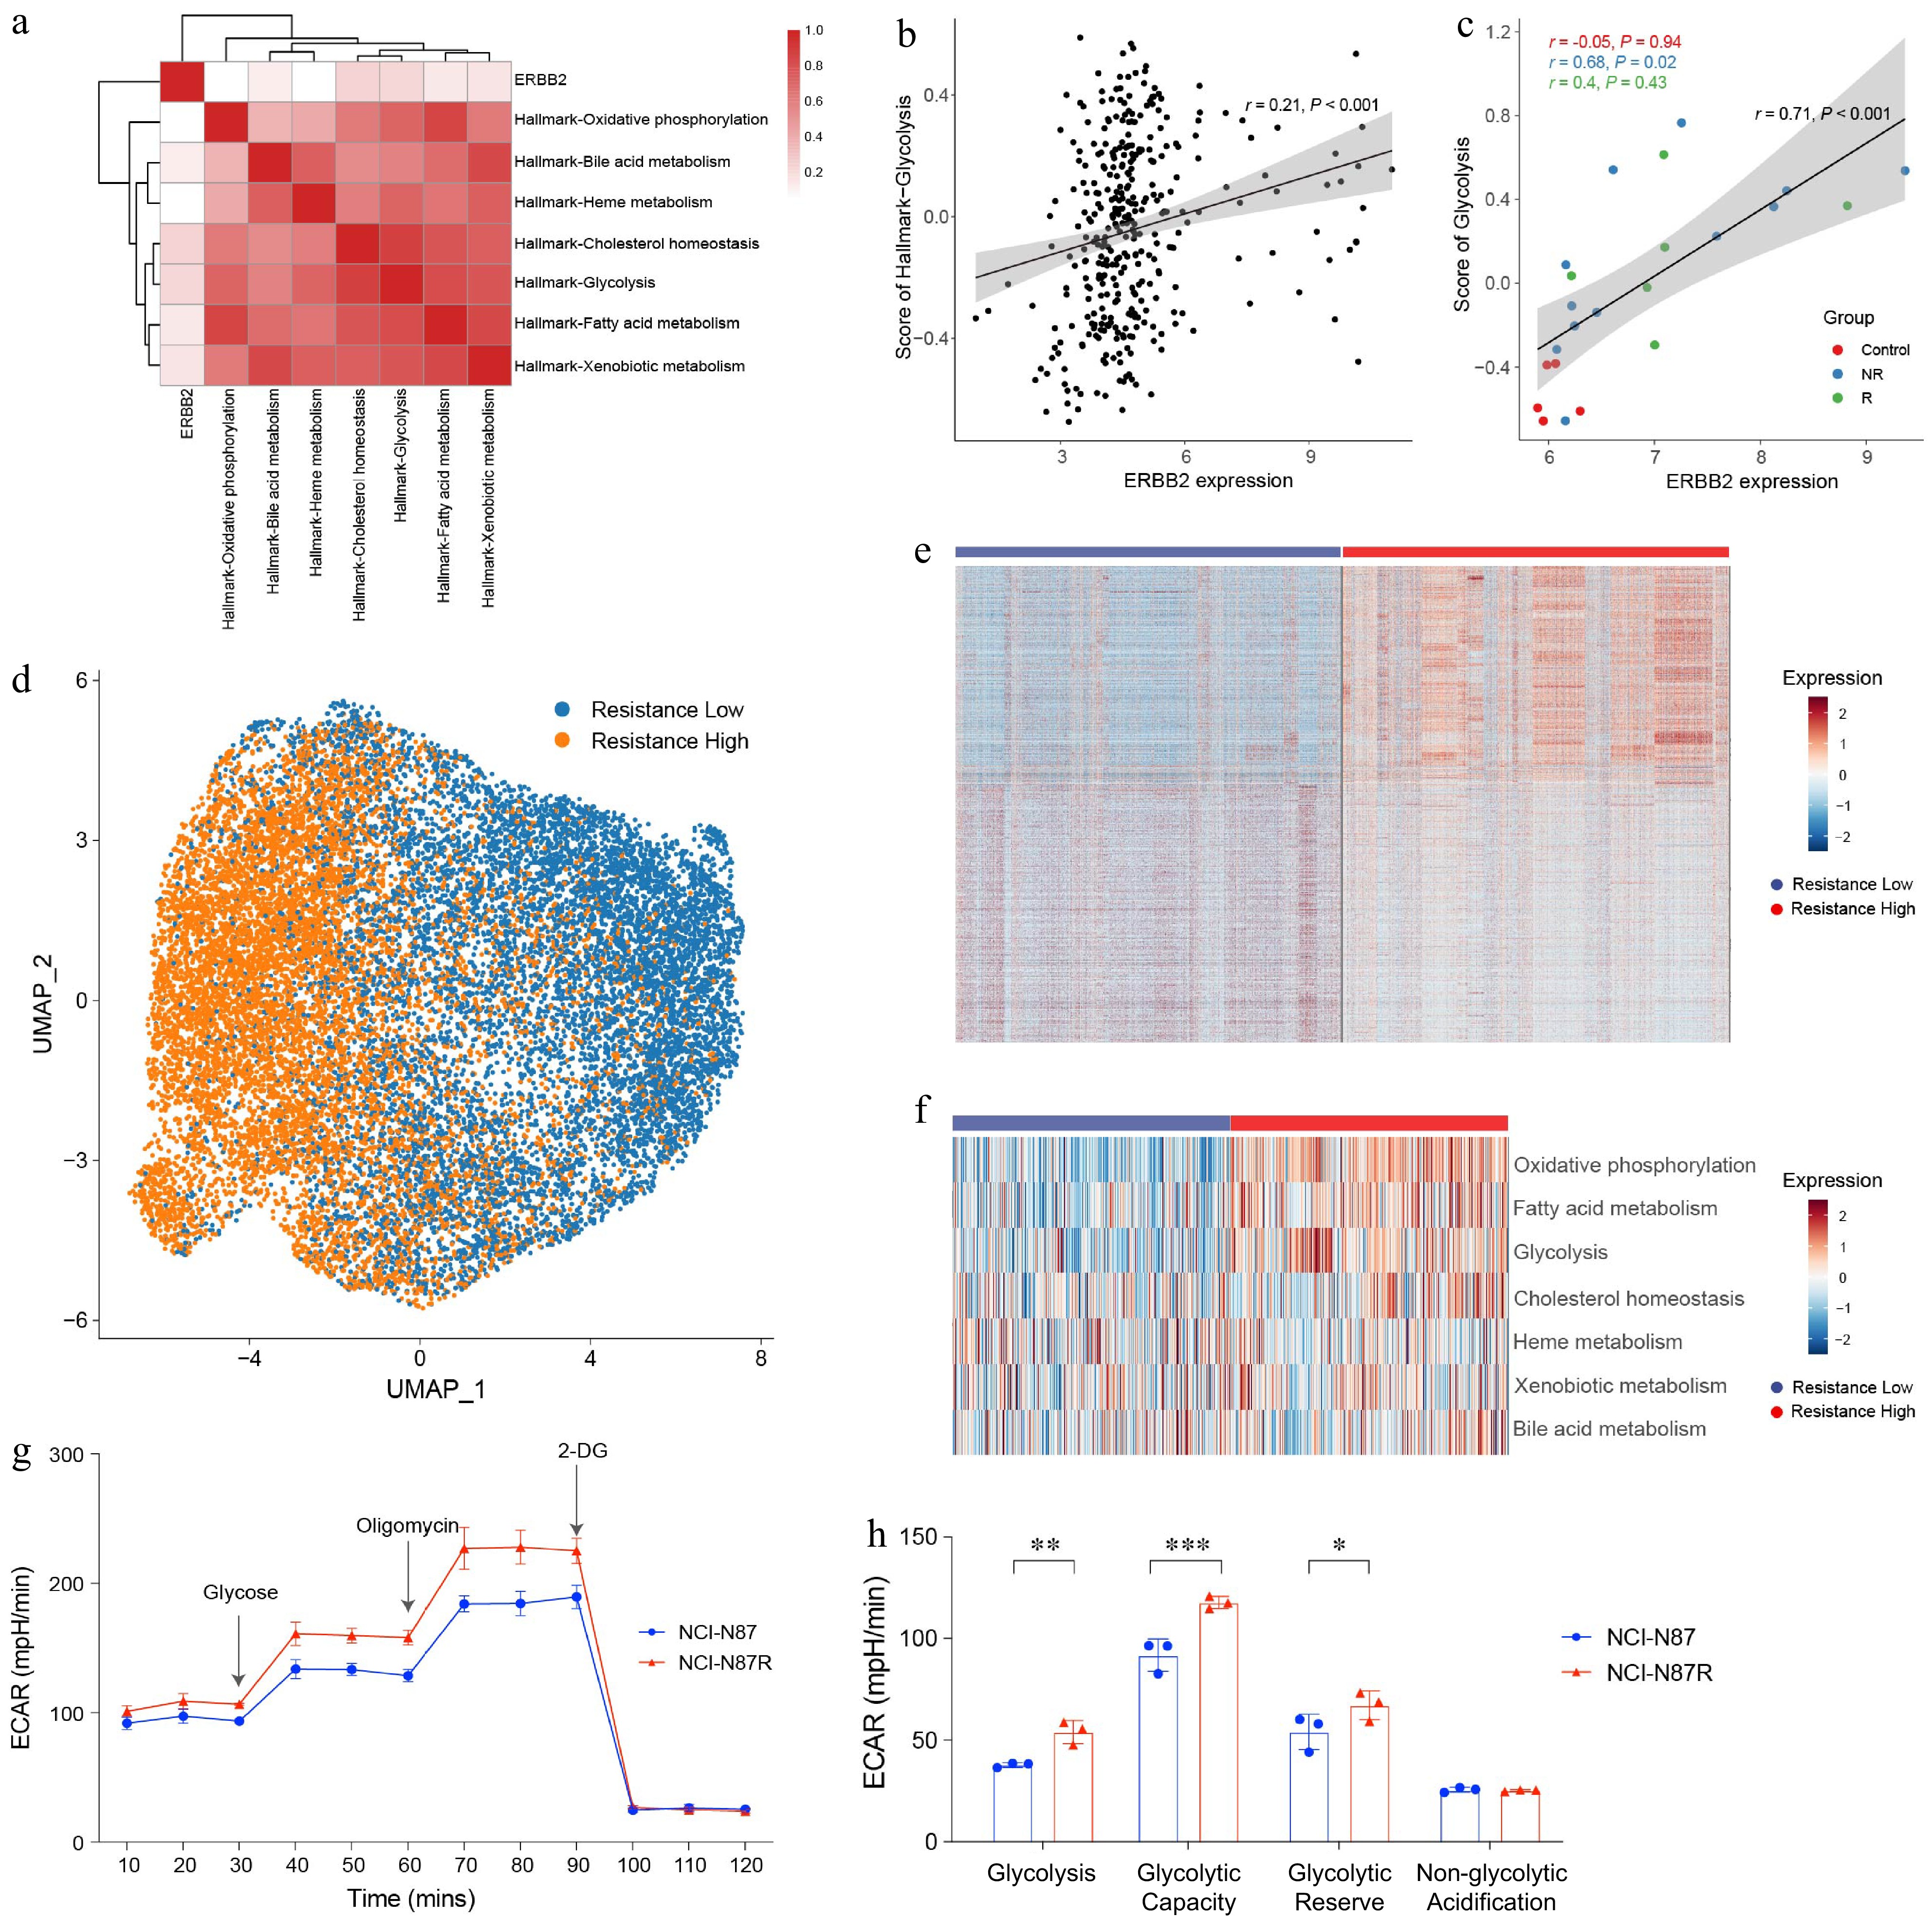
Figure 1.
Elevated glycolysis in trastuzumab-resistant gastric cancer cells. (a) Heat map showing the correlation between ERBB2 expression and metabolic pathways in TCGA-STAD. (b) Dot plot showing the correlation between ERBB2 expression and glycolysis in the TCGA-STAD. (c) Dot plot showing the correlation between ERBB2 expression and glycolysis in the GEO database. (d) UMAP visualized the clustering of gastric cancer cells based on the trastuzumab-resistant score. (e) Heat map showing the DEGs between 'resistance low' and 'resistance high' groups. (f) Scores of metabolism-related pathways between 'resistance low' and 'resistance high' groups. (g) ECAR assay results of trastuzumab-resistant gastric cancer cell line NCI-N87R and trastuzumab-sensitive gastric cancer cell line NCI-N87. The experiment was performed with three biological replicates (N = 3). (h) Box plots displaying the basal glycolysis level (glycolysis), glycolytic capacity (glycolytic capacity), glycolytic reserve (glycolytic reserve), and non-glycolytic acidification (non-glycolytic acidification) of two gastric cancer cell lines according to (g). Pearson correlation analysis was used to calculate the correlation in (a)−(c). The 'resistance low' and 'resistance high' groups are defined by the median value of the trastuzumab-resistant score. Statistical analyses in (h) were performed using an unpaired, two-tailed Student's t-test. * p < 0.05, ** p < 0.01, *** p < 0.001.
-
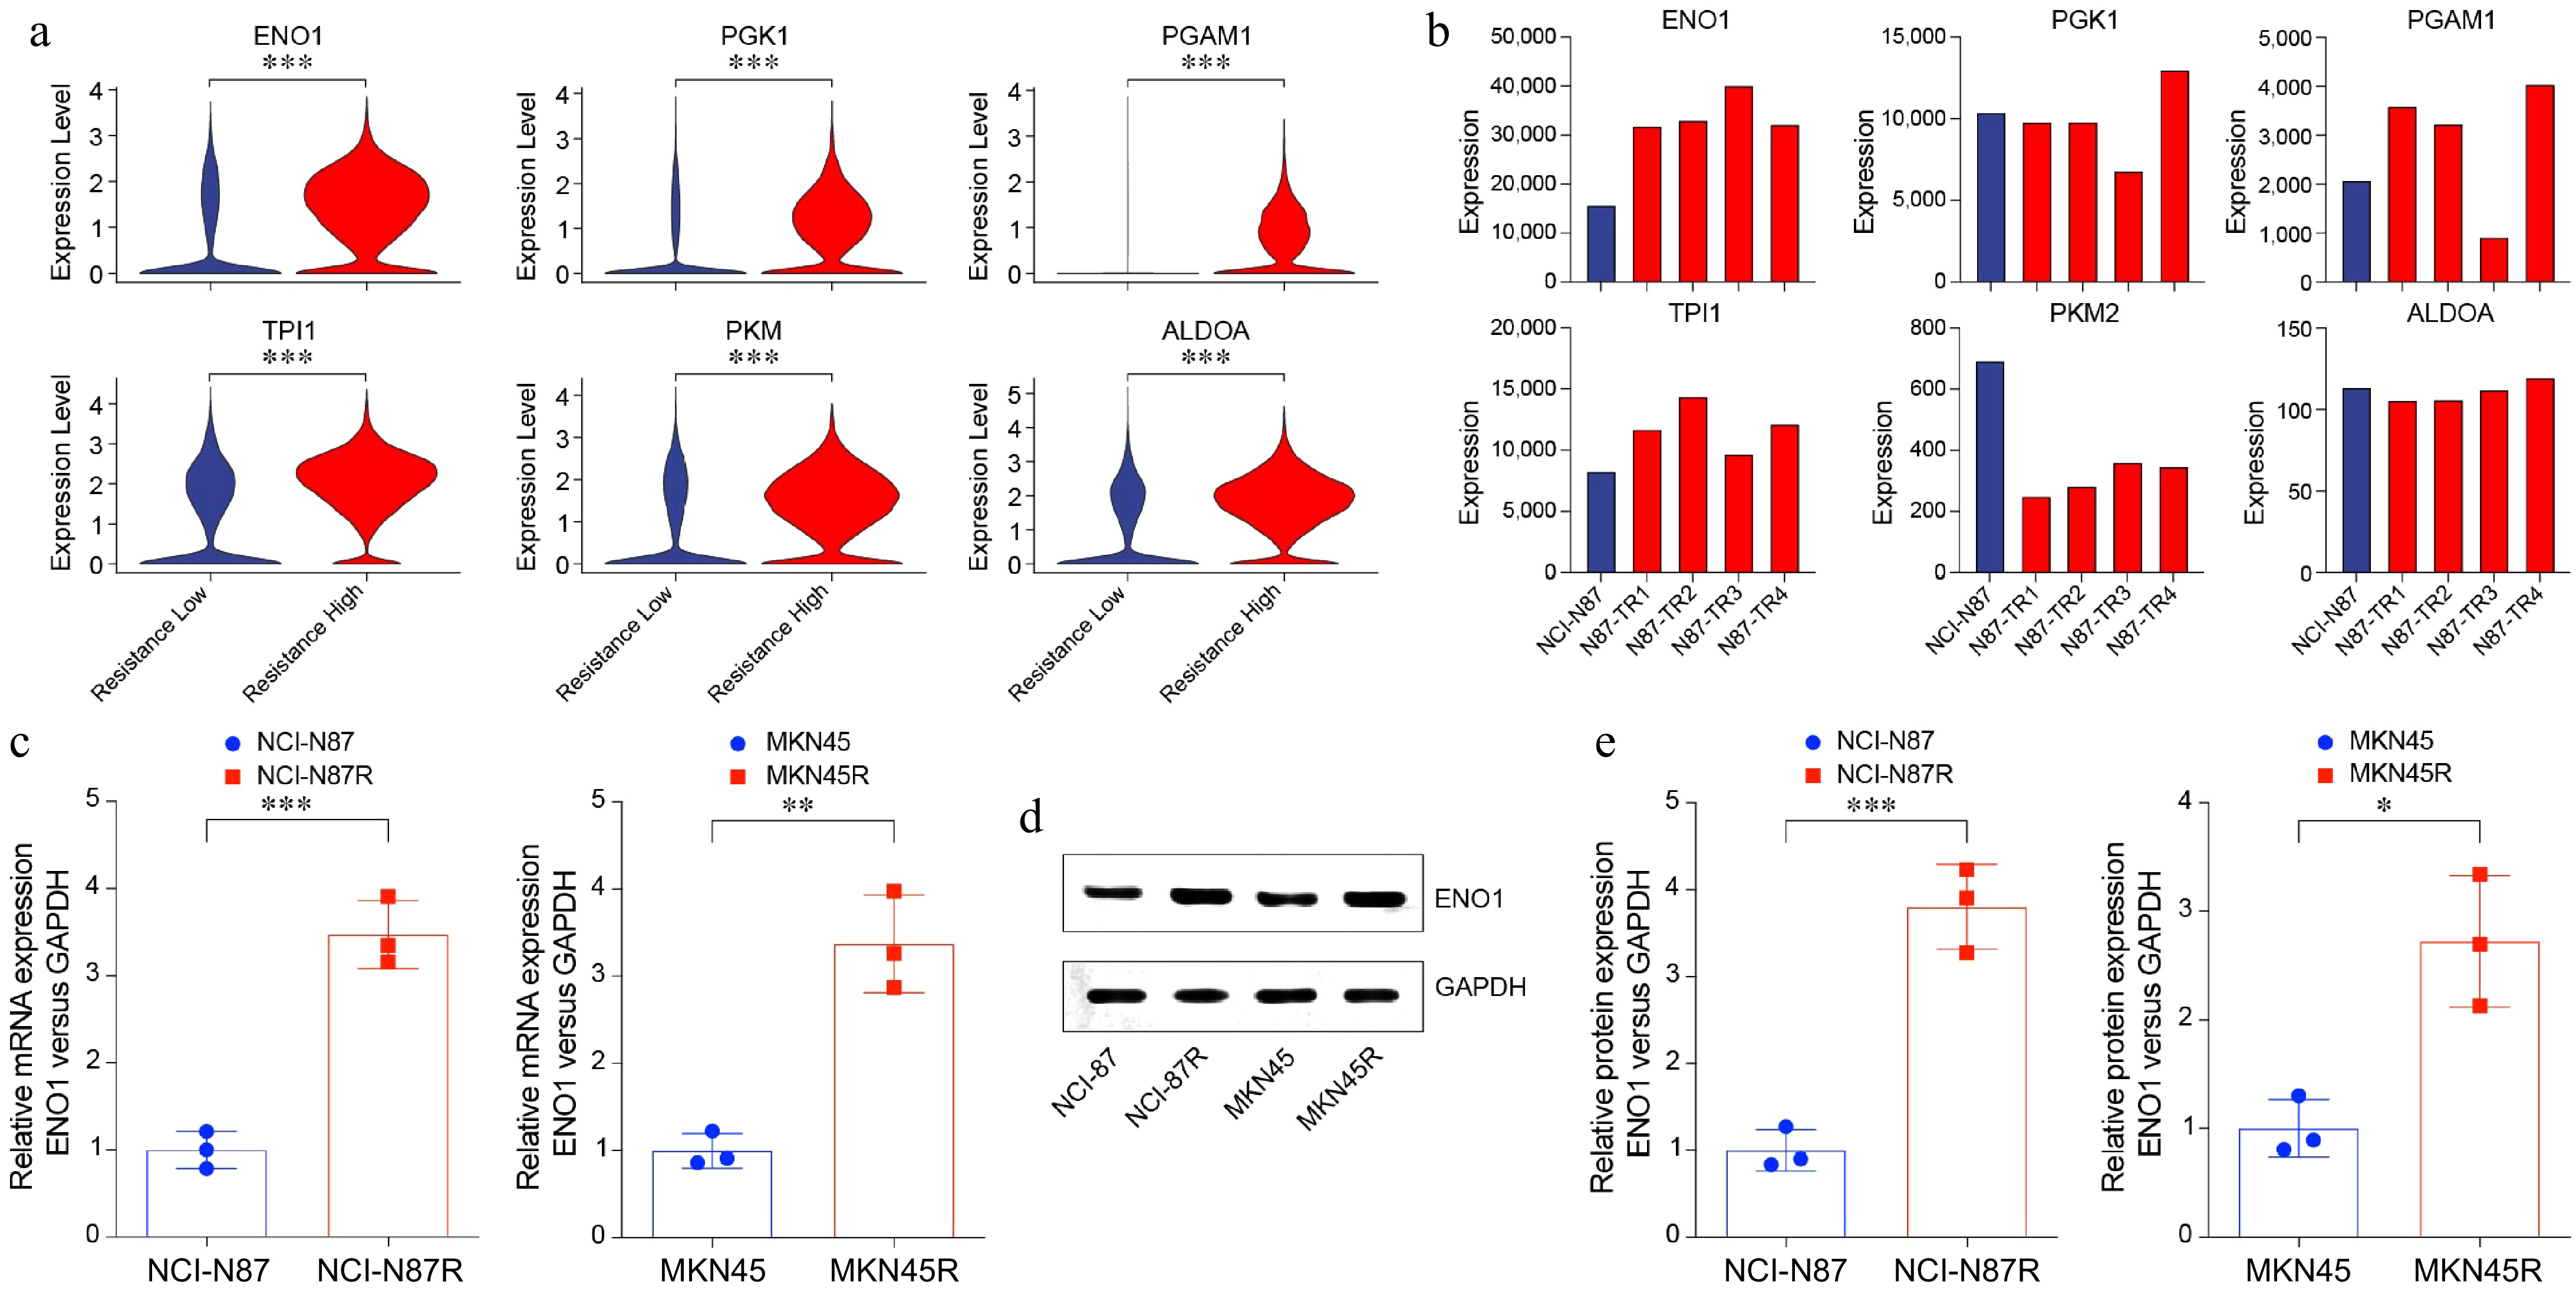
Figure 2.
Increased ENO1 expression in trastuzumab-resistant gastric cancer cells. (a) Violin plots showing upregulated glycolysis-related genes in Fig. 1a. (b) Bar plots displaying upregulated glycolysis-related genes in gastric cancer cell lines. (c) RT-PCR analysis of ENO1 expression in trastuzumab-resistant and trastuzumab-sensitive gastric cancer cell lines. The experiment was performed with three biological replicates (N = 3). (d) and (e) Western blot analysis of ENO1 protein levels in trastuzumab-resistant and trastuzumab-sensitive gastric cancer cell lines. The experiment was performed with three biological replicates (N = 3). Statistical analyses in (a), (c), and (e) were performed using an unpaired, two-tailed Student's t-test. * p < 0.05, ** p < 0.01, *** p < 0.001.
-
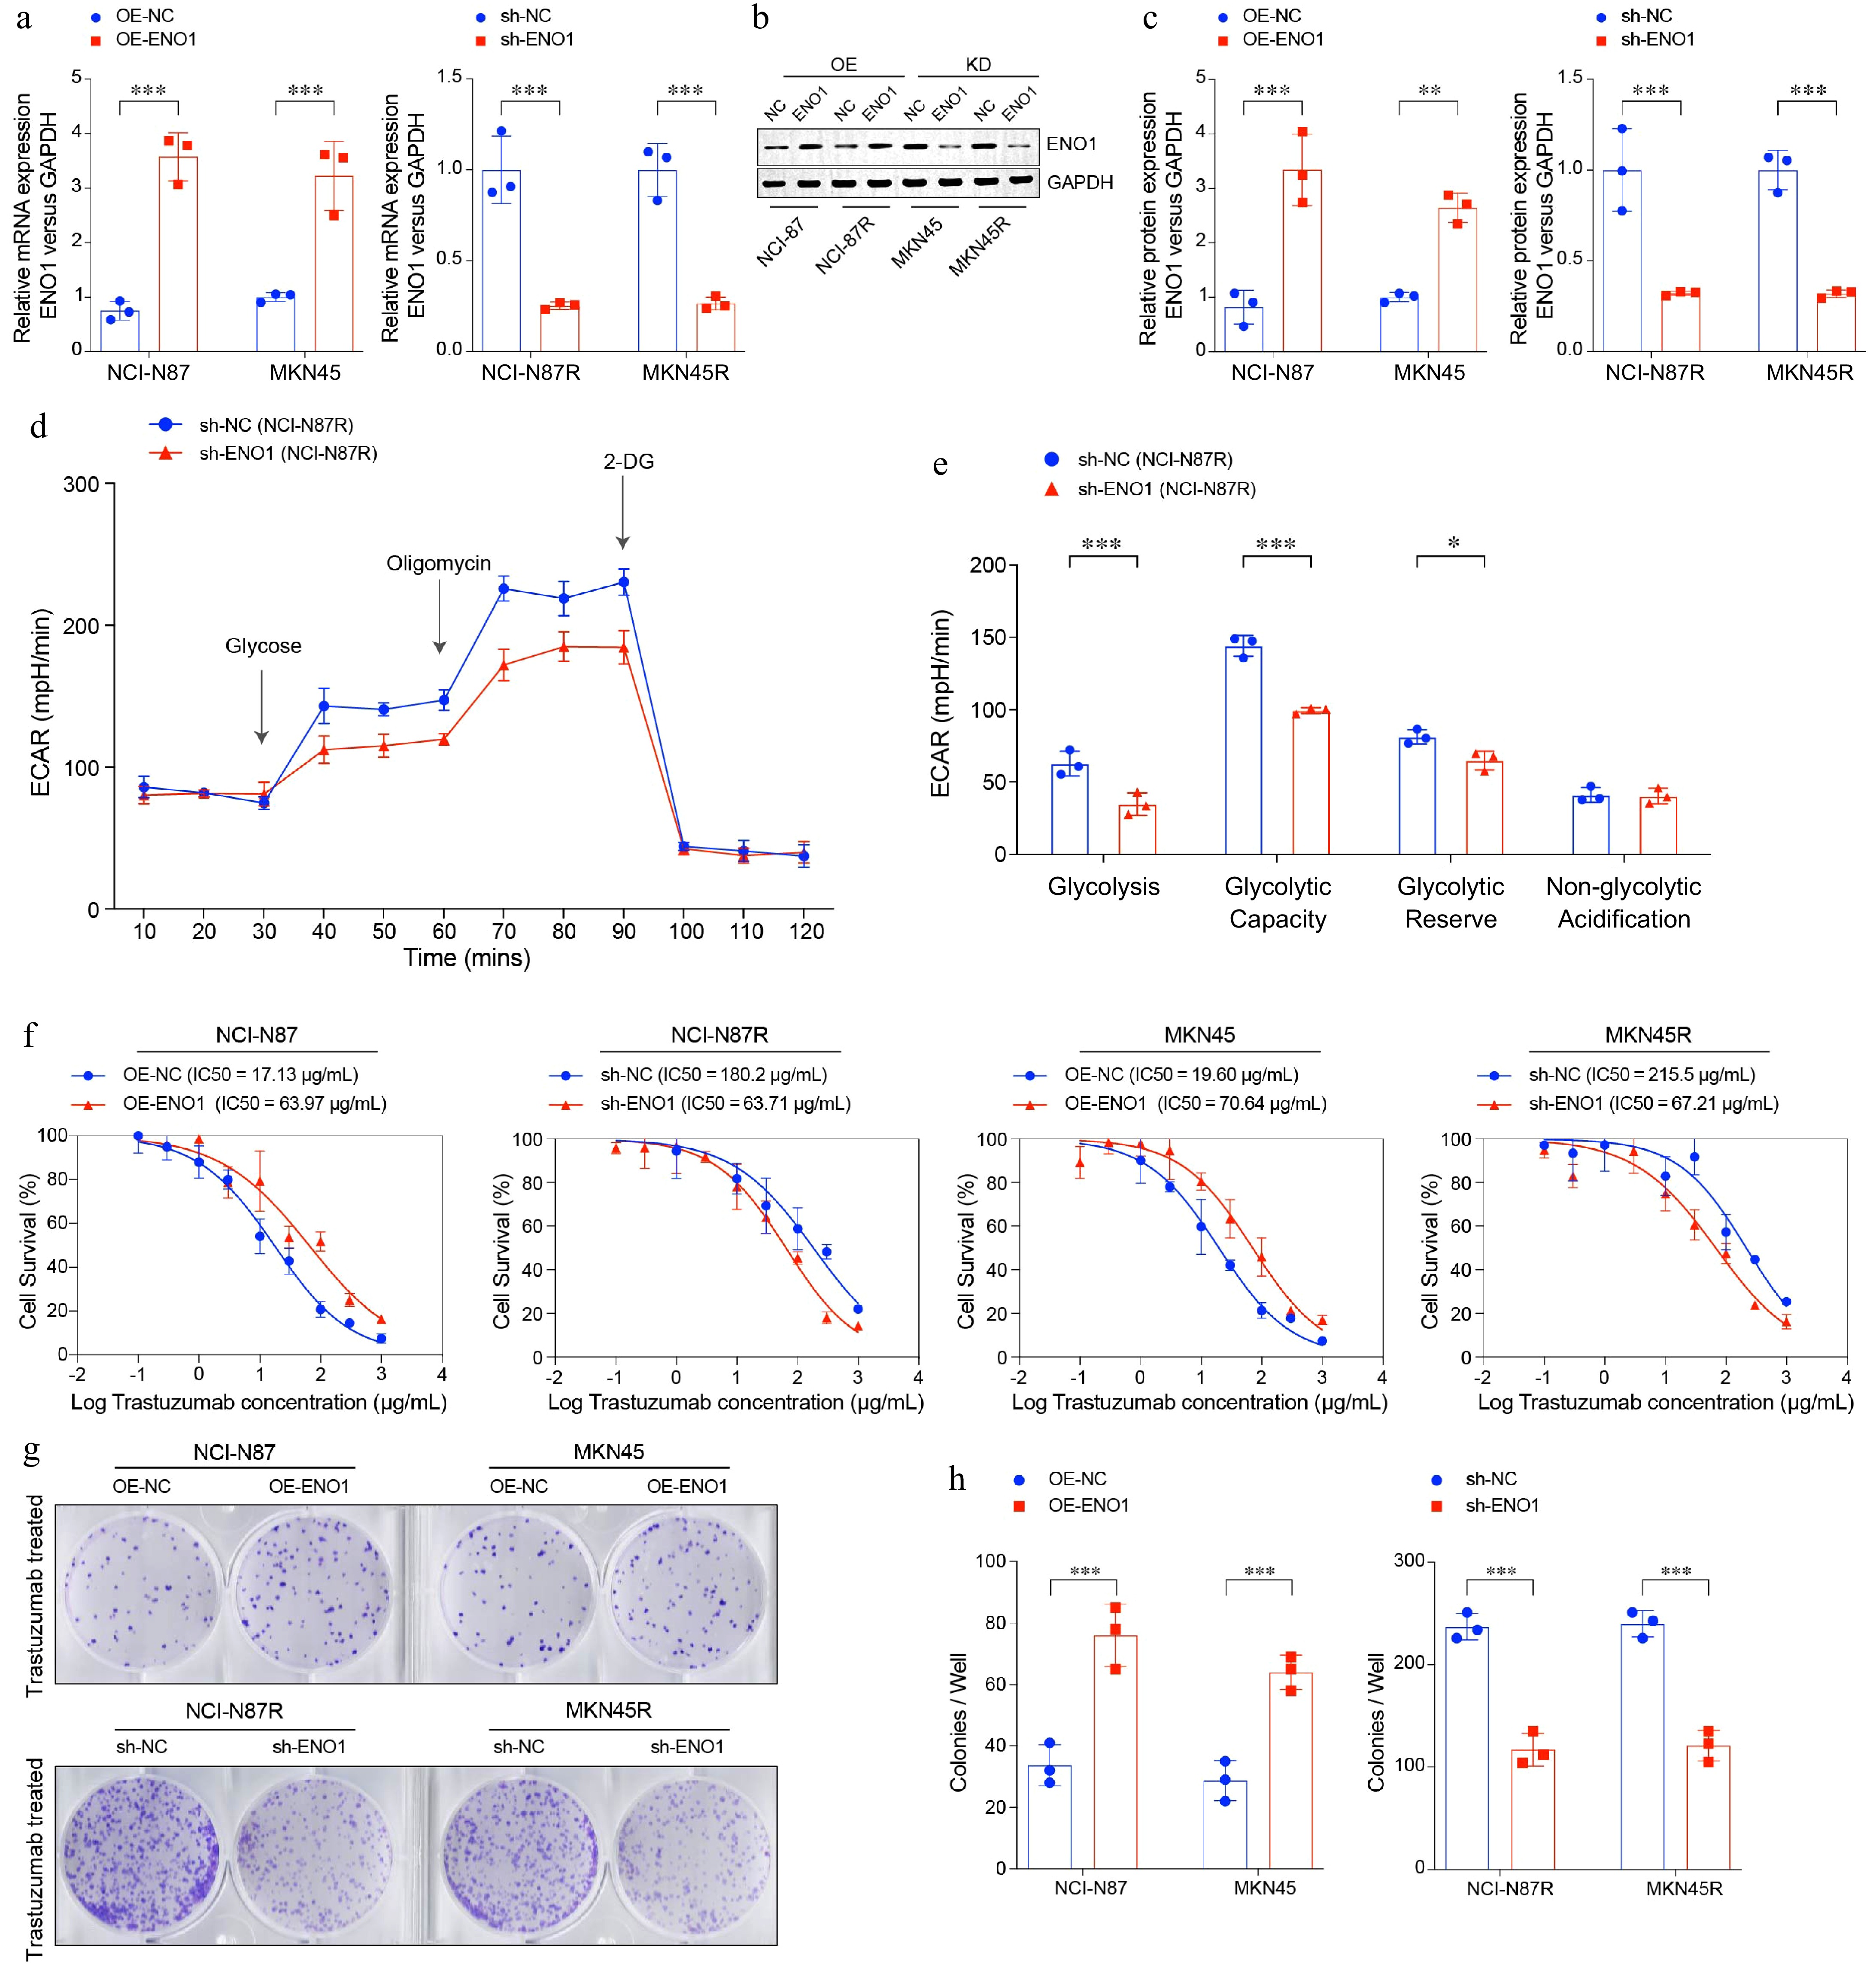
Figure 3.
ENO1 linked to enhanced cell survival and colony formation in gastric cancer cells. (a) RT-PCR analysis of ENO1 expression in modified gastric cancer cell lines. (b) and (c) Western blot analysis of ENO1 protein levels in modified gastric cancer cell lines. (c) ECAR assay results of ENO1-knockdown gastric cancer cell lines. (d) Box plots displaying the basal glycolysis level (glycolysis), glycolytic capacity (glycolytic capacity), glycolytic reserve (glycolytic reserve) and non-glycolytic acidification (non-glycolytic acidification) of two gastric cancer cell lines according to (c). (f) Curves of cell viability assay for modified gastric cancer cell lines. (g) and (h) Colony formation assay results for modified gastric cancer cell lines. The experiment was performed with three biological replicates (N = 3). Statistical analyses in (a), (c), (e), and (h) were performed using an unpaired, two-tailed Student's t-test. * p < 0.05, ** p < 0.01, *** p < 0.001.
-
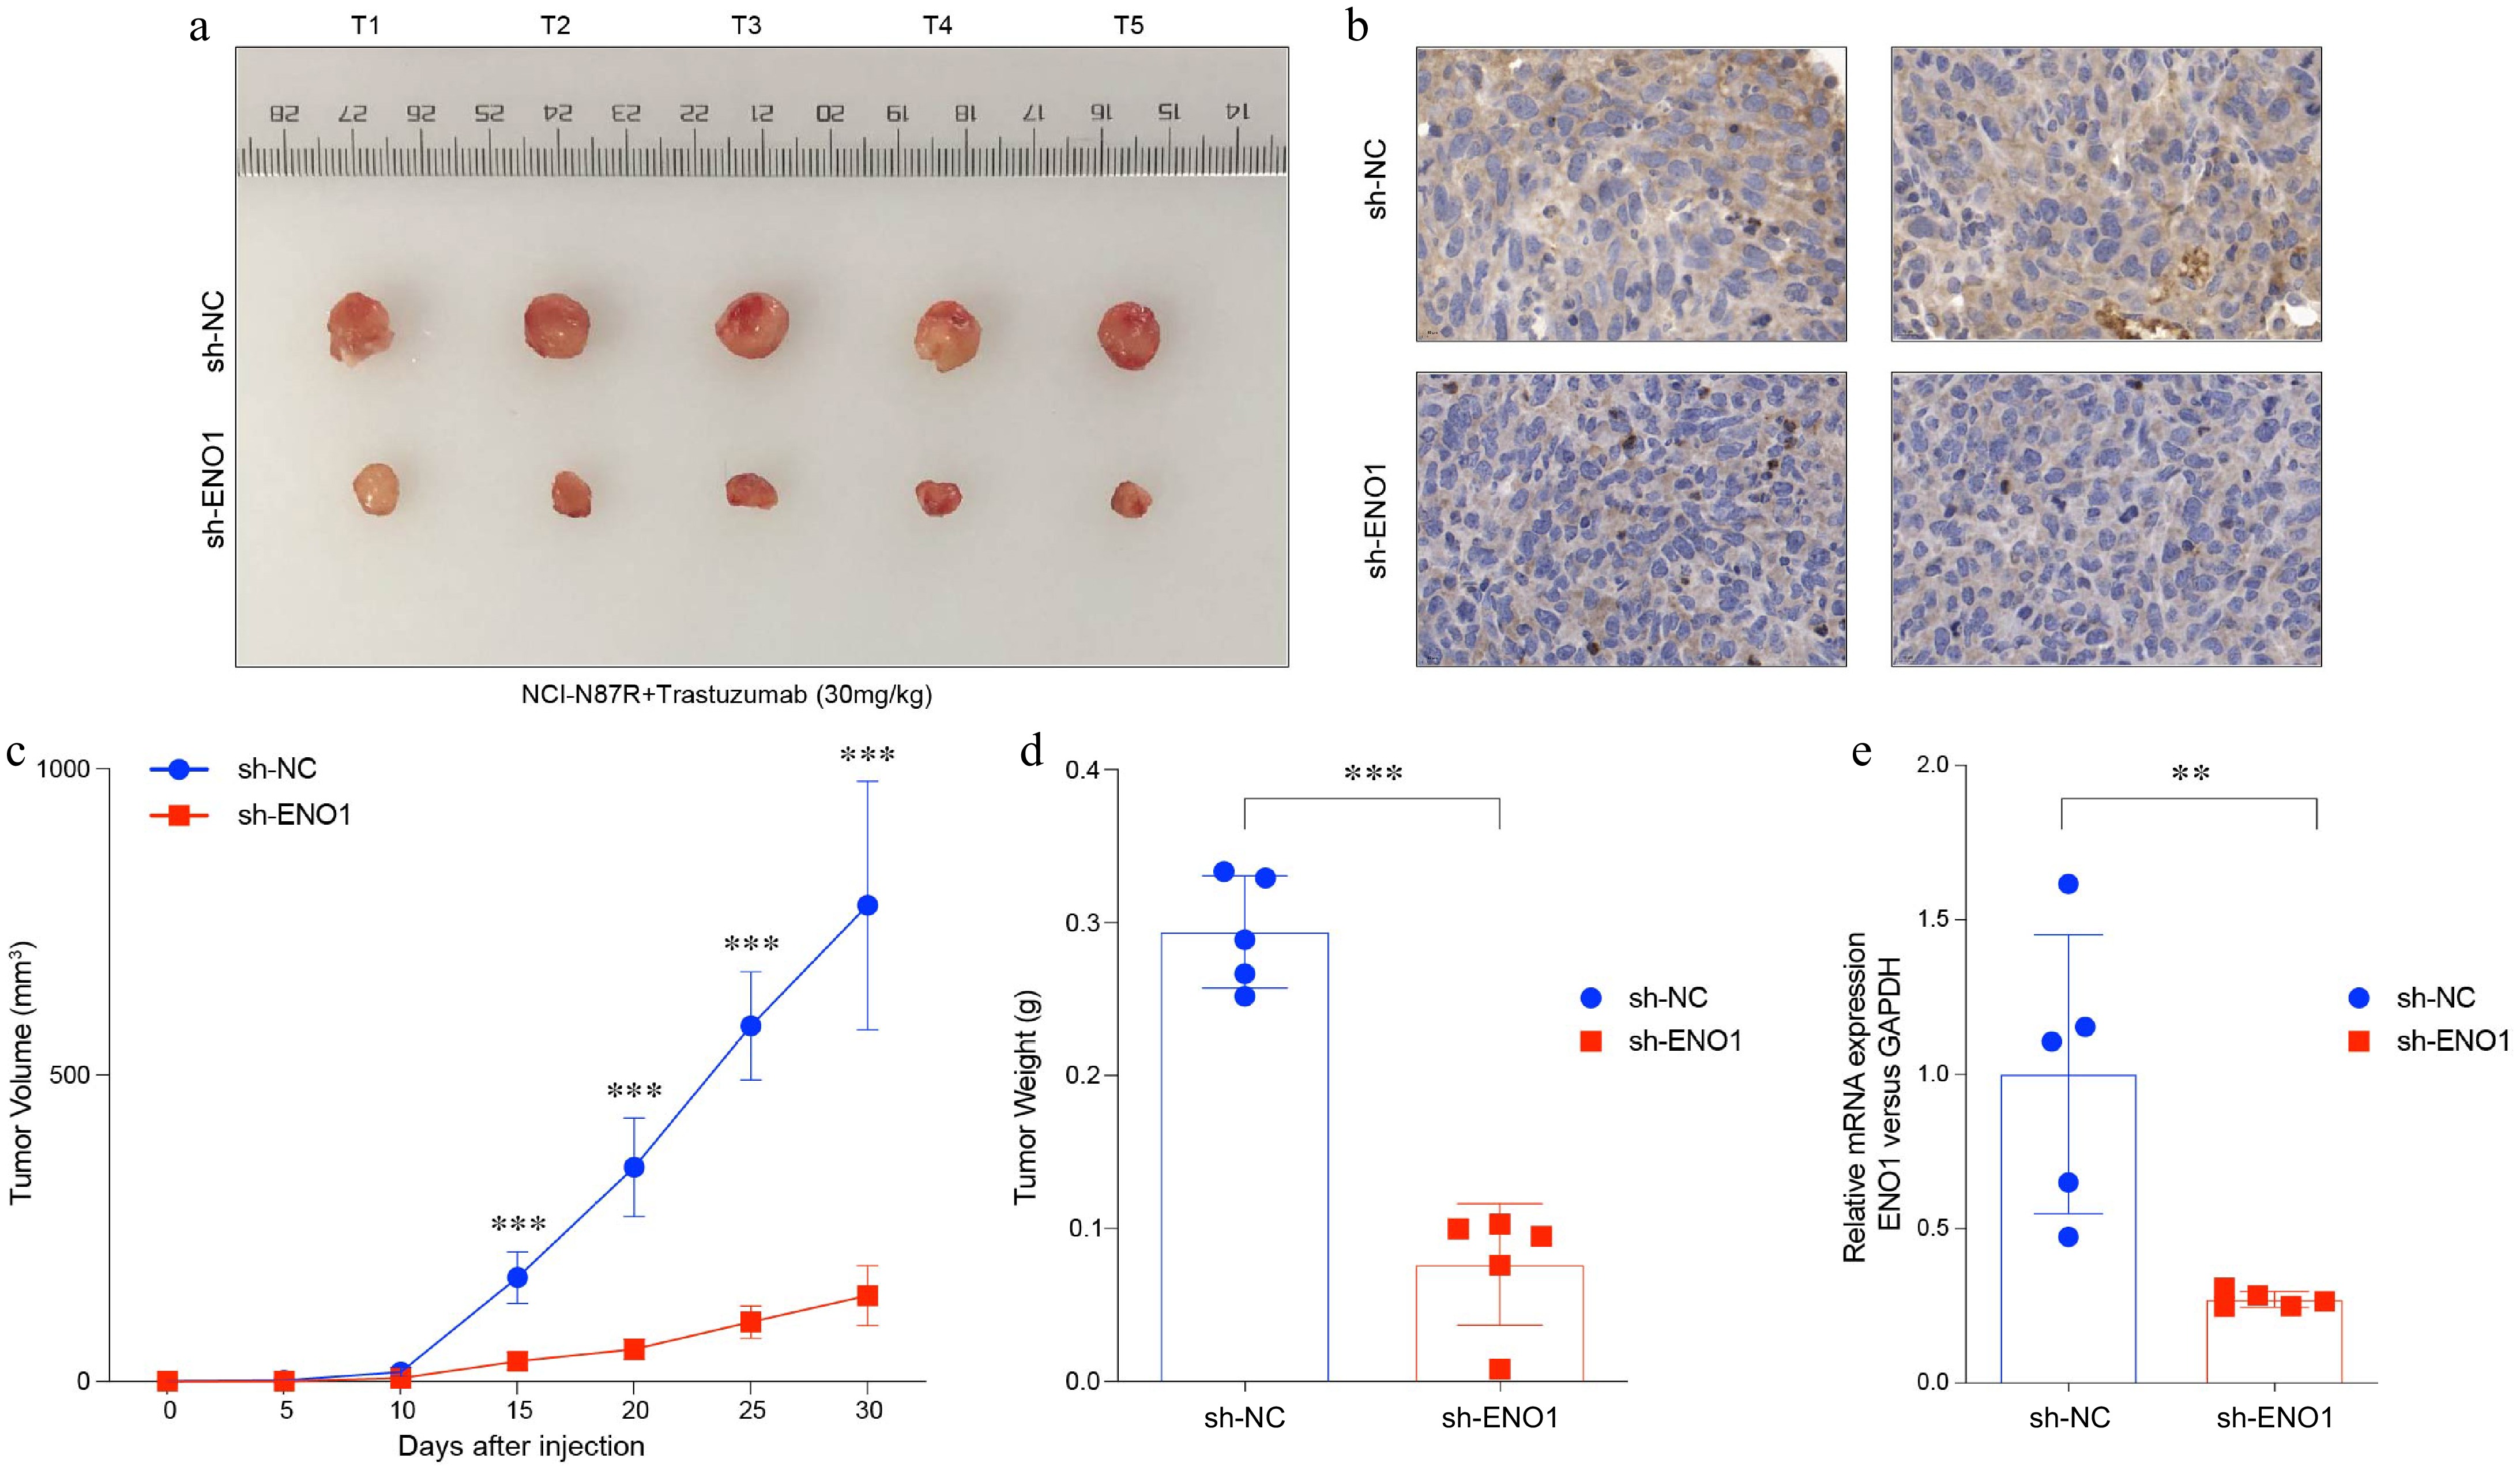
Figure 4.
ENO1 was associated with tumor growth in gastric cancer. (a) Balb/c Nu mice were injected subcutaneously with 1 × 10⁷ tumor cells and housed under standard conditions. Trastuzumab (30 mg/kg) was administered intraperitoneally every 5 d. Tumor size was measured every 5 d until day 30, after which the tumors were photographed, excised, and fixed in formalin. Tumor volume diagram with five biological replicates (N = 5). (b) Representative IHC staining results from (a). (c) Tumor growth curves corresponding to (a). (d) Box plots illustrated tumor weight in (a). (e) Levels of ENO1 protein based on IHC results in (b). Statistical analyses in (c)−(e) were performed using an unpaired, two-tailed Student's t-test. ** p < 0.01, *** p < 0.001.
-
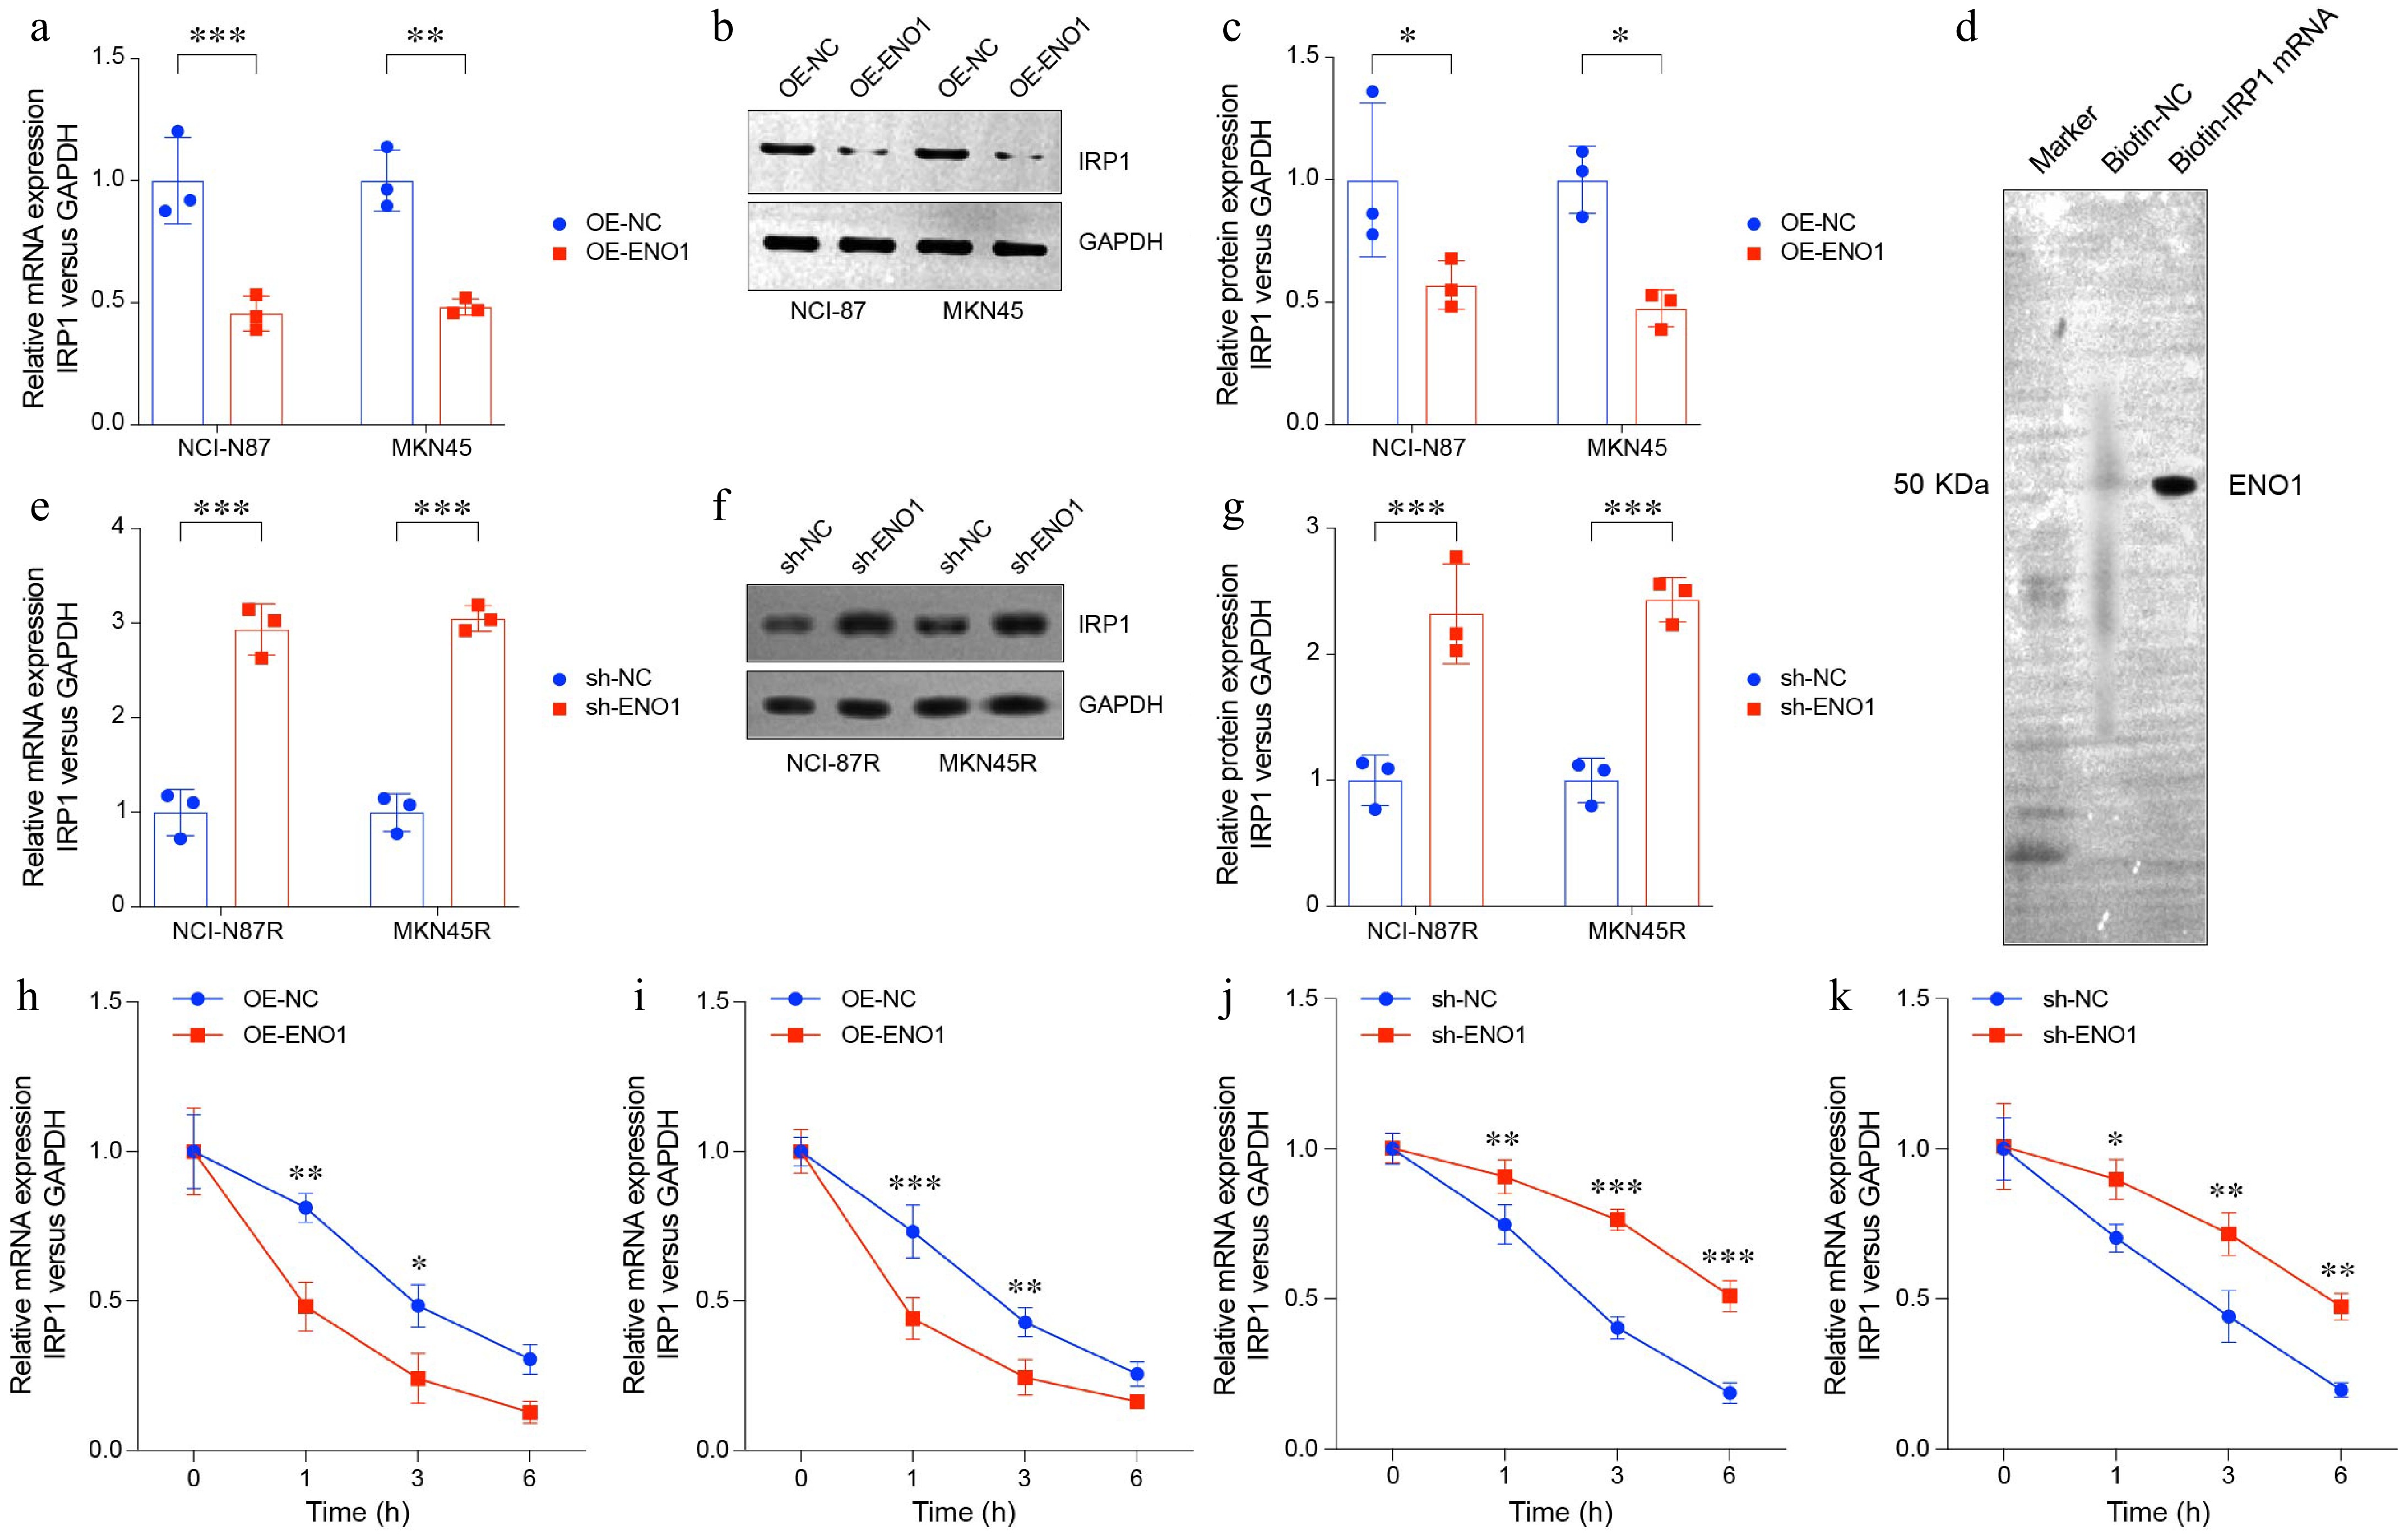
Figure 5.
ENO1 overexpression suppressed TCA-related gene IRP1 expression. (a) RT-PCR analysis of IRP1 expression in ENO1-overexpressed gastric cancer cell lines. (b) and (c) Western blot analysis of IRP1 protein levels in ENO1-overexpressed gastric cancer cell lines. (d) RNA pull-down assay of trastuzumab-resistant gastric cancer cell line NCI-N87R. (e) RT-PCR analysis of IRP1 expression in ENO1-knockdown gastric cancer cell lines. (f) and (g) Western blot analysis of IRP1 protein levels in ENO1-knockdown gastric cancer cell lines. The experiment was performed with three biological replicates (N = 3). (h)−(k) The curves represent IRP1 expression at various time points (0, 1, 3, 6 h). (h) OE-ENO1 NCI-N87R. (i) OE-ENO1 MKN45R. (j) sh-ENO1 NCI-N87R. (k) sh-ENO1 MKN45R. All statistical analyses were performed using an unpaired, two-tailed Student's t-test. * p < 0.05, ** p < 0.01, *** p < 0.001.
-
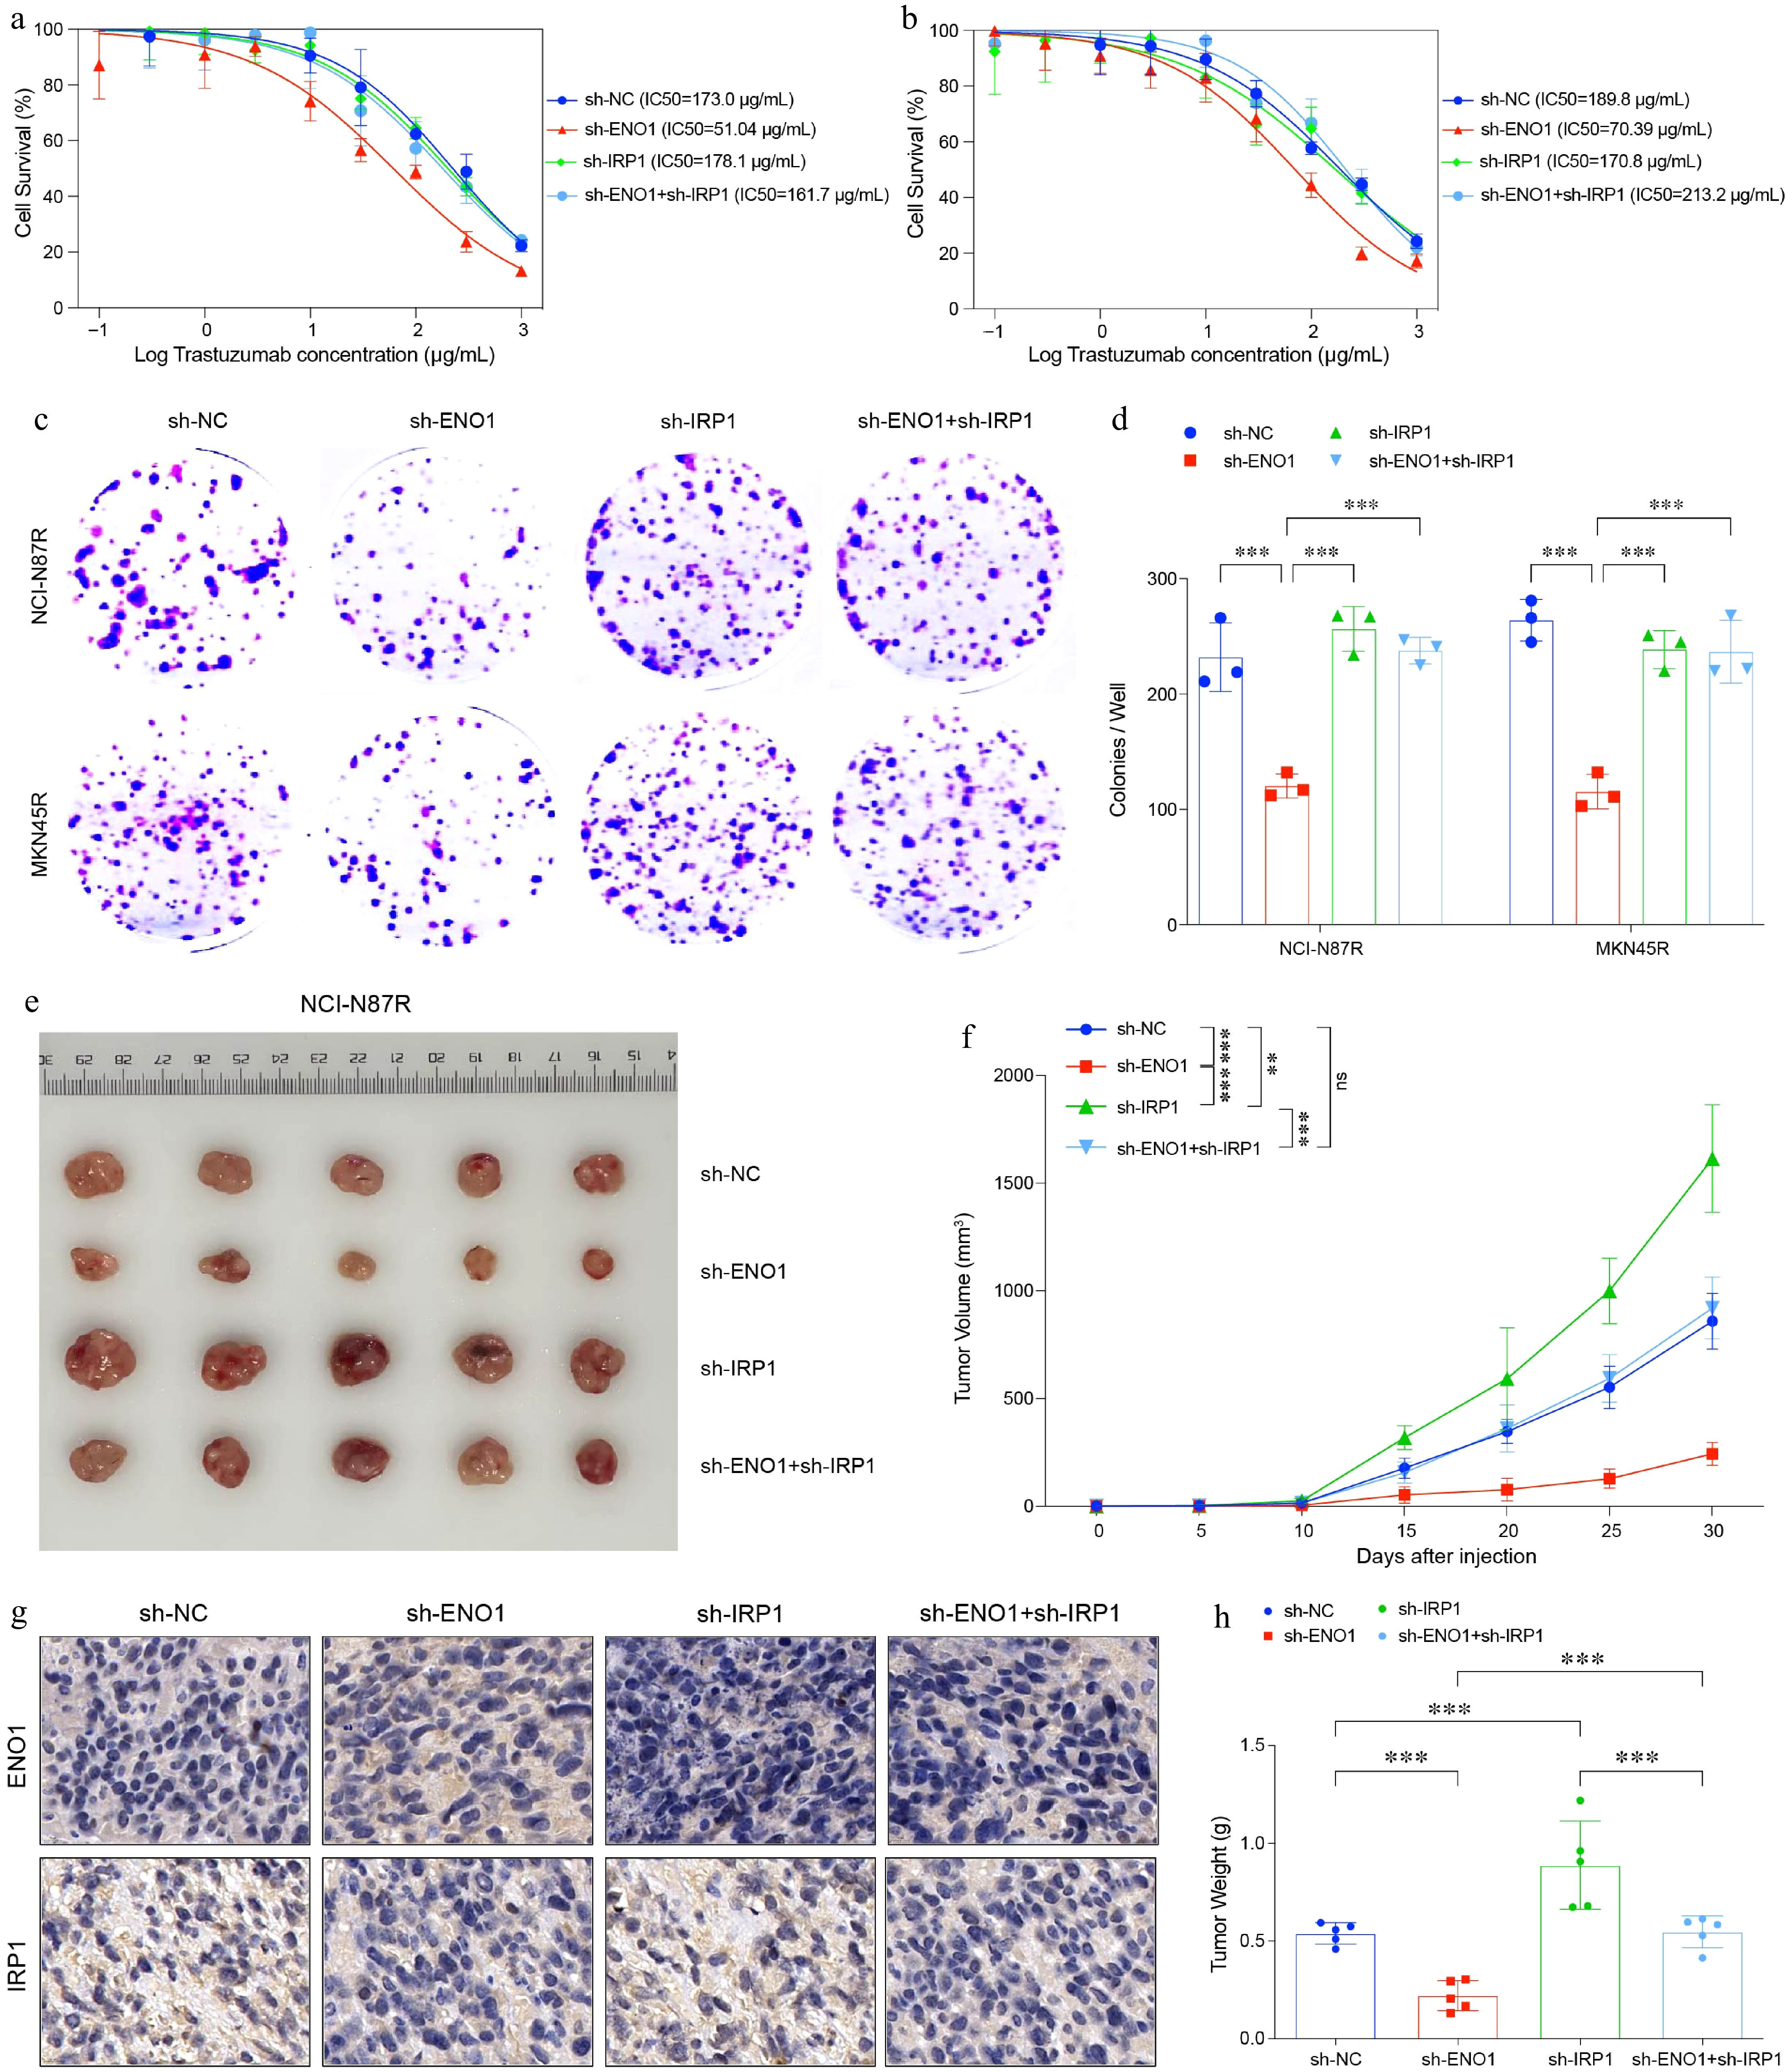
Figure 6.
IRP1 impaired cell survival, colony formation and tumor growth in gastric cancer. (a) and (b) Curves of cell viability assay for modified gastric cancer cell lines. (a) NCI-N87R. (b) MKN45R. (c) and (d) Colony formation assay results for modified gastric cancer cell lines. The experiment was performed with three biological replicates (N = 3). (e) Balb/c Nu mice were injected subcutaneously with 1 × 10⁷ tumor cells and housed under standard conditions. Trastuzumab (30 mg/kg) was administered intraperitoneally every 5 d. Tumor size was measured every 5 d until day 30, after which the tumors were photographed, excised, and fixed in formalin. Tumor volume diagram with five biological replicates (N = 5). (f) Tumor growth curves corresponding to (e). (g) Representative IHC staining results from (e). (h) Box plots illustrated tumor weight in (e). All statistical analyses were performed using the Tukey's multiple-comparison test. *** p < 0.001.
-
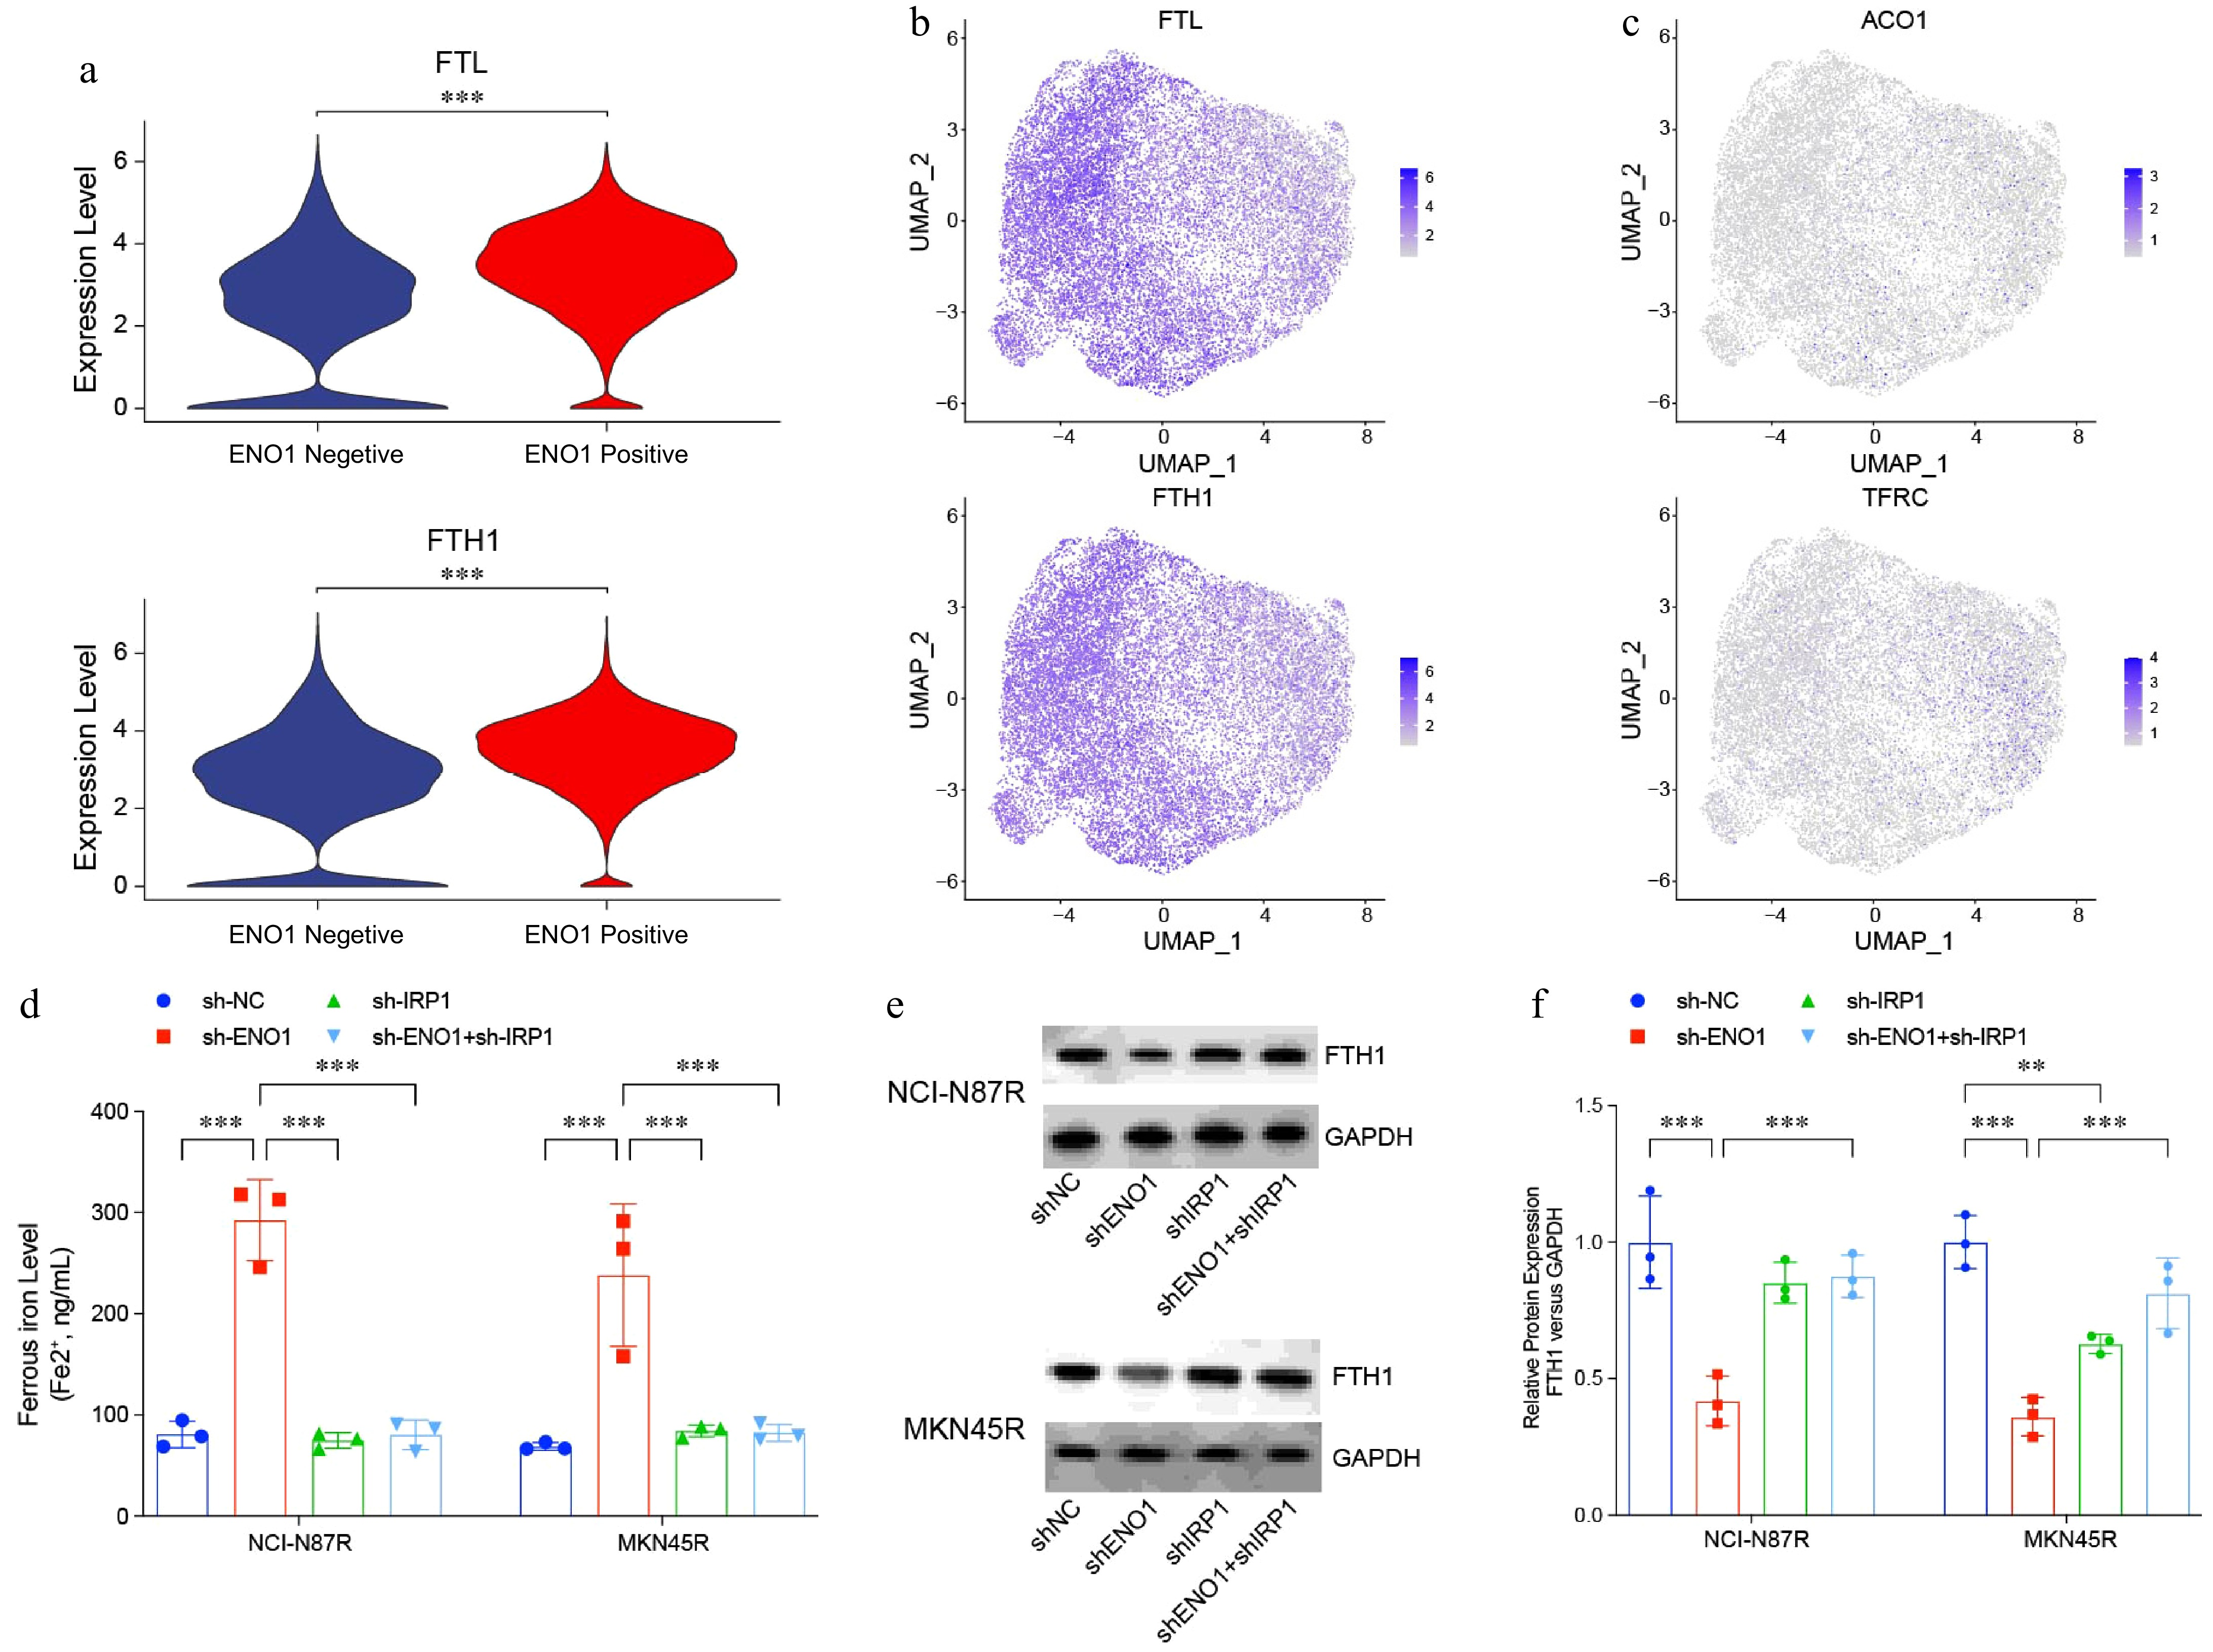
Figure 7.
IRP1 regulated ferroptosis in gastric cancer cells. (a) and (b) Violin and UMAP plots visualizing expression of ferritin-encoding genes FTL and FTH1 in Fig. 1a. (c) UMAP plots visualizing expression of ferritin-encoding genes ACO1 and TRRC in Fig. 1a. (d) Ferrous iron levels in modified gastric cancer cell lines. (e) and (f) Western blotting analysis of ferritin levels in modified gastric cancer cell lines. The experiment was performed with three biological replicates (N = 3). Statistical analyses in (a) were performed using an unpaired, two-tailed Student's t-test, (d) and (f) were performed using the Tukey's multiple-comparison test. ** p < 0.01, *** p < 0.001.
-
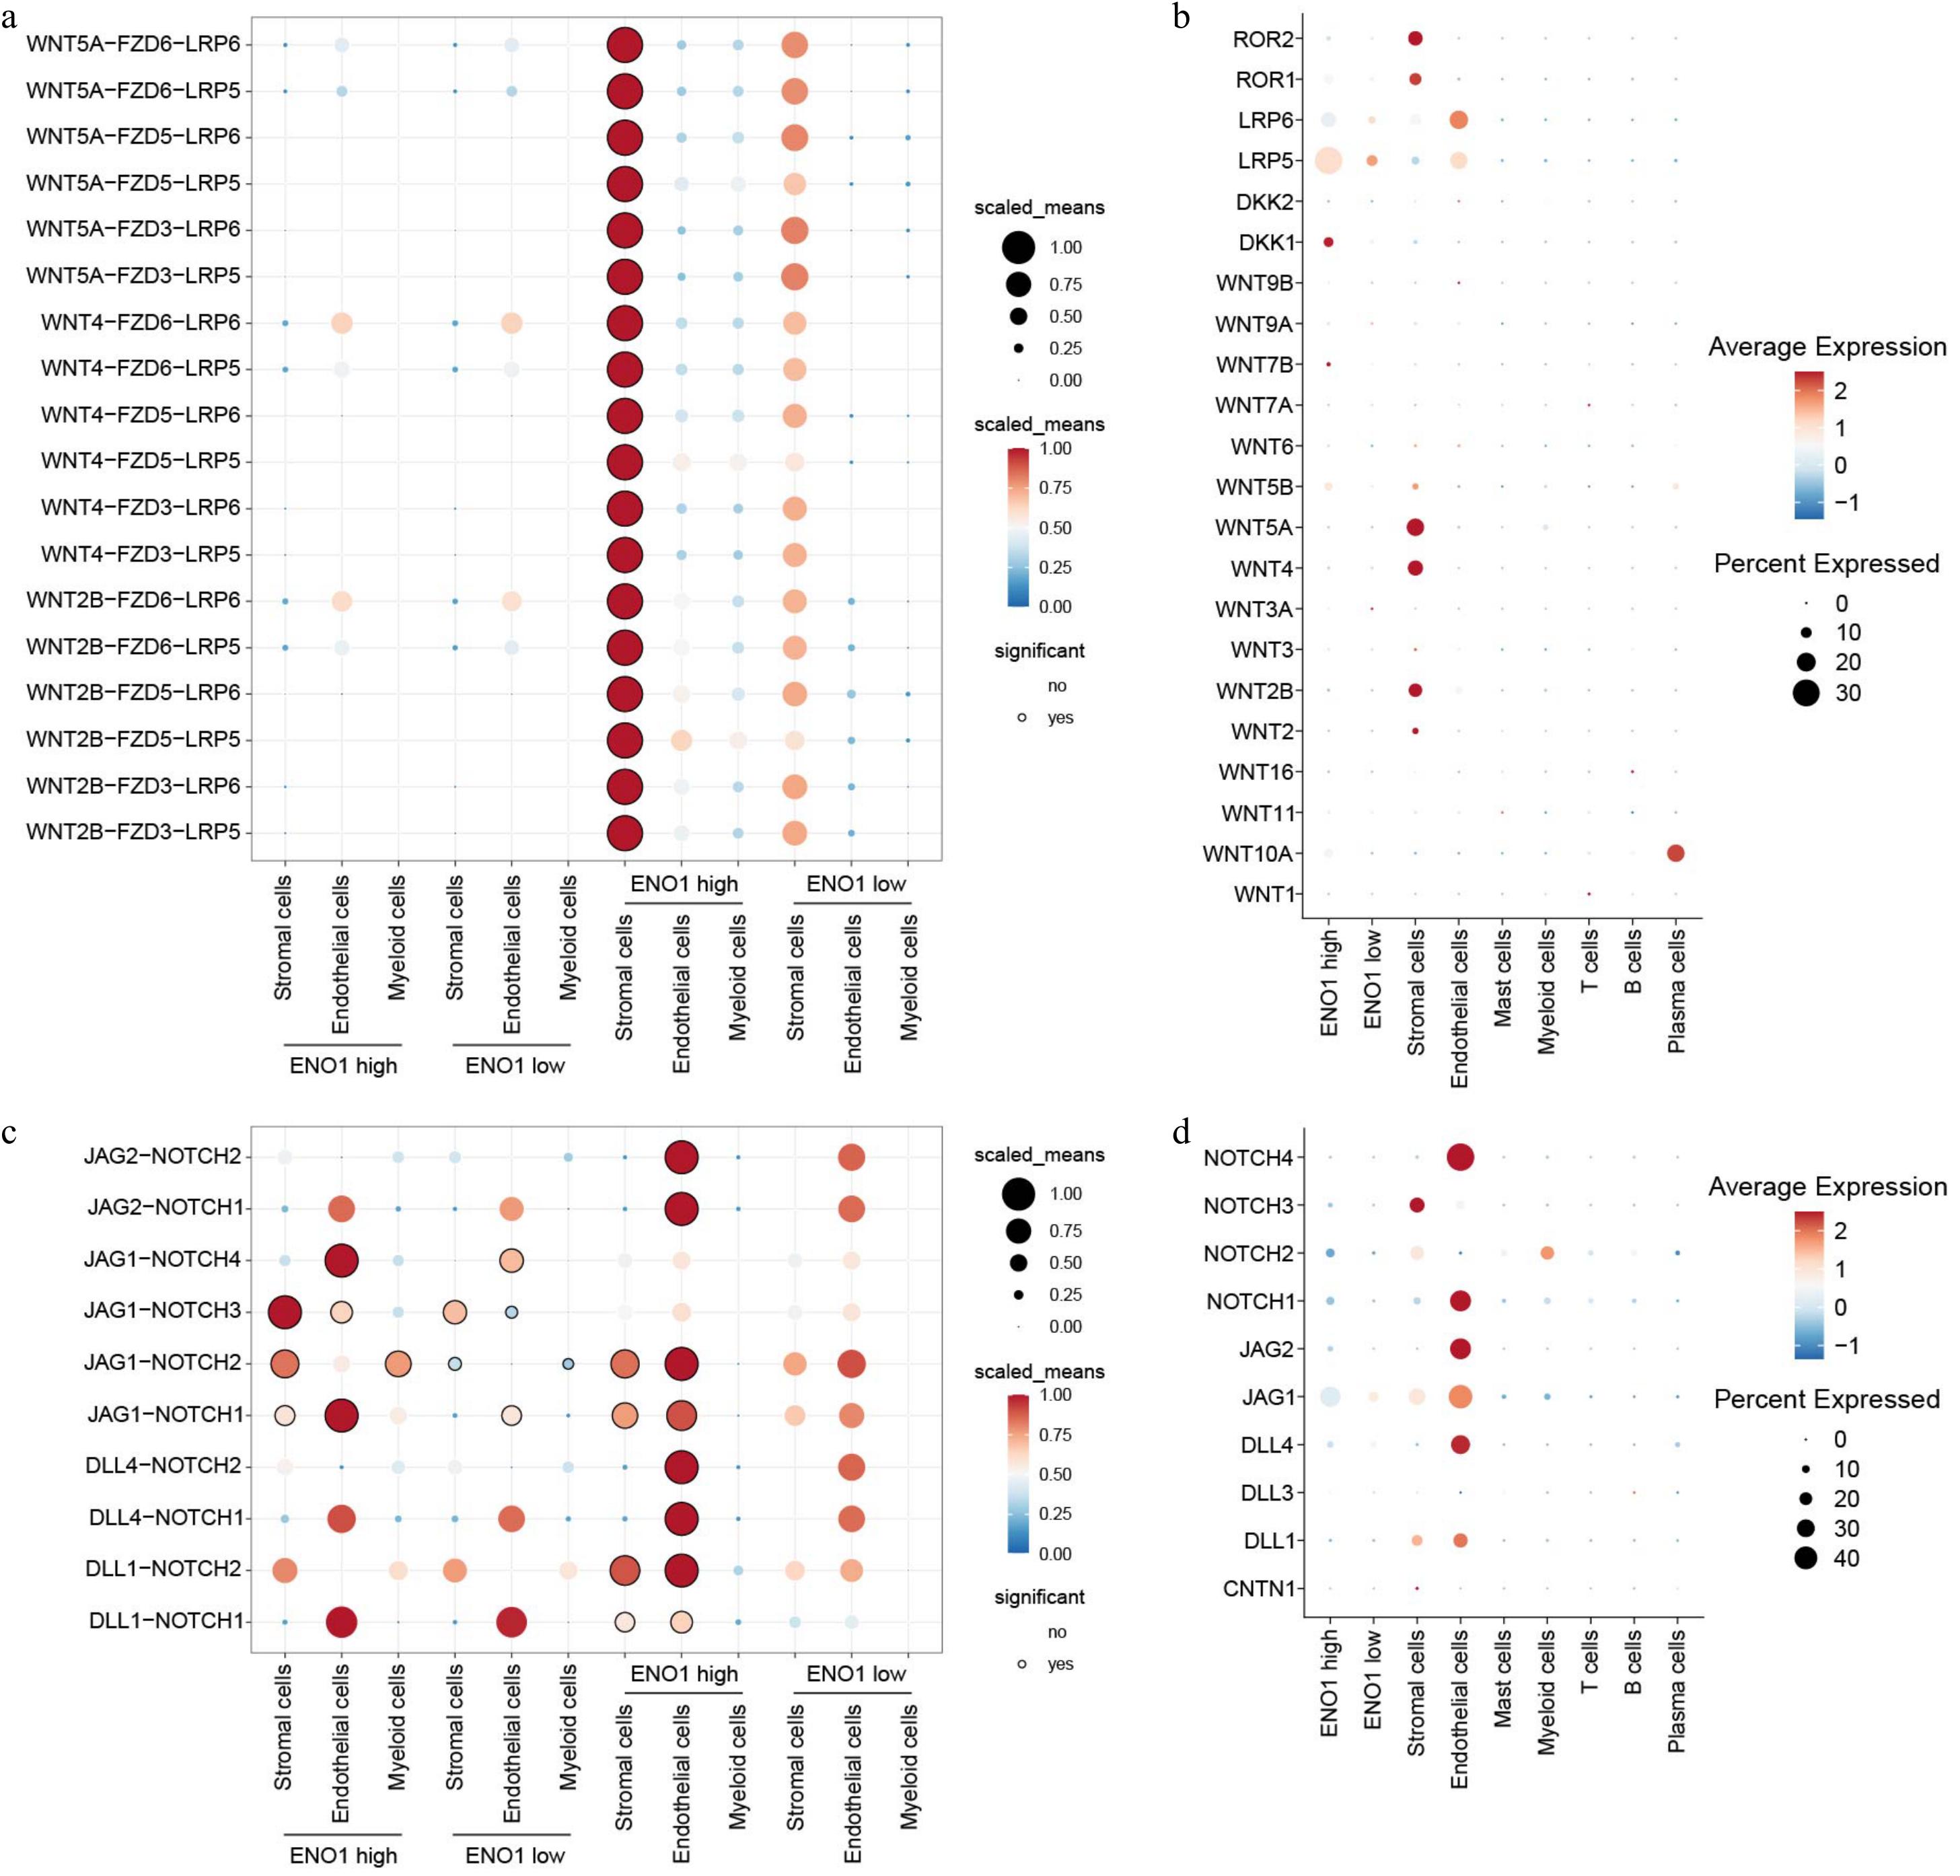
Figure 8.
ENO1 expression levels regulated ligand-receptor interactions of Wnt and Notch signaling pathways in different cell types. (a) Dot plot showing the interactions of the Wnt signaling pathways across different cell types. The color of the dots represents the number of receptor-ligand pairs involved in the interactions, while the size of the dots indicates the percentage of interacting cells. The black circles around the dots denote statistically significant interactions. (b) The expression of the corresponding genes in different cell populations from (a). The size of the circles represent the percentage of cells expressing the genes, and the color of the circles indicate the average expression levels. (c) Dot plot showing the interactions of the Notch signaling pathways across different cell types. (d) The expression of the corresponding genes in different cell populations from (c).
Figures
(8)
Tables
(0)