-
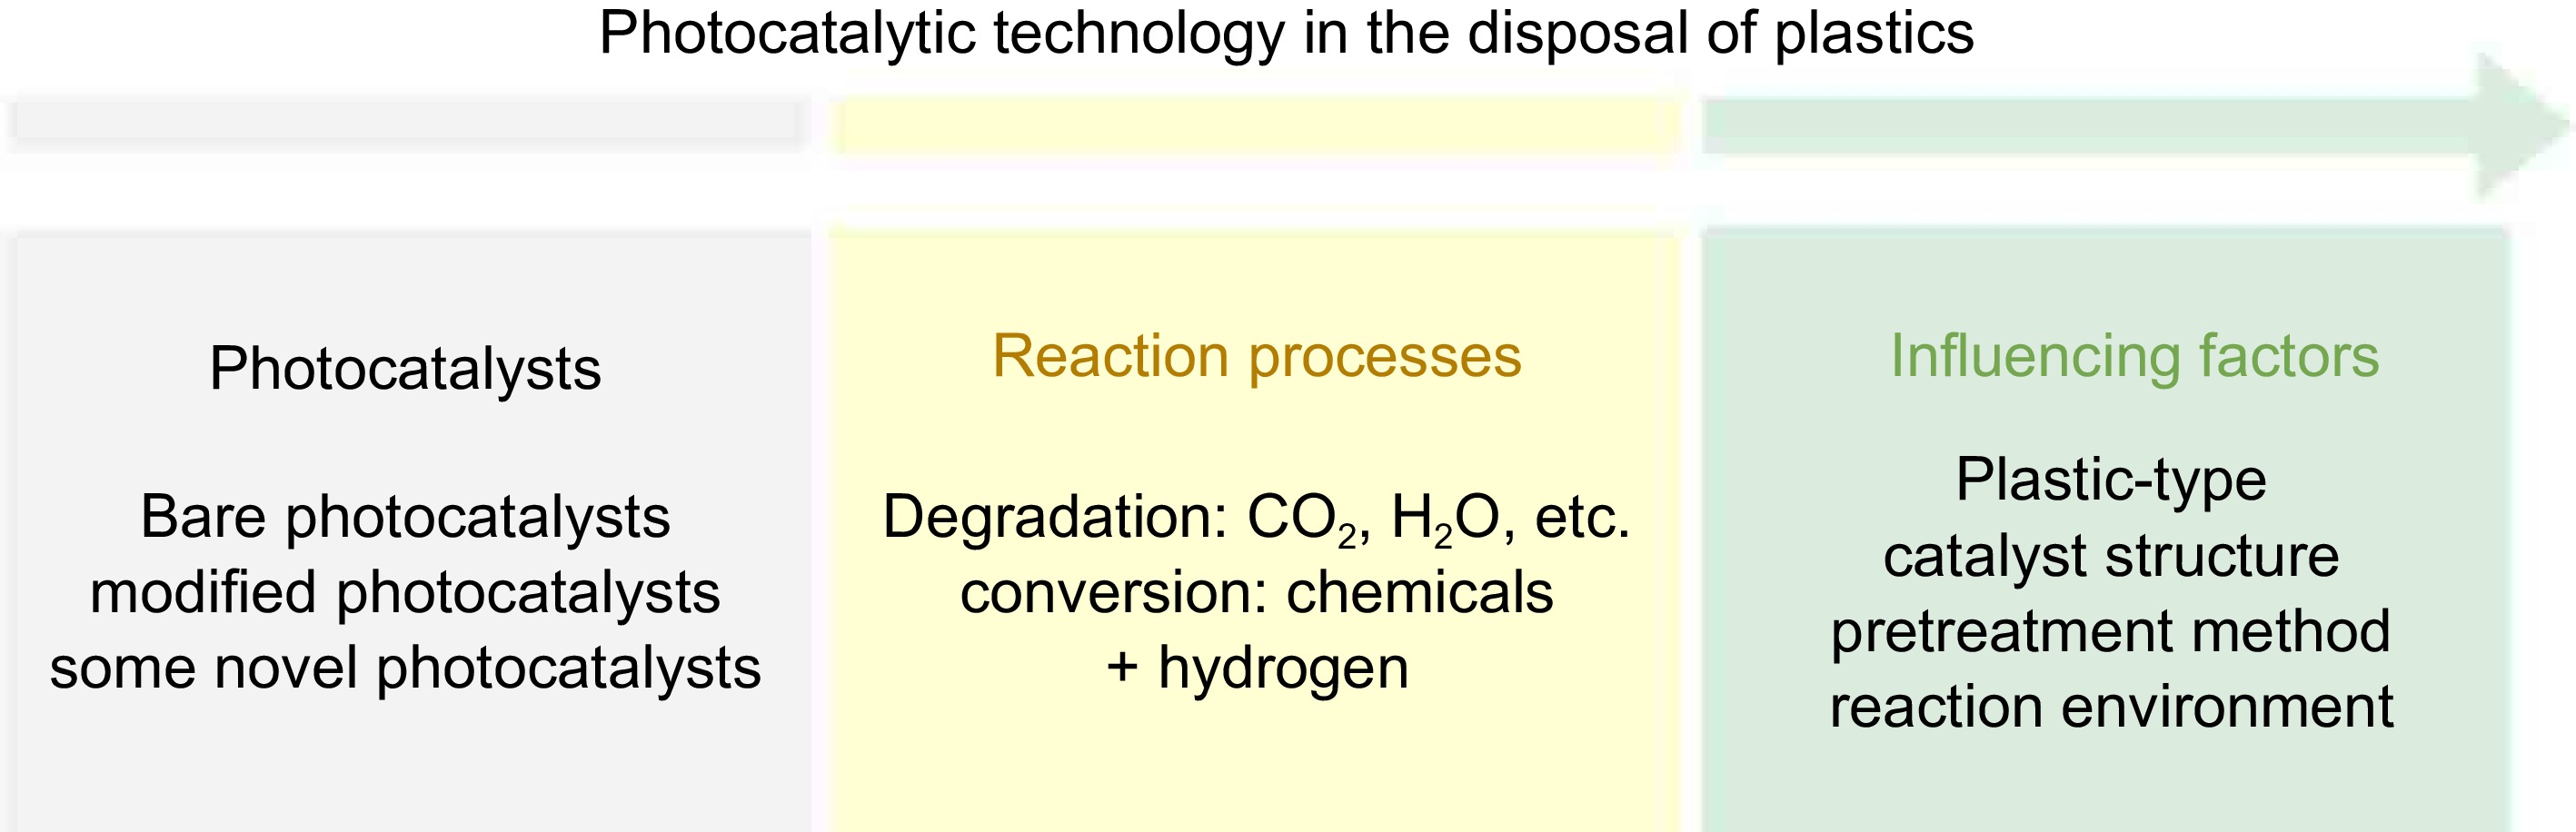
Figure 1.
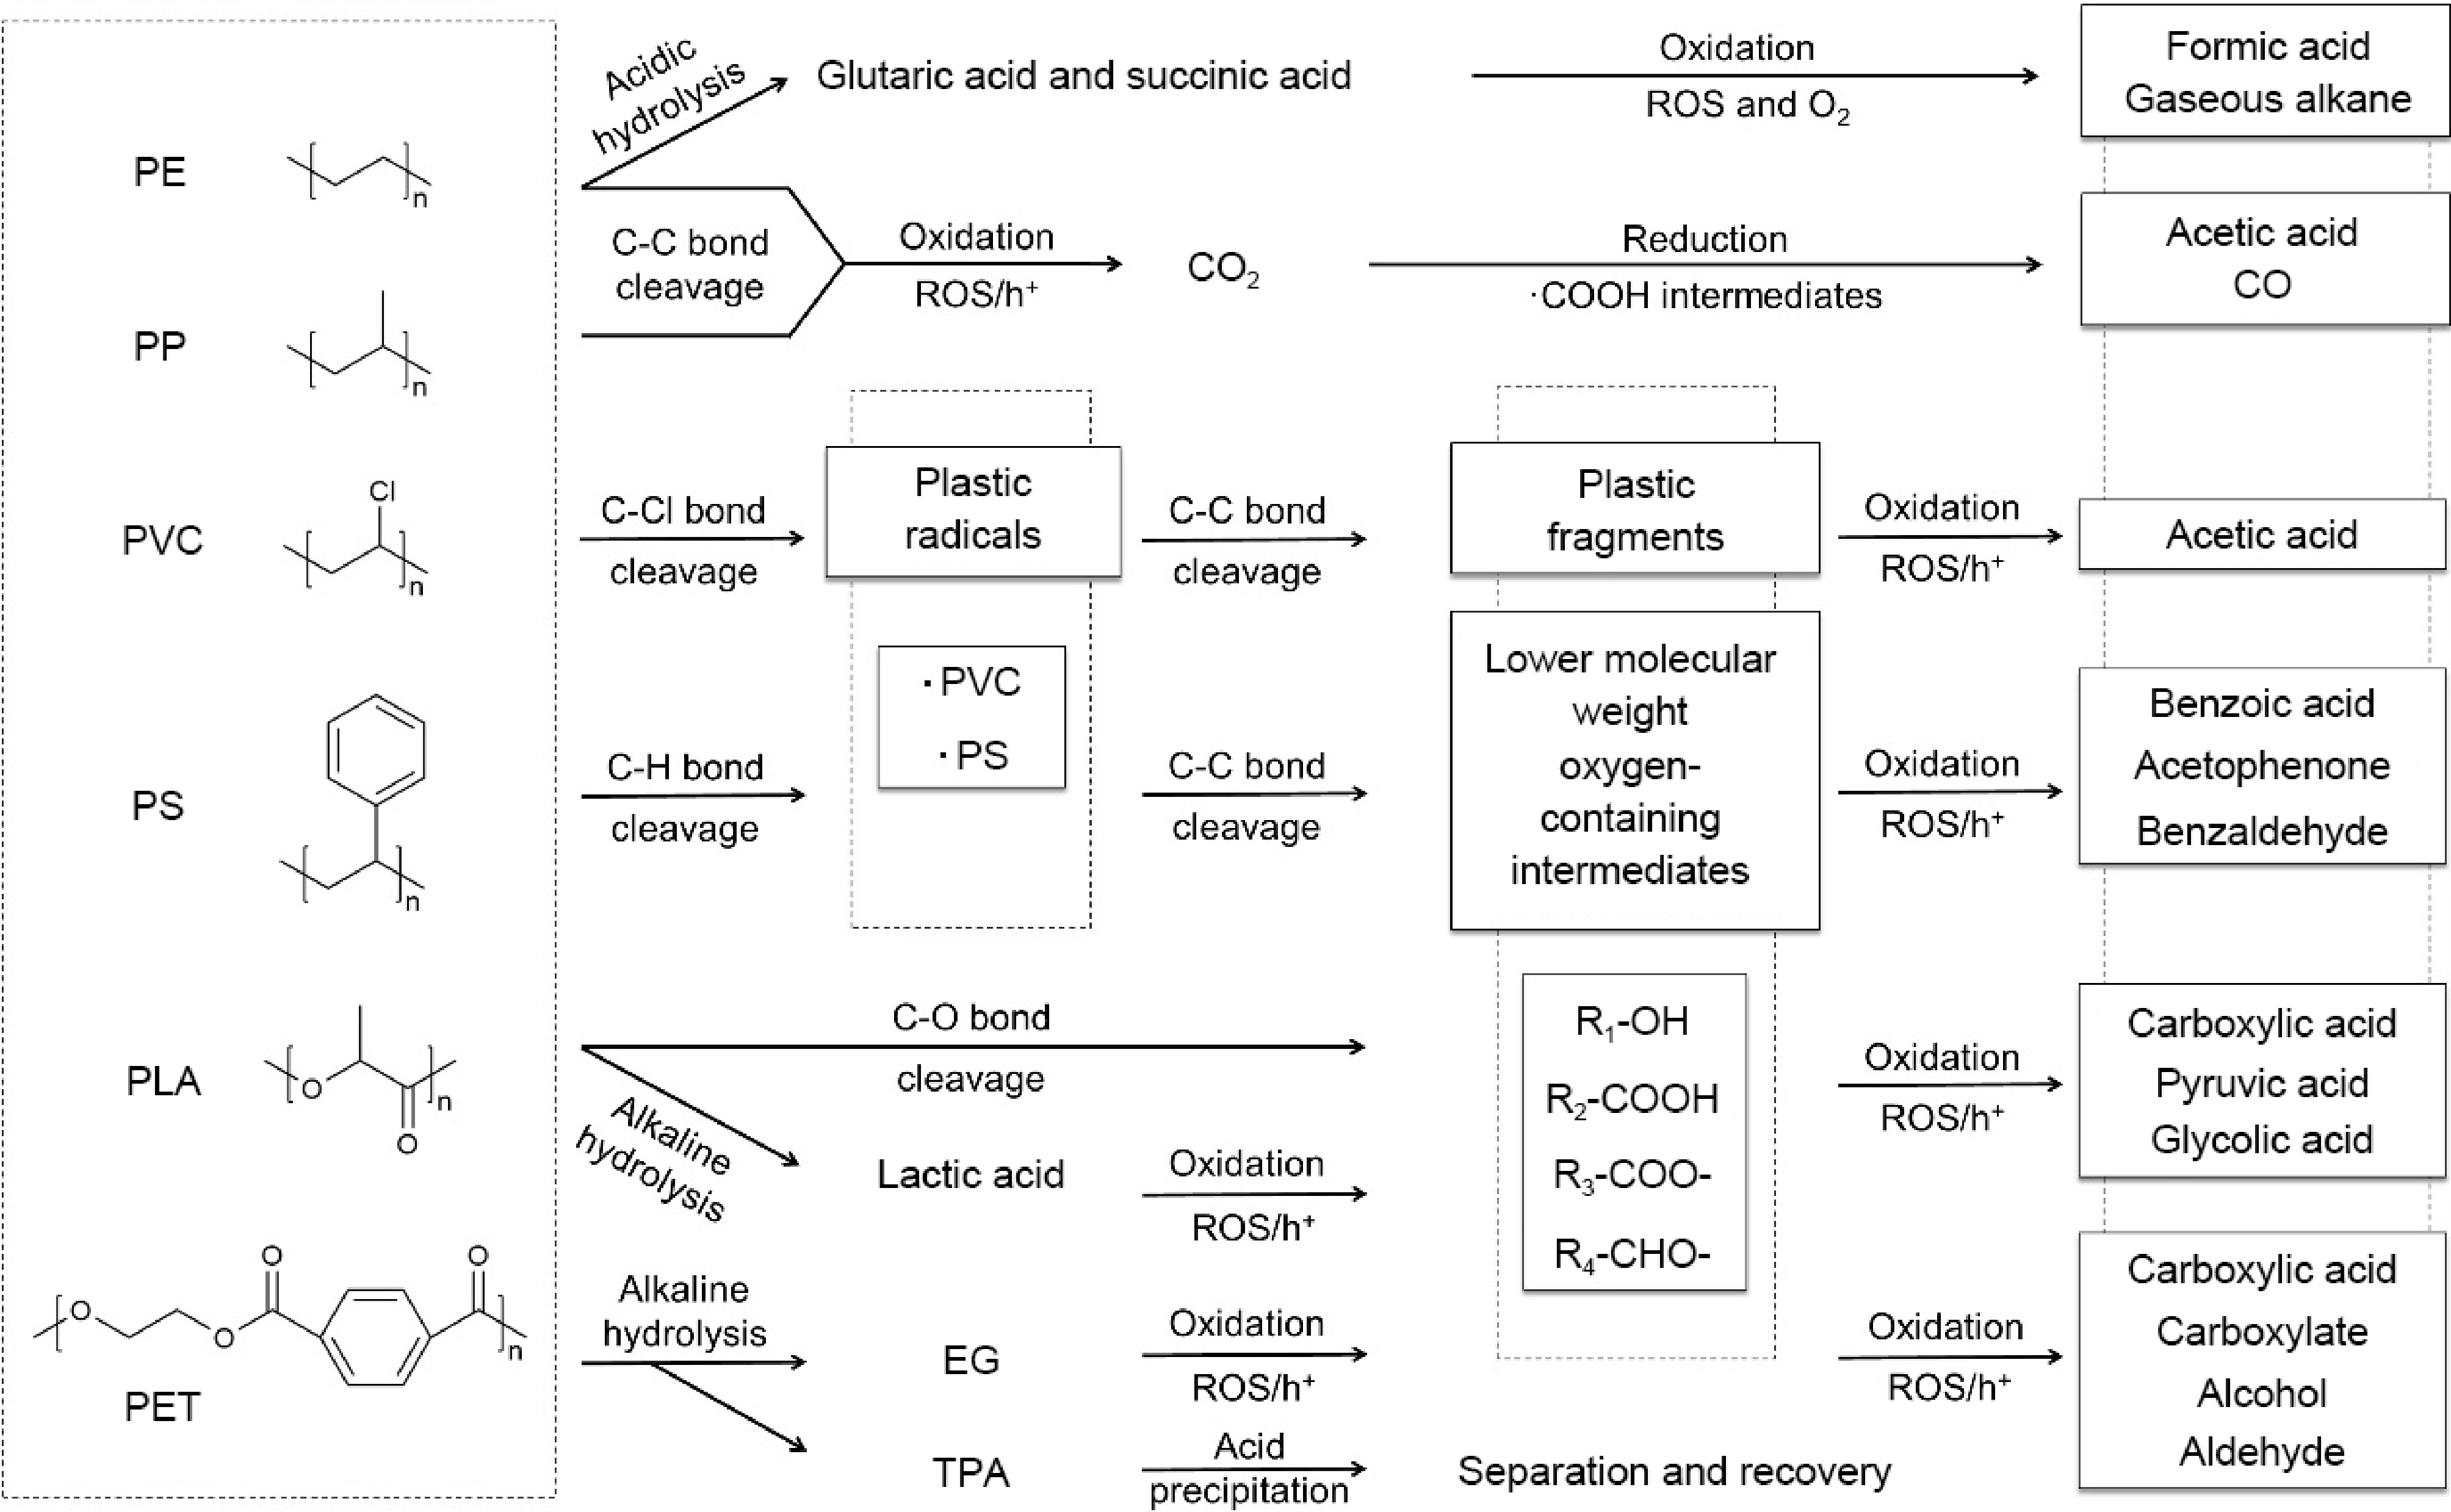
Scope of this review: from photocatalysts to reaction processes and influencing factors.
-
-
-
-
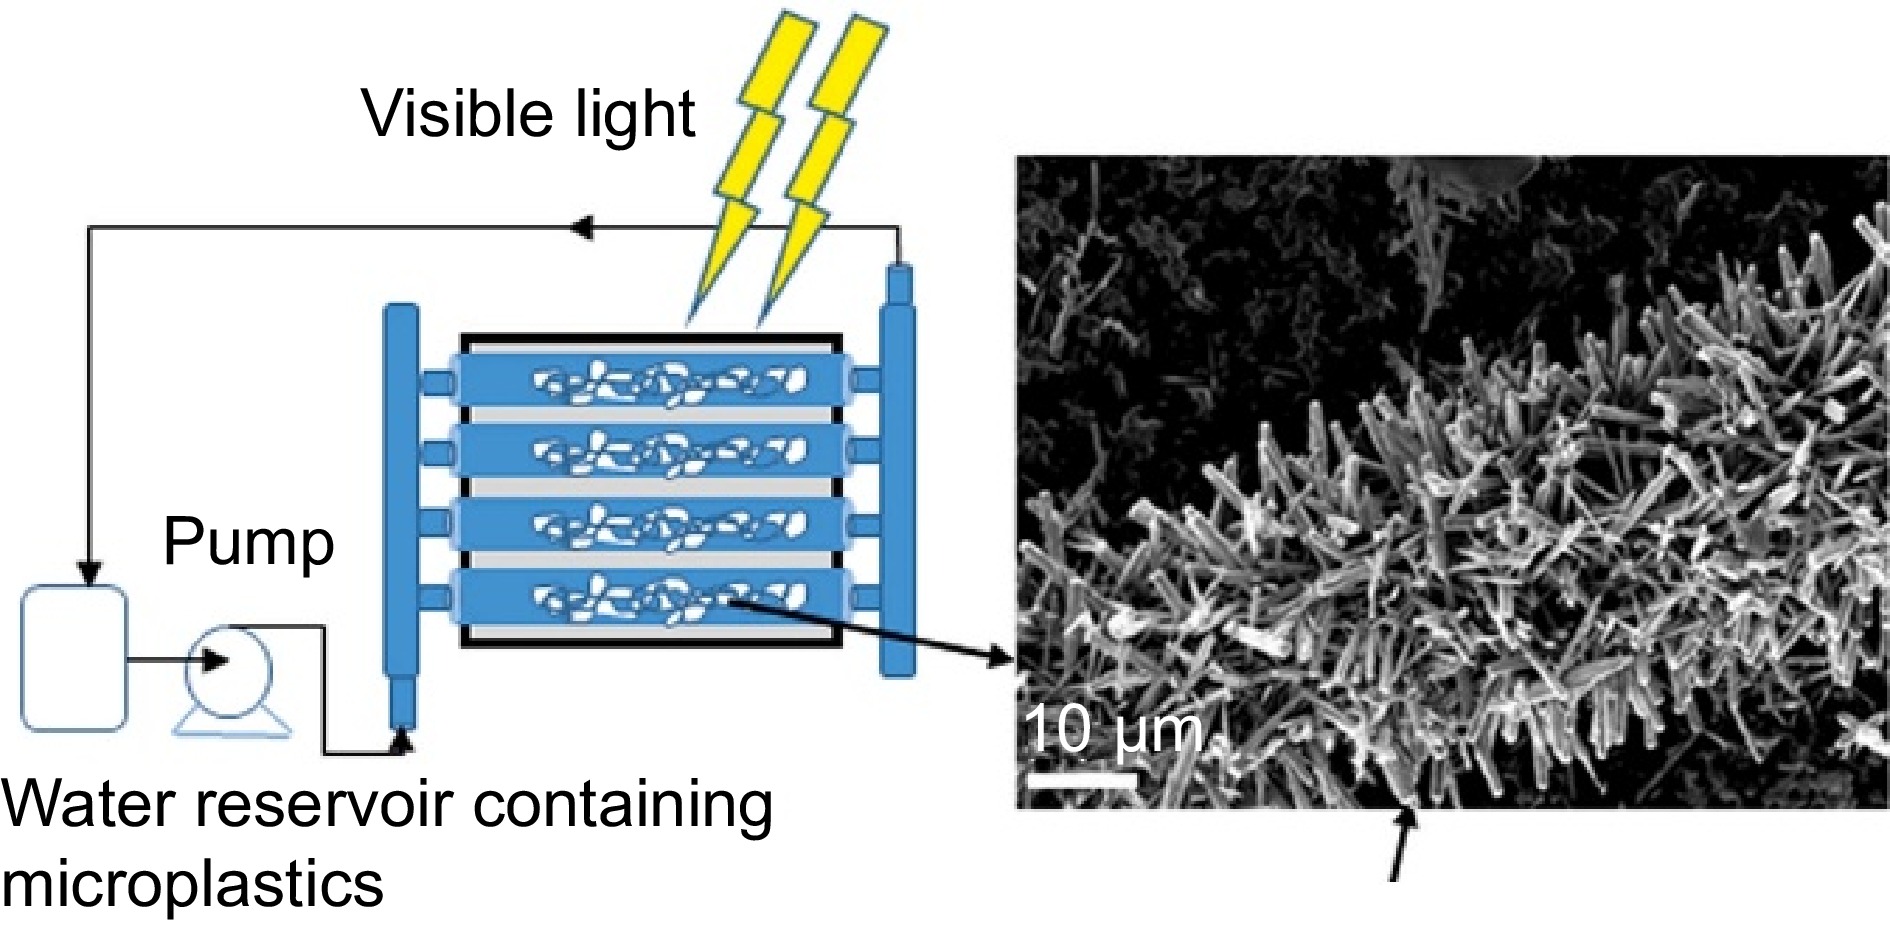
Figure 5.
Schematic diagram of the photocatalytic reactor (Source Ref. [68]).
-
-
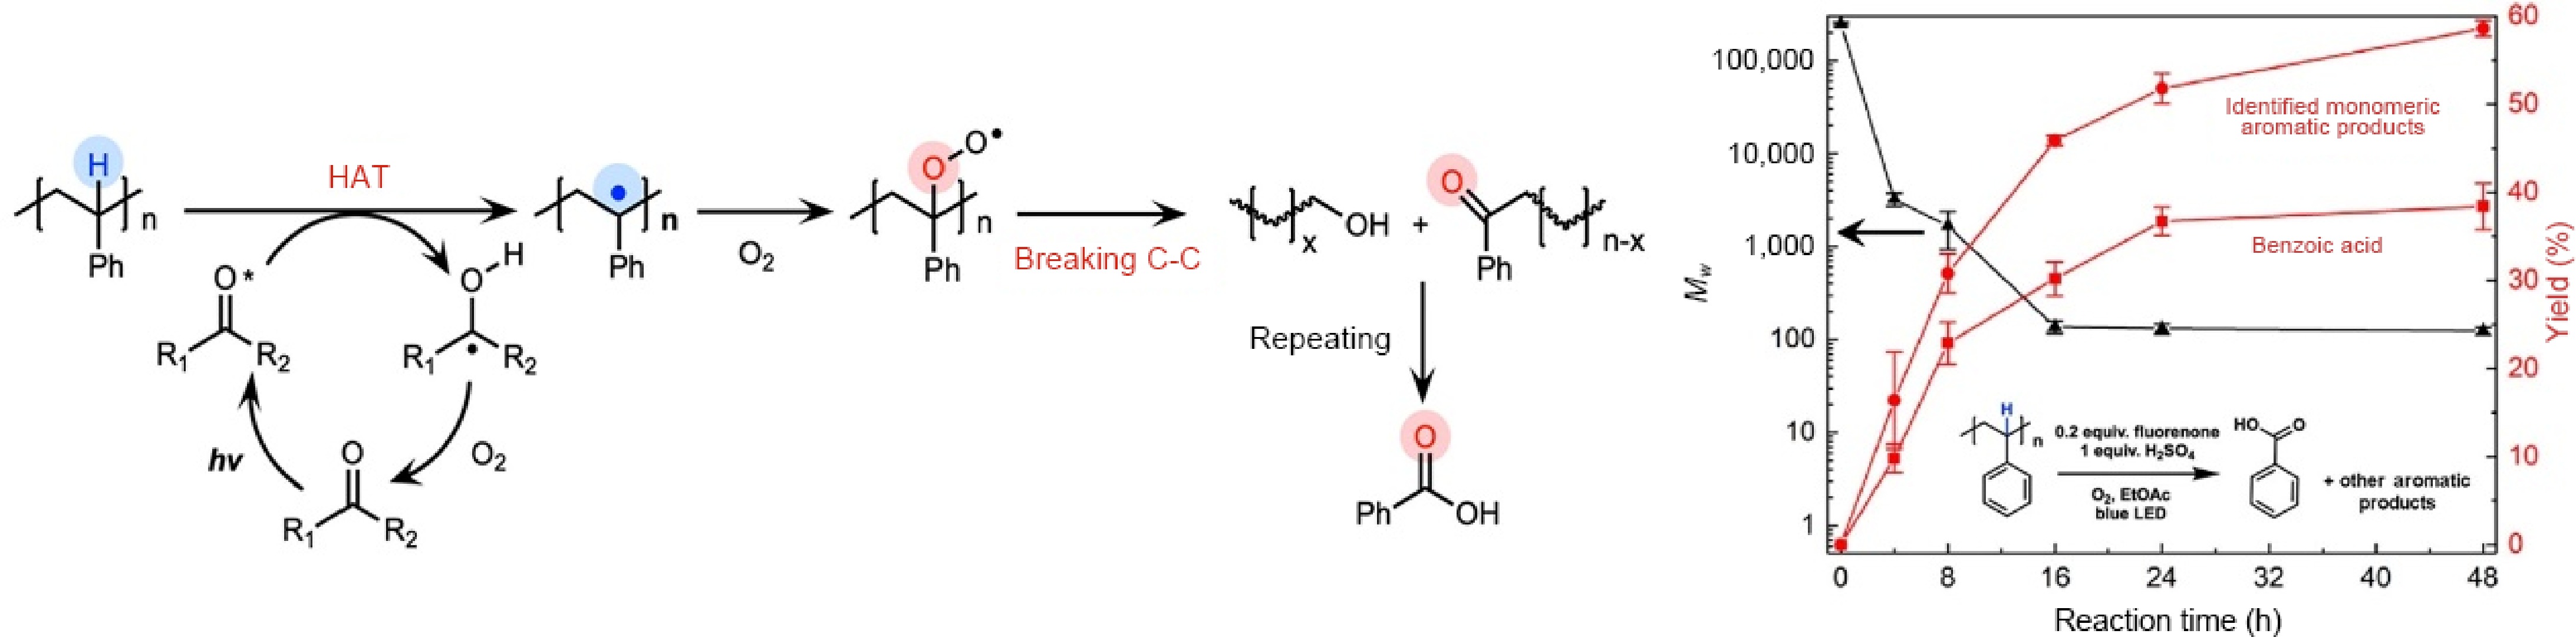
Figure 7.
Schematic illustration of the photocatalytic deconstruction of PS, and the yields of various products over the reaction time ( Source Ref. [80]).
-
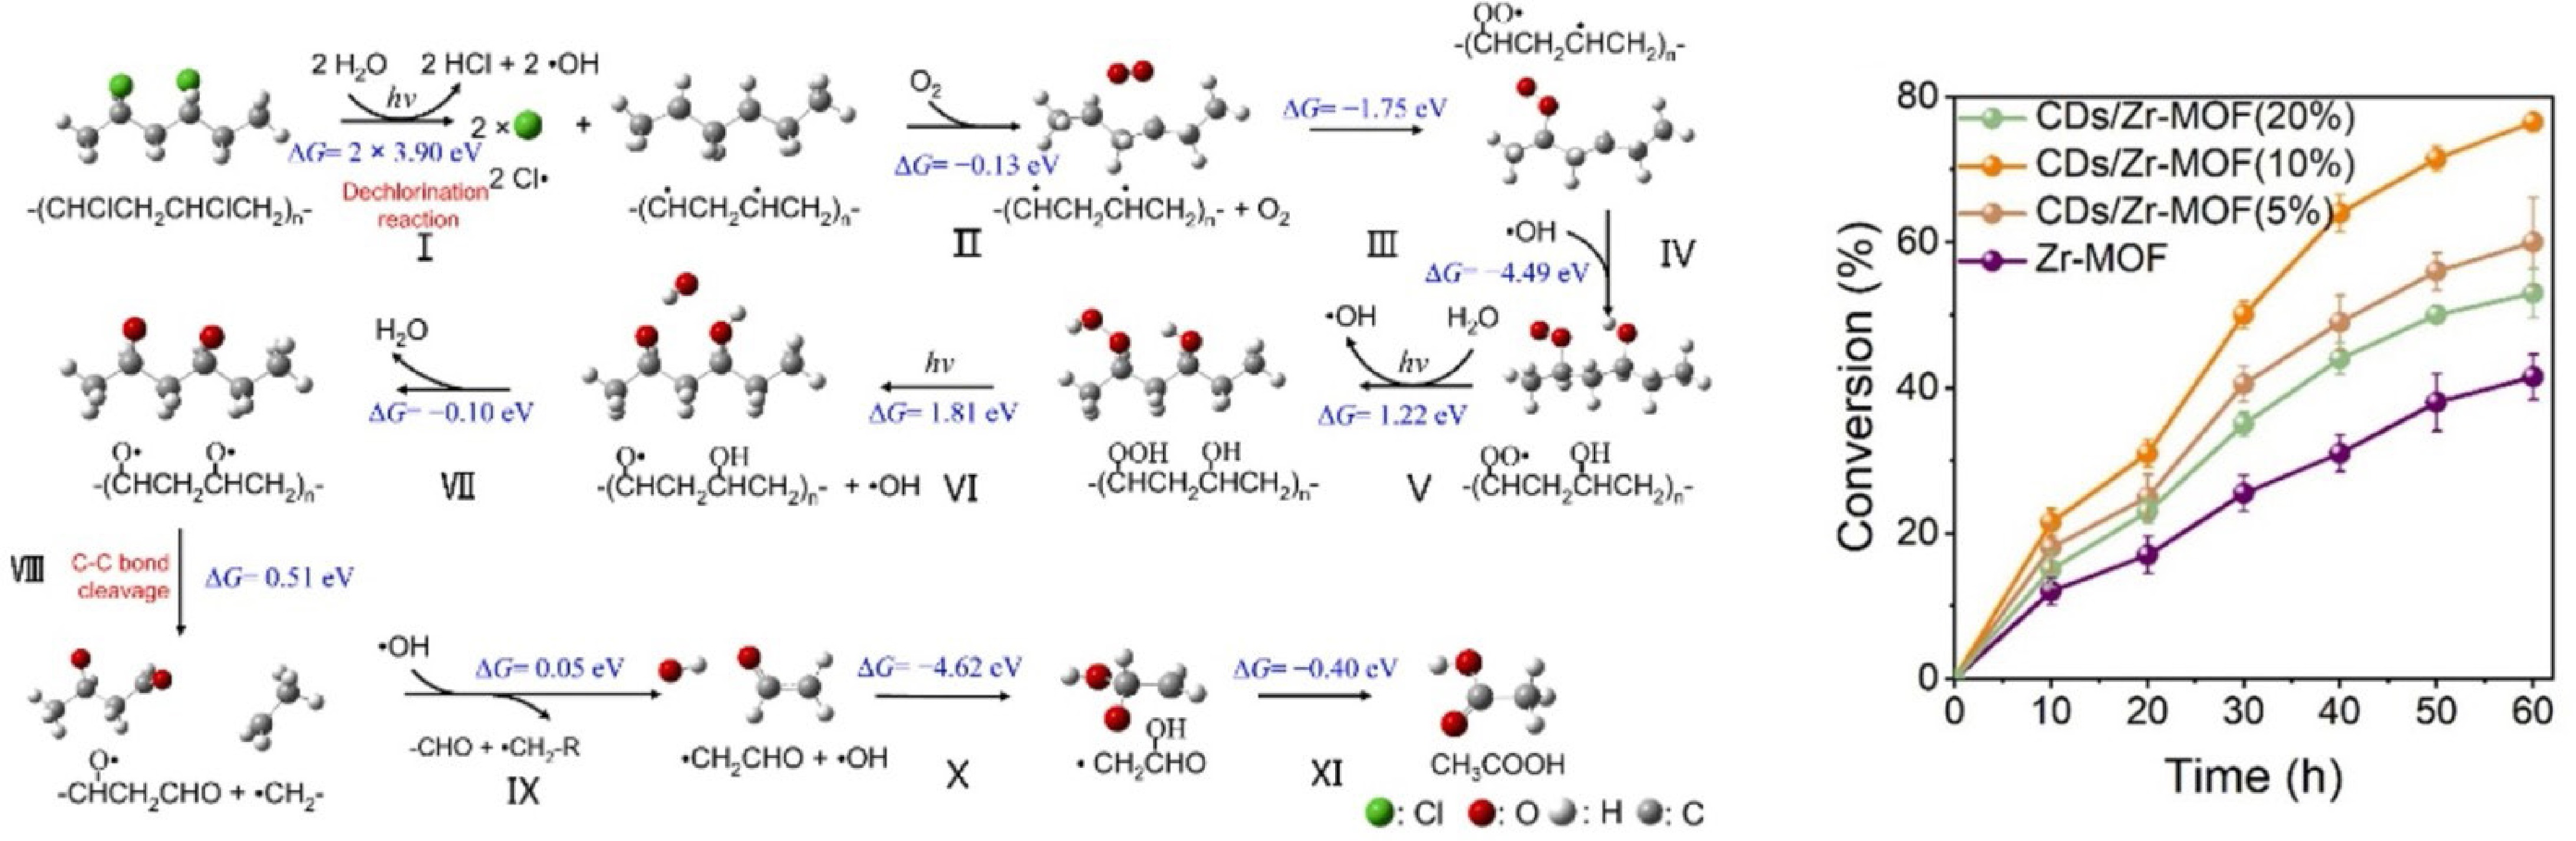
Figure 8.
Elementary pathways for the photocatalytic conversion of PVC to acetic acid, and PVC conversion activity over CDs/Zr-MOF (Source Ref. [82]).
-
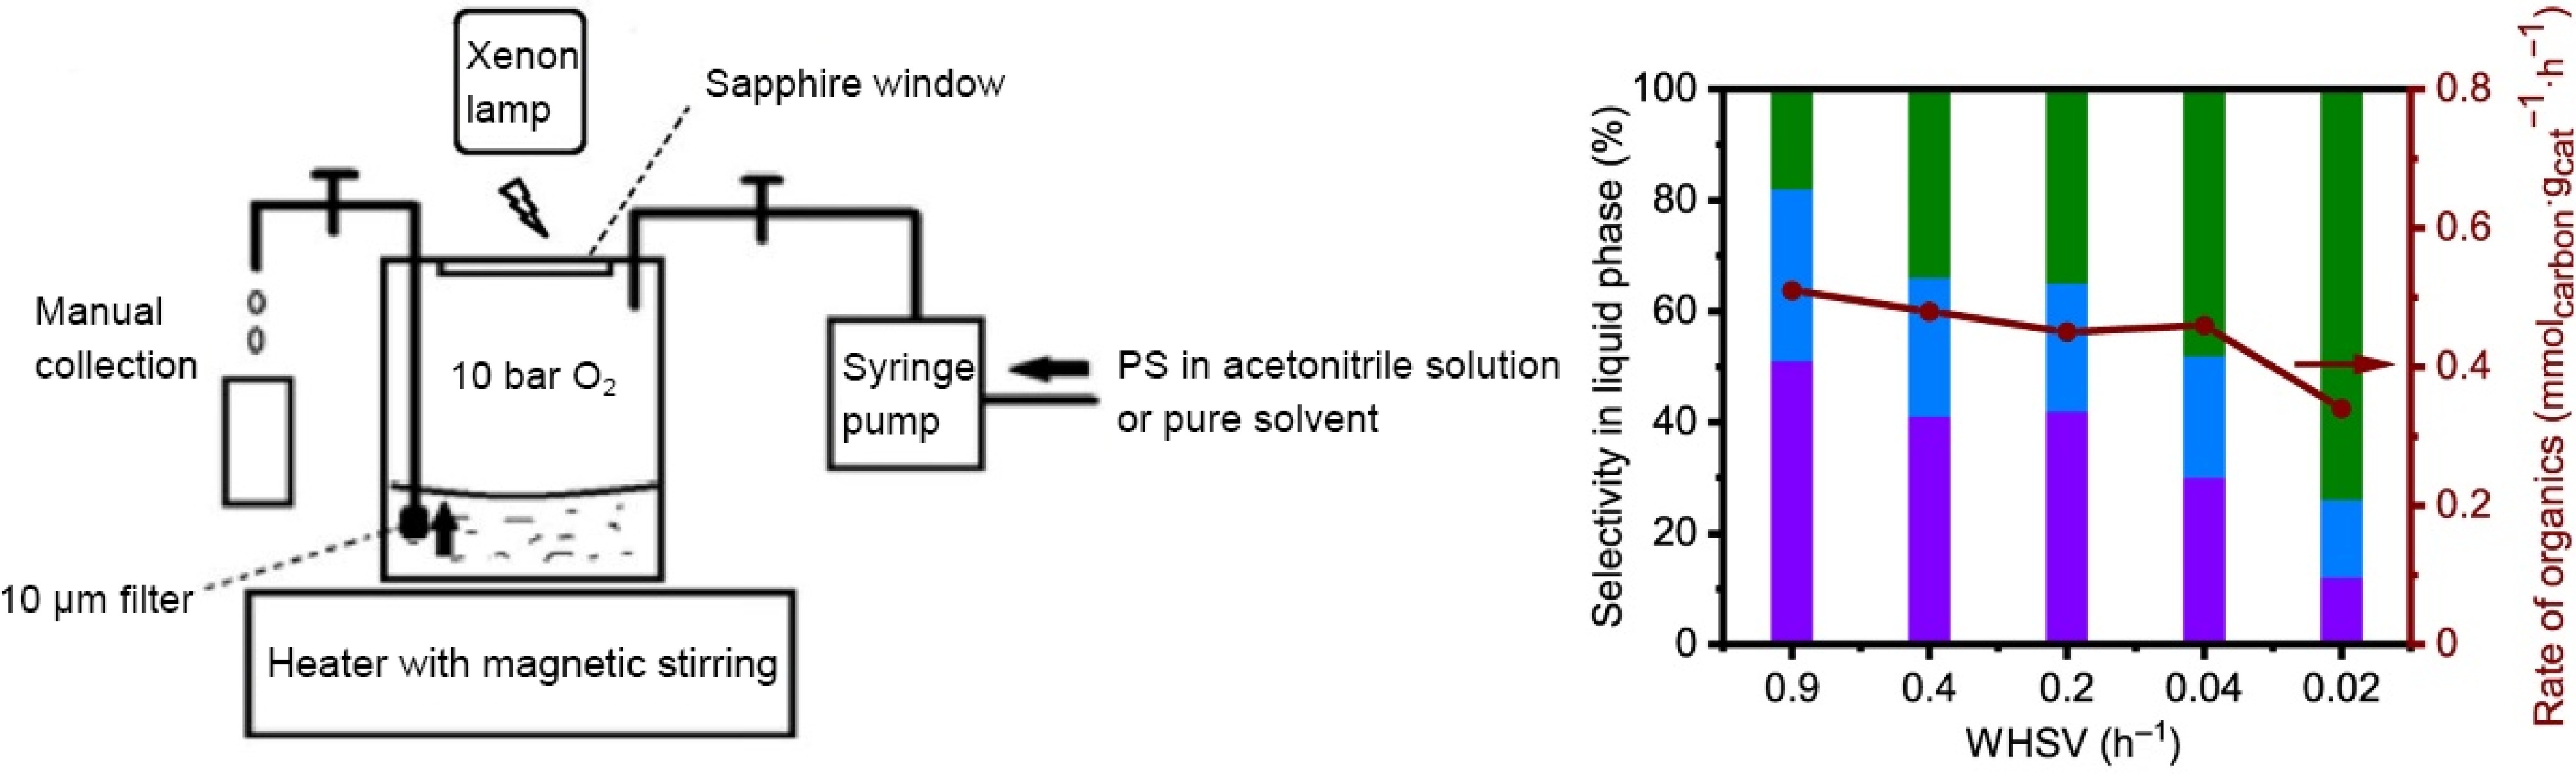
Figure 9.
Schematic diagram of PS oxidation reaction, and its activity and selectivity at different WHSV (Source Ref. [41]).
-
-
Photocatalysts Preparation methods Band gap
(eV)Light absorption (nm) Improvement Application Ref. Elementary doping Au/TiO2 Chemical deposition 2.40−2.98 586 Surface defects Hydrogen production of PET [45] F-TiO2 Immersion method 1.50 / Photogenerated carrier separation Degradation of PE [23] N-TiO2 Evaporation-induced self-assembly 3.10 400 Surface area; active sites Effect of size and shape of plastics [46] C, N-TiO2 Green bio-inspired synthesis 2.90 428 Surface area; photogenerated carrier separation Effect of pH and temperature in the photocatalytic process [47] Pt-(g-C3N4) Thermal polymerization 2.81 450 Chemical stability; photogenerated carrier separation Hydrogen production of PET [48] Heterojunction construction AgNbO3/Fe2O3 Liquid-phase epitaxy 2.50 580 Photogenerated carrier separation Degradation of PVC [49] g-C3N4/CuFeO2 Solution evaporation / 480−950 Active sites; photogenerated carrier separation Hydrogen production of PET and PLA [50] WO3/g-C3N4 Precipitation method 2.87 400 Surface area; photogenerated carrier separation Degradation of PET [51] VPOM/CNNS Facile electrostatic self-assembly / 460−600 Surface area; photogenerated carrier separation Conversion of PE [52] Electrochemical method KNbO3 Electric field polarization 2.98 410 Photogenerated carrier separation Degradation of PP [53] TiO2 Anodization 3.11 / Surface defects; photogenerated carrier separation; multilayer structure Degradation of PS [54] Cu2O/CuO Anodization 1.84 / Porous structure; photogenerated carrier separation Degradation of PS [30] Cocatalyst loading CN-CNTs-NM In-situ derivatization 2.40 / Porous structure; tight interaction; intensive absorption Hydrogen production of PET [16] Defect engineering Bi4V2O11 Solvothermal method 2.36 / Regulable O-vacancy concentration Conversion of PET [55] Surface photosensitization BiOCl Precipitation method / 218−304 Wide absorption band; tensile strength dropped dramatically Degradation of PS [56] Table 1.
Modified photocatalysts and their characteristics.
-
Plastics Photocatalysts Light source Time (h) Efficiency Ref. PE BiOCl 250 W Xenon lamp 5 5.38% [66] NiAl2O4 350 W Metal halide lamp 5 12.50% [71] F-TiO2 4.8 W UVA–LED lamp 540 48.00% [23] TiO2/ZnO 365 nm UV light 480 100.00% [67] Bi4Ti3O12 300 W Xenon lamp 6 38.27% [28] PP KNbO3 150 W Xenon lamp / 28.3
mg·gcat−1·h−1
(CO2)[53] ZnO 120 W Tungsten-halogen lamp 336 65.00% [68] PS TiO2 UV lamp 24 99.99% [69] TiO2 UV lamp 50 23.50% [54] CuxO 50 W LED lamp 50 18%~23% [30] CuMgAlTi-R400 50 W Xenon lamp 300 54.20% [20] PVC PVC-TiO2@PANI 30 W UV lamp 720 67.00% [70] Nano-G/TiO2 300 W Medium-pressure UV light 30 17.24% [72] AgNbO3/Fe2O3 350 W Xenon lamp 2 46.53% [49] g-C3N4 Xenon lamp 120 13.08% [73] Table 2.
Recent studies on the photocatalytic degradation of plastics.
-
Plastics Photocatalysts Light source Products Activity Selectivity Ref. PS F-g-C3N4 250 W Hydrargyrum lamp Acetophenone 72.80% conversion 81.60% [85] Benzoic acid 18.40% g-C3N4 300 W Xenon lamp Aromatic oxygenates 100.00% conversion 59.00% [41] PVC CDs/Zr-MOF 300 W Xenon lamp Acetic acid 2.56 mg·g−1·h−1 ~76.50% [82] Pt-decorated Bi12O17Cl2 300 W Xenon lamp Acetic acid 6.07 mg·g−1·h−1 94.00% [78] PLA 300 W Xenon lamp Formic acid 47.43 mg·g−1·h−1 55.10% ZnO/UiO66-NH2 300 W Xenon lamp Acetic acid 14.40% yield 91.60% [79] Ni2P/ZnIn2S4 white LED light source Pyruvic acid 745.90 μmol·g−1·h−1 >90.00% [86] PAN@(FeCoNiCuZn)WO4 300 W Xenon lamp Acetic acid 38.51 mg·g−1·h−1 73.00% [87] PET CPDs-CN 300 W Xenon lamp Glycolic acid 383.00 μmol/8 d ~27.00% [84] Acetic acid 554.00 μmol/8 d ~40.00% Table 3.
Recent studies on the selectivity of photocatalytic conversion.
-
Photocatalysts Plastics Light source Amount of photocatalysts H2 production
(mmol·g−1·h−1)Year Ref. CdS/CdOx 50 mg·mL−1 PLA in 10 M KOH Simulated solar light 1.0 nmol 64.300 2018 [36] CNx|Ni2P 25 mg·mL−1 PLA in 1 M KOH Simulated solar light 3.2 mg 0.178 2019 [40] MoS2/CdxZn1-xS 25 mg·mL−1 PET in 10 M NaOH 300 W Xenon lamp 10.0 mg 15.900 2020 [21] MXene/ZnxCd1-xS 50 mL PET 300 W Xenon lamp 10.0 mg 14.170 2021 [24] Pt-loaded BSx−CNs 10 mg·mL−1 PLA in 1 M KOH 300 W Xenon lamp 10.0 mg 1.890 2021 [94] CN-CNTs-NiMo 50 mg·mL−1 PET in 5 M KOH 500 W Xenon lamp 10.0 mg 0.086 2022 [16] Ag2O/Fe-MOF 5 mg·mL−1 PET in DI water 300 W Xenon lamp 100.0 mg 1.900 2022 [27] Au/TiO2 50 mg·mL−1 PET in 3 M KOH 160 W high-pressure
UV mercury vapor lamp500.0 mg 0.001 2023 [45] d-NiPS3/CdS 10 mg·mL−1 PLA in 2 M KOH 300 W Xenon lamp 1.0 mg 39.760 2023 [37] ZnIn2S4 25 mg·mL−1 PET in 1 M KOH CEAULight 7.5 mg 143.600 2023 [77] CdS/NiS 100 mg·mL−1 PLA in 10 M KOH 300 W Xenon lamp 5.0 mg 62.900 2023 [22] Pt-loaded g-C3N4 20 mg·mL−1 PET in 5 M NaOH 100 W Xenon lamp 100.0 mg 7.330 2023 [48] Table 4.
Recent studies on the hydrogen production.
Figures
(10)
Tables
(4)