-
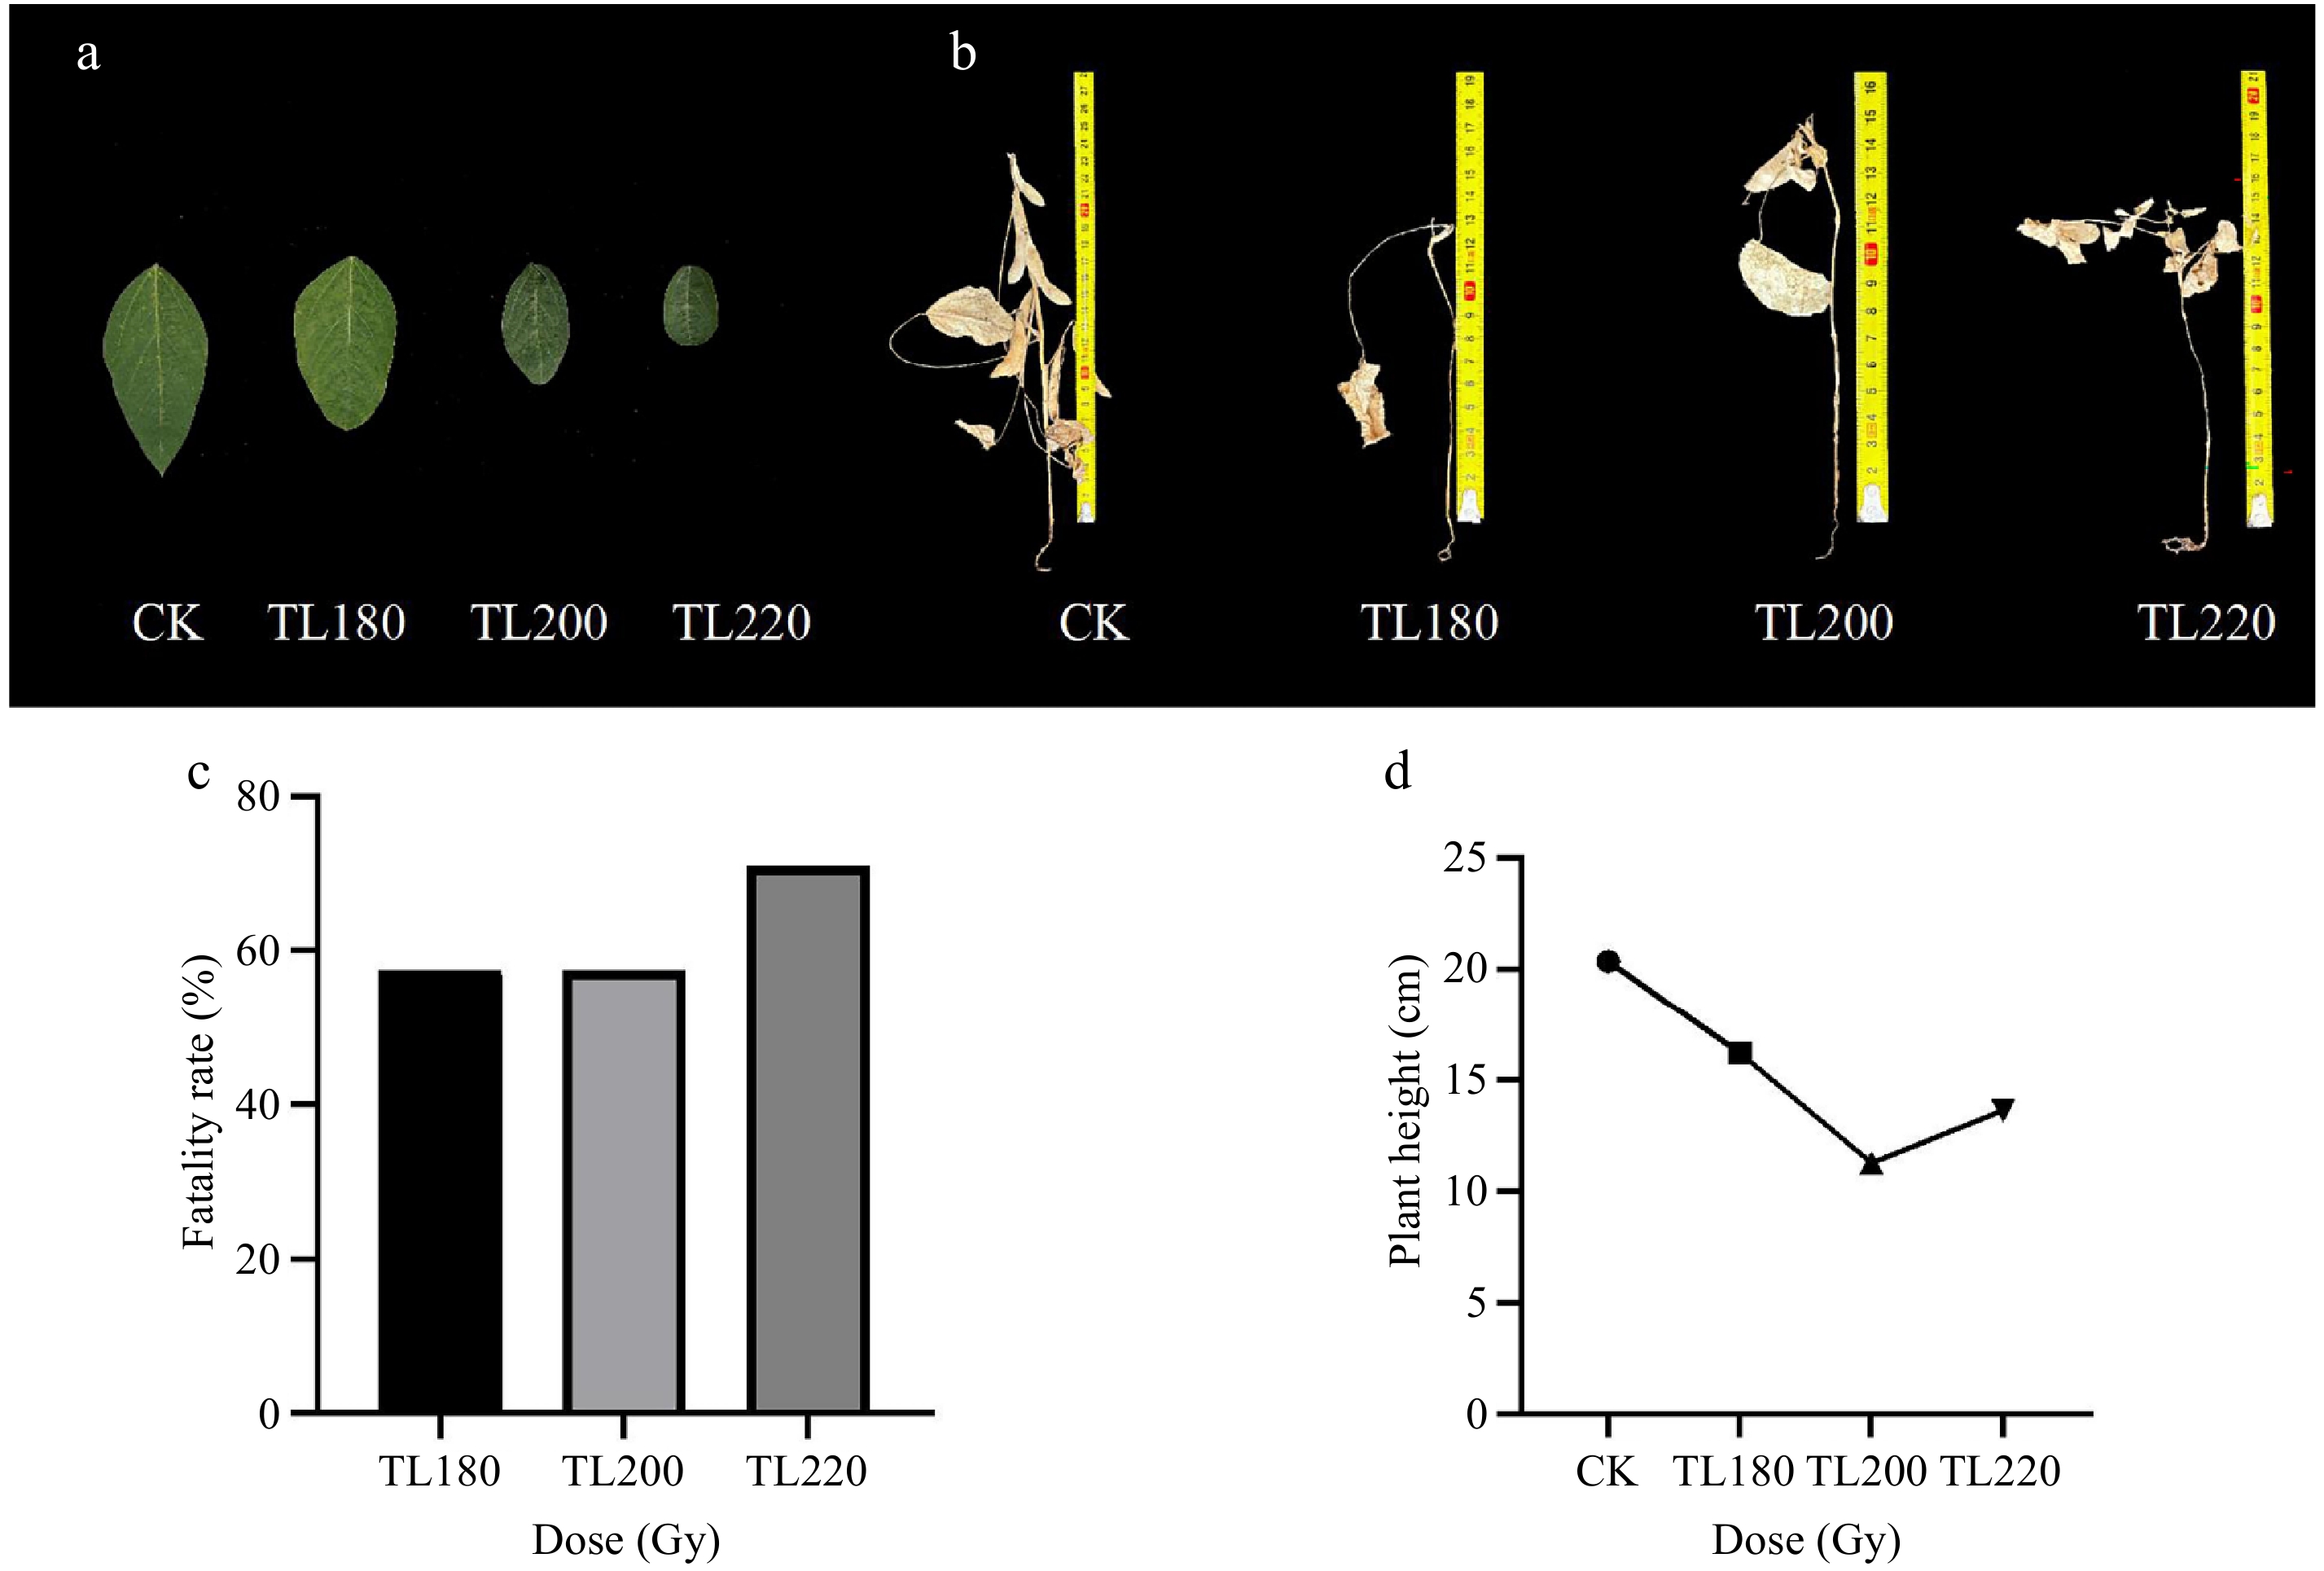
Figure 1.
Impact of different radiation doses on the growth of soybeans. (a) Size of leaves at each dose. (b) Plant height at each dose. (c) Statistics of lethality at each dose level. (d) Average plant height at each dose level. TL180 refers to the Tianlong No.1 soybean population at 180 Gy, TL200 refers to the Tianlong No.1 soybean population at 200 Gy, and TL220 refers to the Tianlong No.1 soybean population at 220 Gy.
-
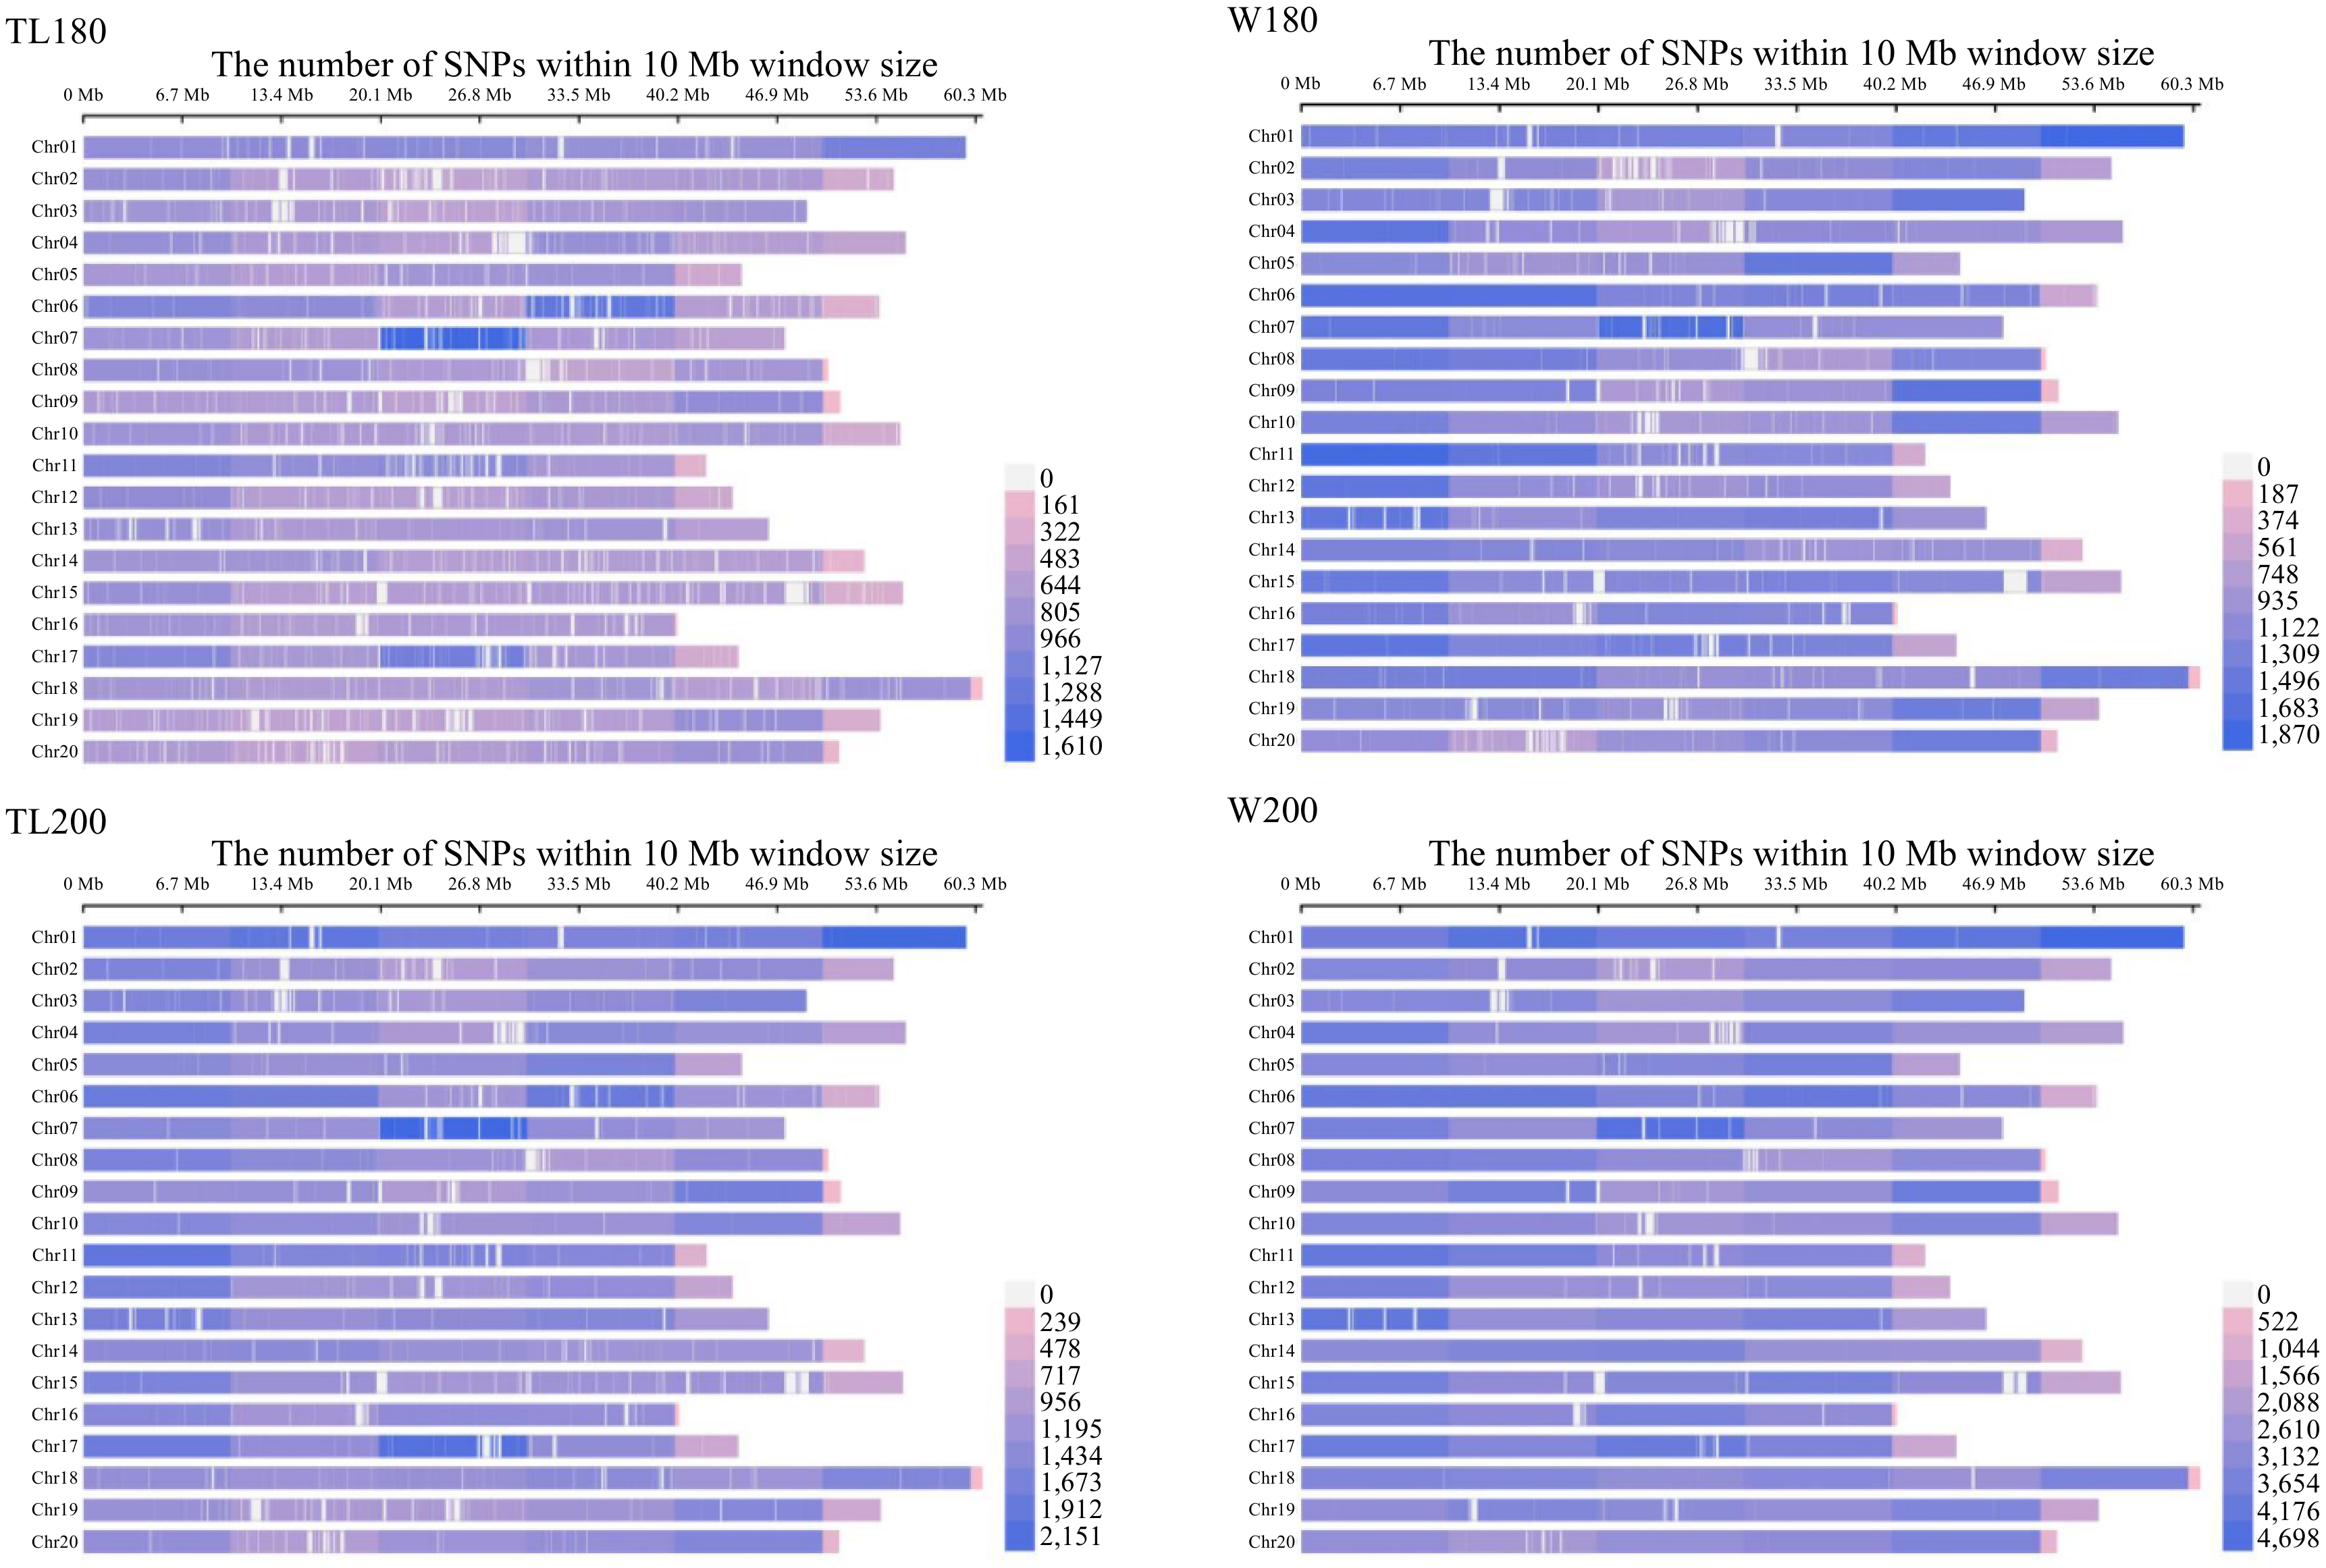
Figure 2.
Distribution of genomic mutations induced by an electron accelerator at various dose levels. TL180 represents the Tianlong No.1 soybean population at 180 Gy, TL200 represents the Tianlong No.1 soybean population at 200 Gy, W180 represents the Williams 82 population at 180 Gy, and W200 represents the Williams 82 population at 200 Gy.
-
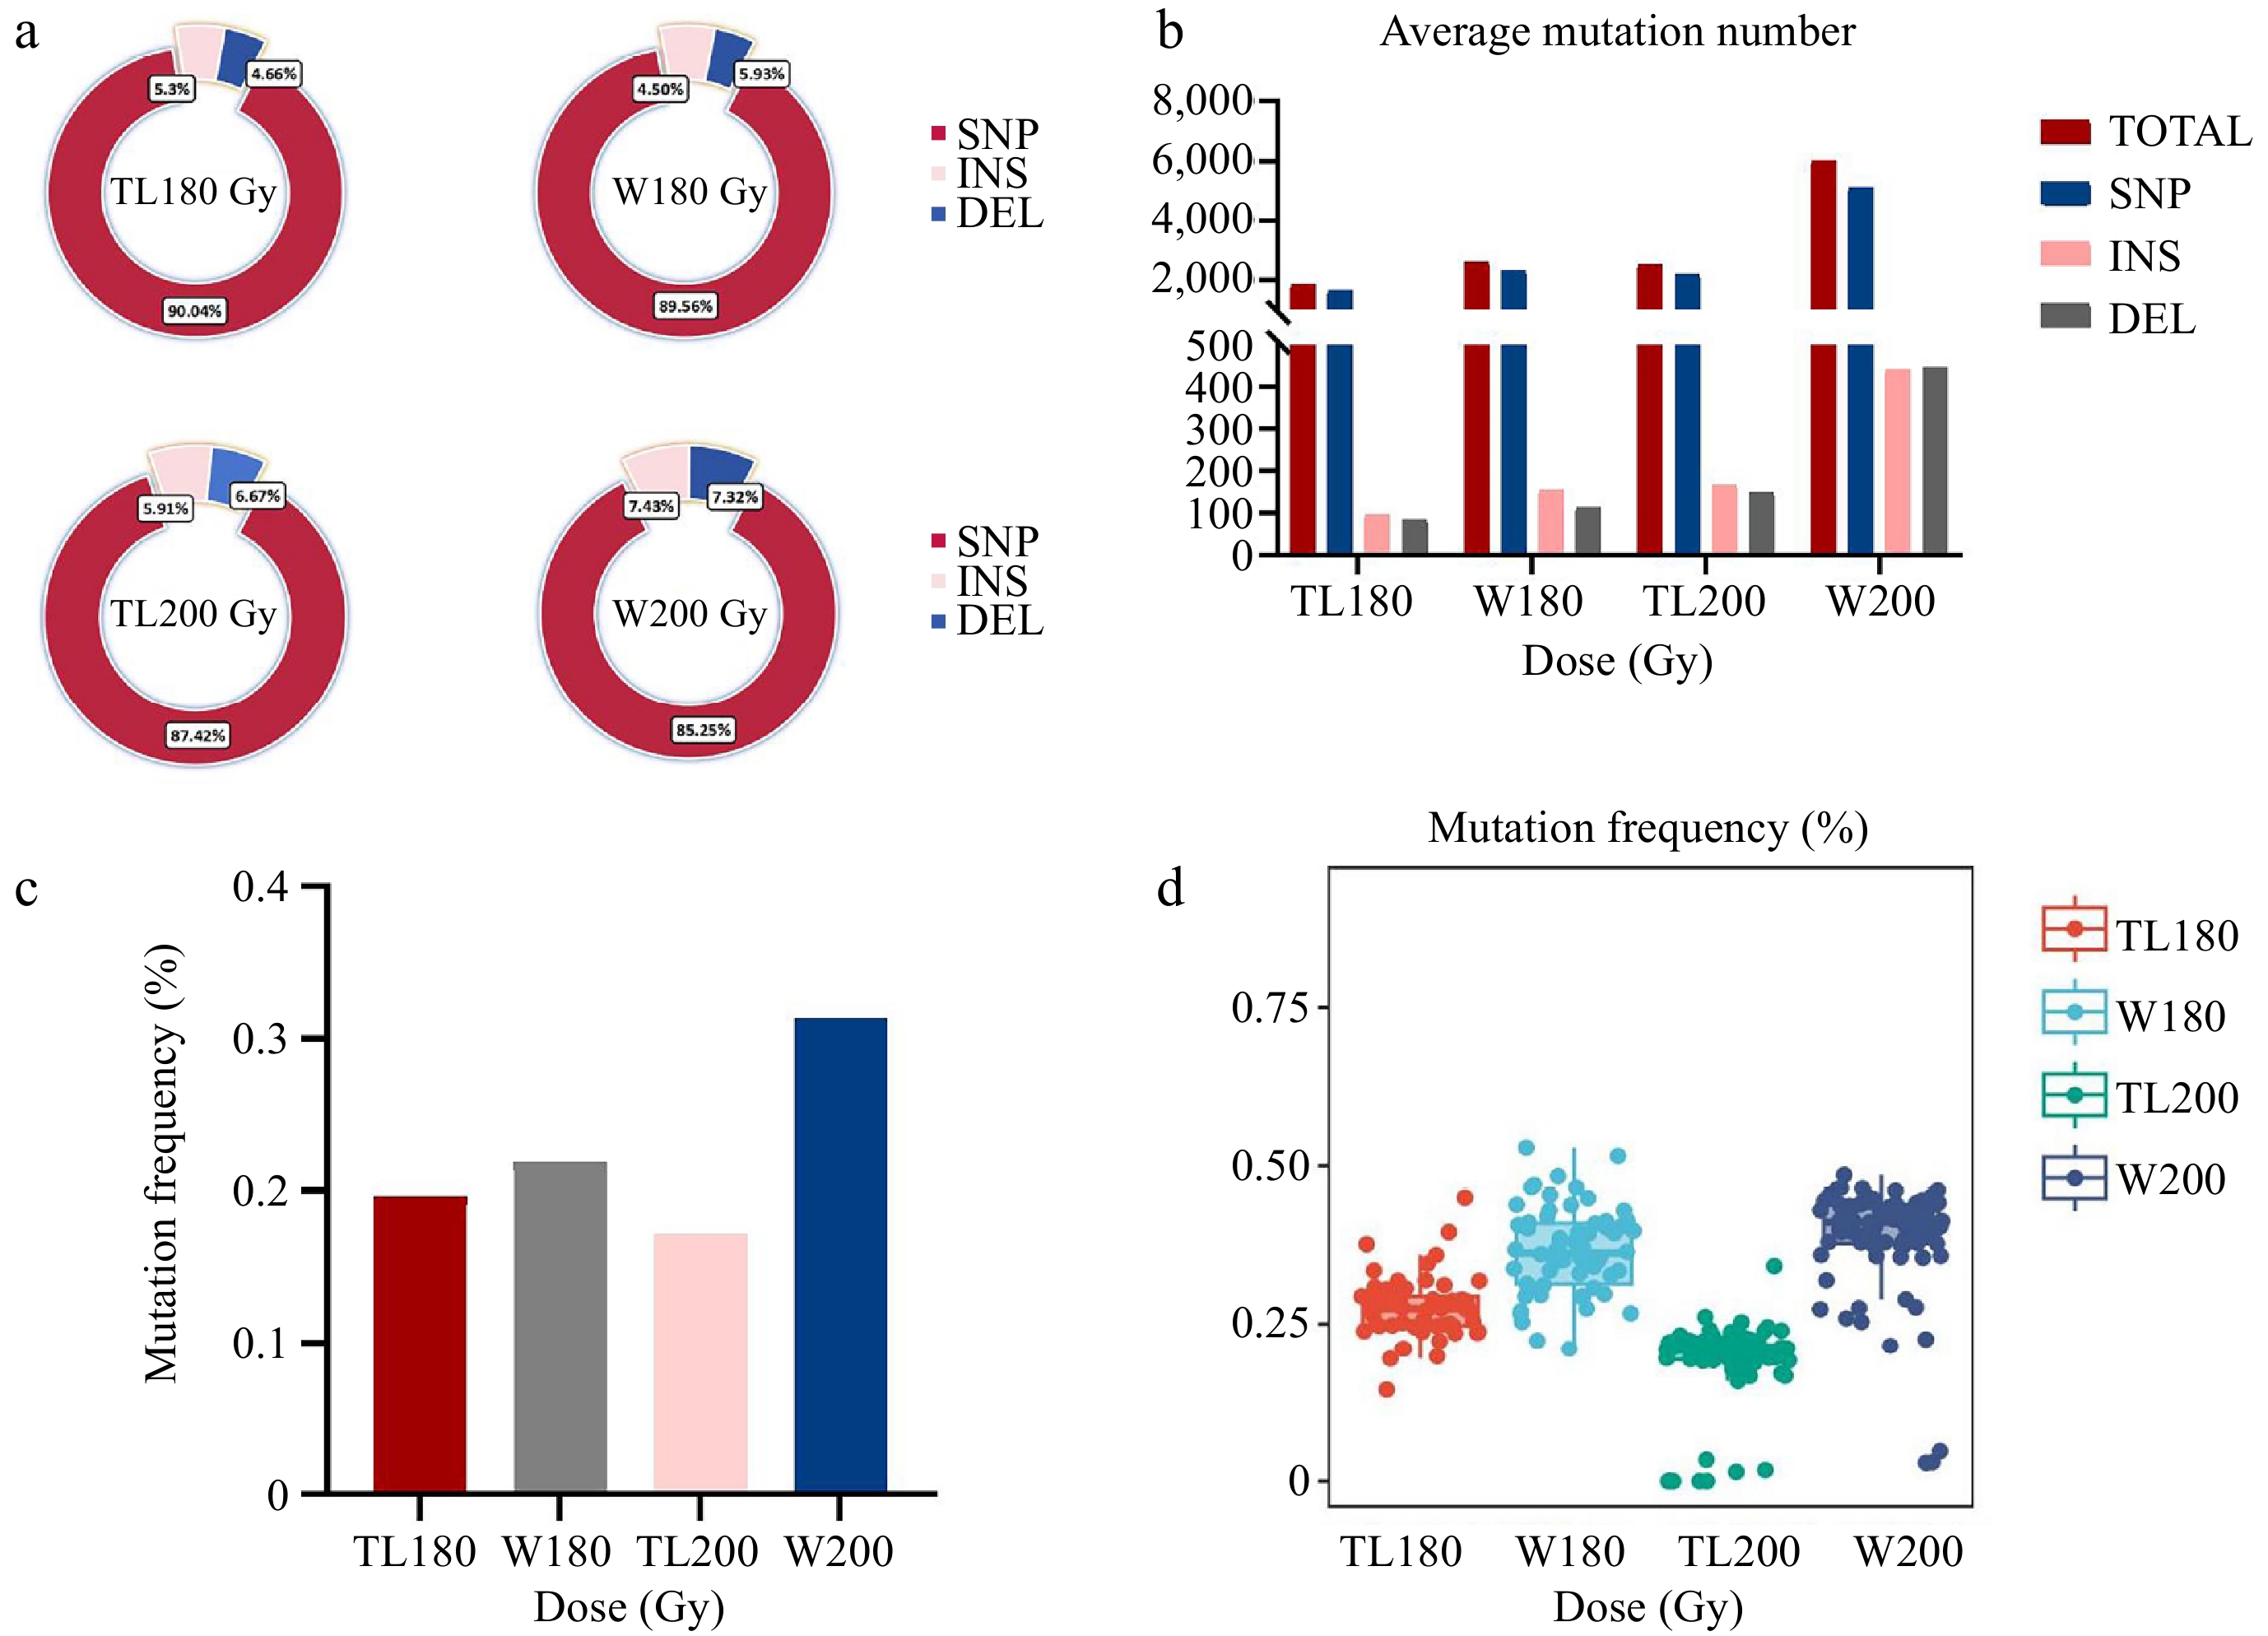
Figure 3.
Distribution of genomic mutations induced by an electron accelerator in the M1 population at each dose level. (a) Proportion of SNPs, INSs, and DELs in different dose treatment groups. (b) Average number of mutations induced in different dose treatment groups. (c) Average mutation frequency in different dose treatment groups. (d) Mutation frequency in individual samples induced at each dose level.
-
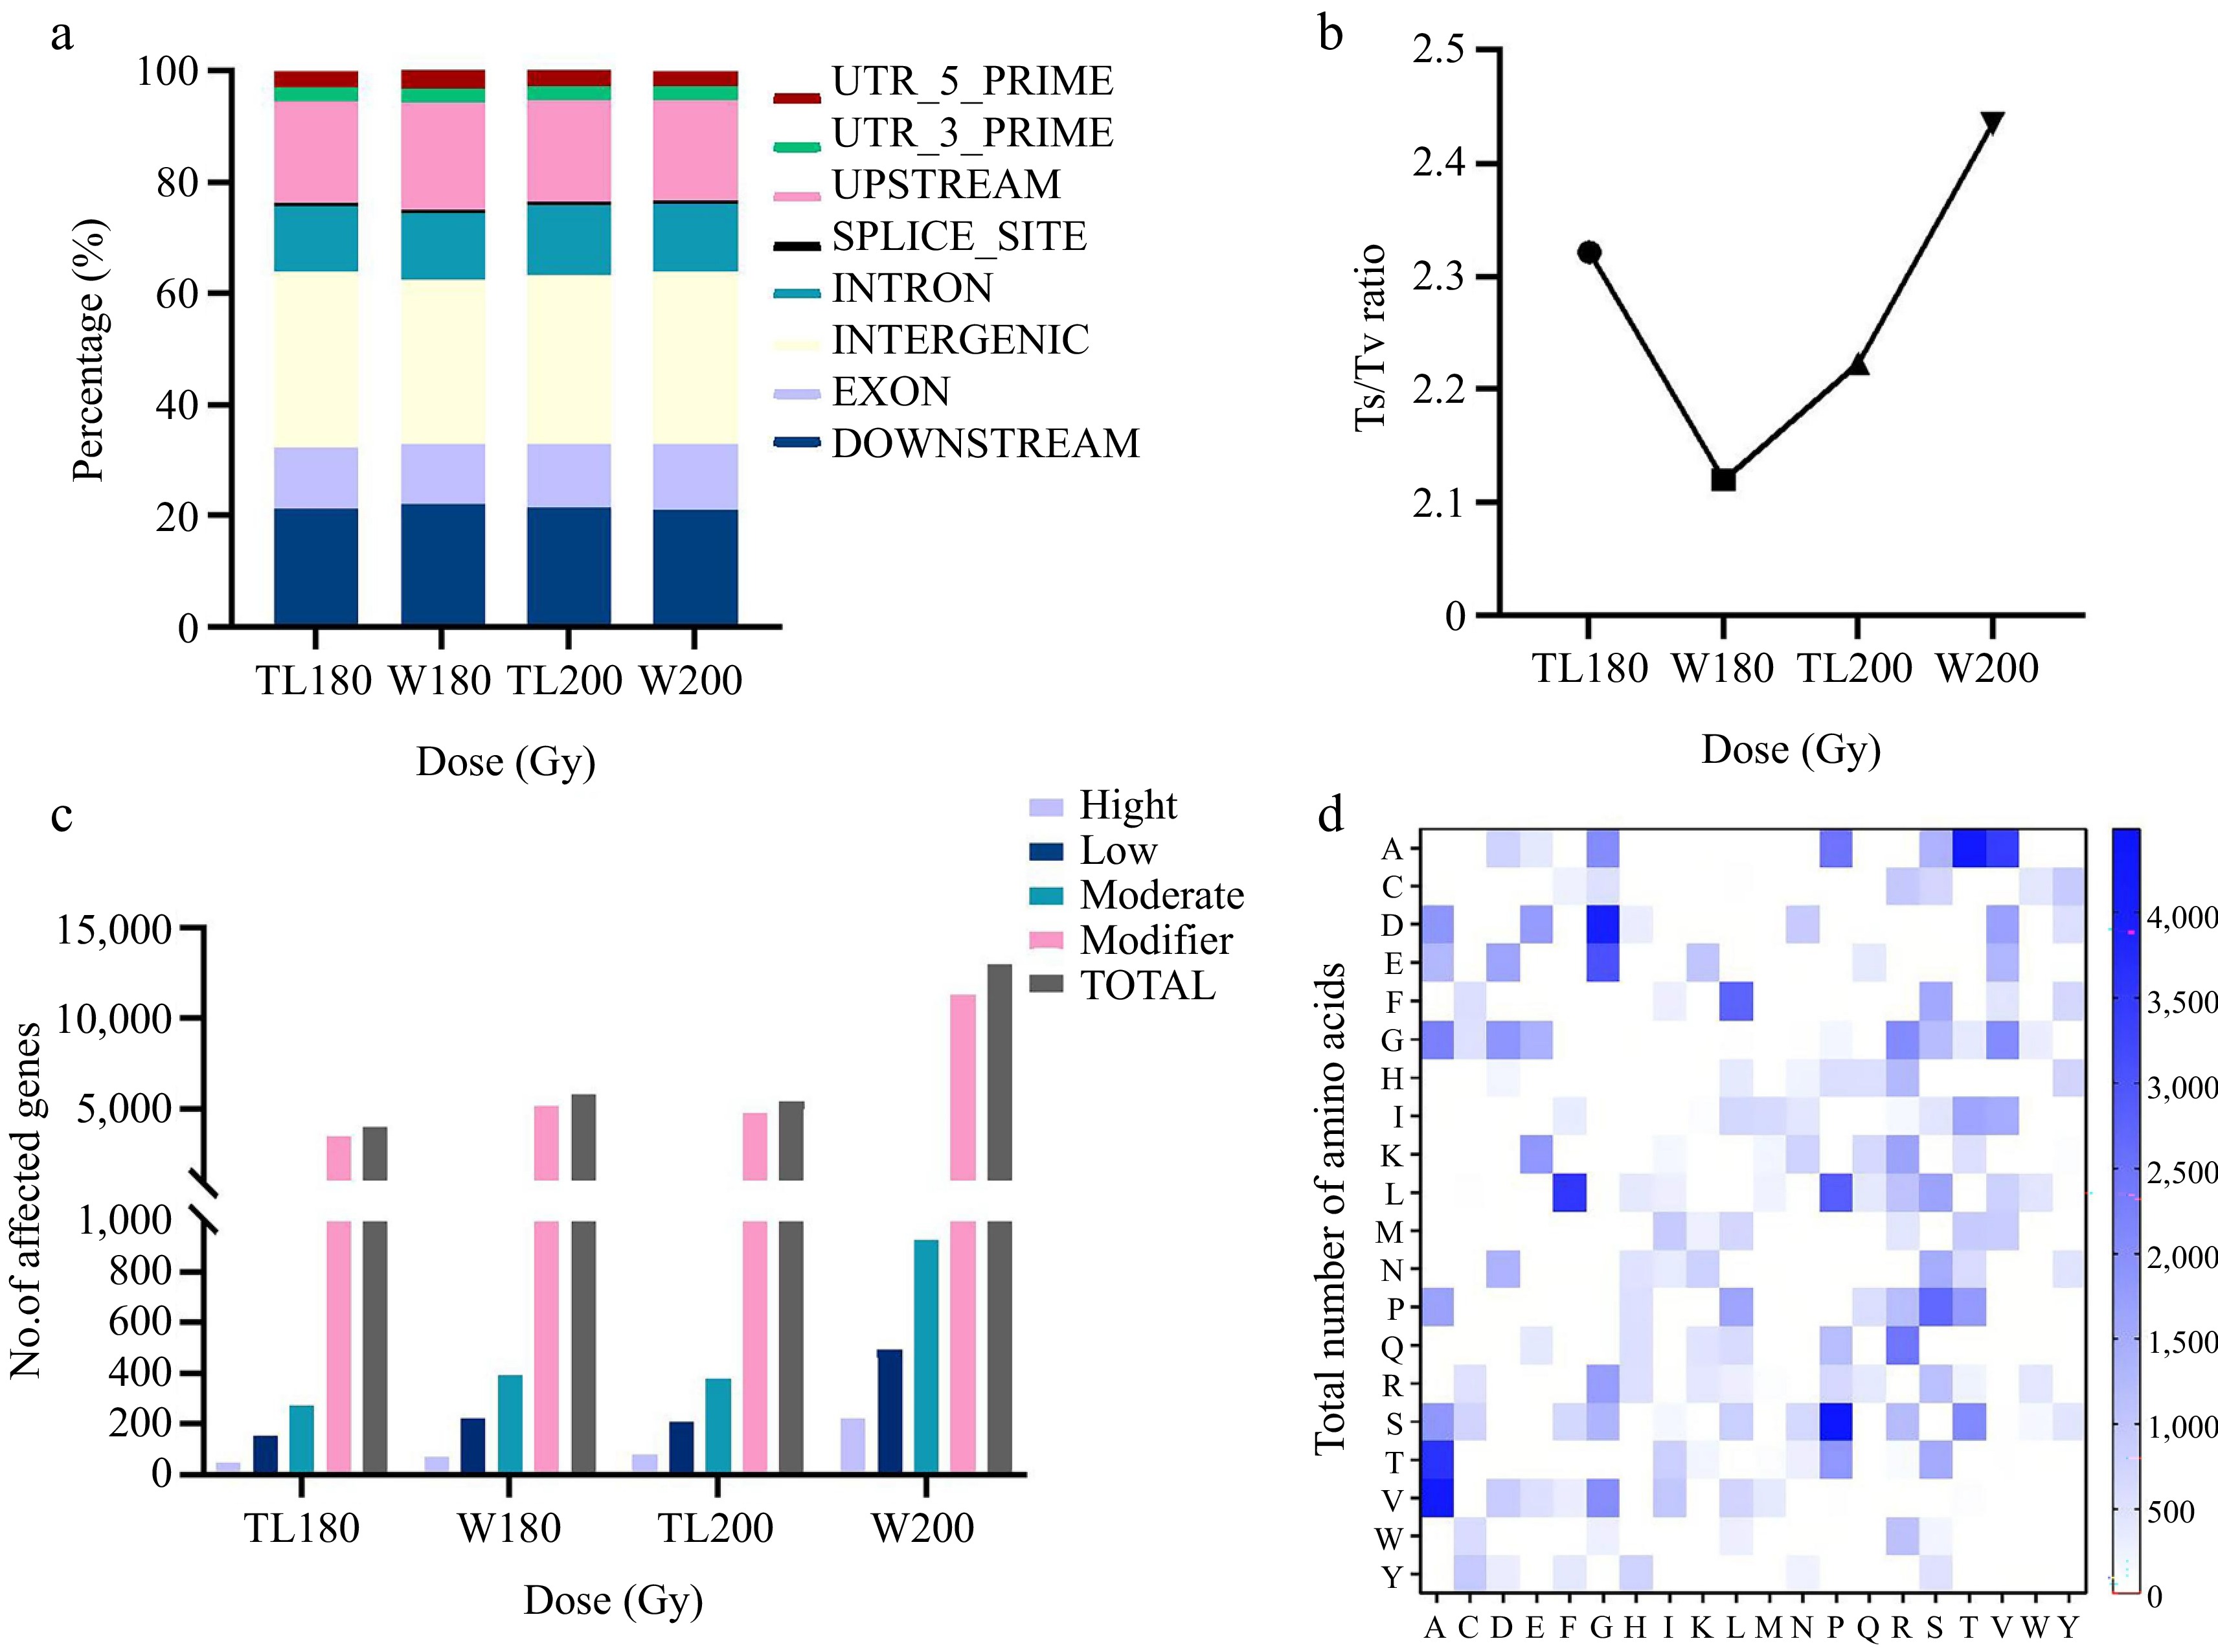
Figure 4.
Comprehensive analysis of mutations induced by various dose treatment groups. (a) Distribution of mutations in gene structure across different doses. (b) Ts/Tv ratio at various doses. (c) Average number of genes affected by mutations at different doses. (d) Total number of amino acid alterations induced at various doses.
-
Sample Number Total loci Variant loci Mutation frequency % Average SNPs Average insertions Average deletions TL180 59 55,938,993 109,878 0.1964 1676.86 98.64 86.83 W180 64 75,979,433 167,151 0.2200 2339.14 155.00 117.59 TL200 86 123,112,699 212,685 0.1728 2161.94 164.87 146.27 W200 85 163,648,886 512,890 0.3134 5144.12 441.55 448.33 Table 1.
Soybean M1 generation mutation information statistics.
-
Sample High Low Moderate Modifier Total TL180 2,800 9,138 16,249 206,267 234,454 W180 4,563 14,274 25,191 327,616 371,644 TL200 6,812 17,991 32,613 408,042 465,458 W200 19,061 42,268 78,798 960,523 1,100,650 Table 2.
The number of mutated genes induced under different dose treatment groups.
Figures
(4)
Tables
(2)