-
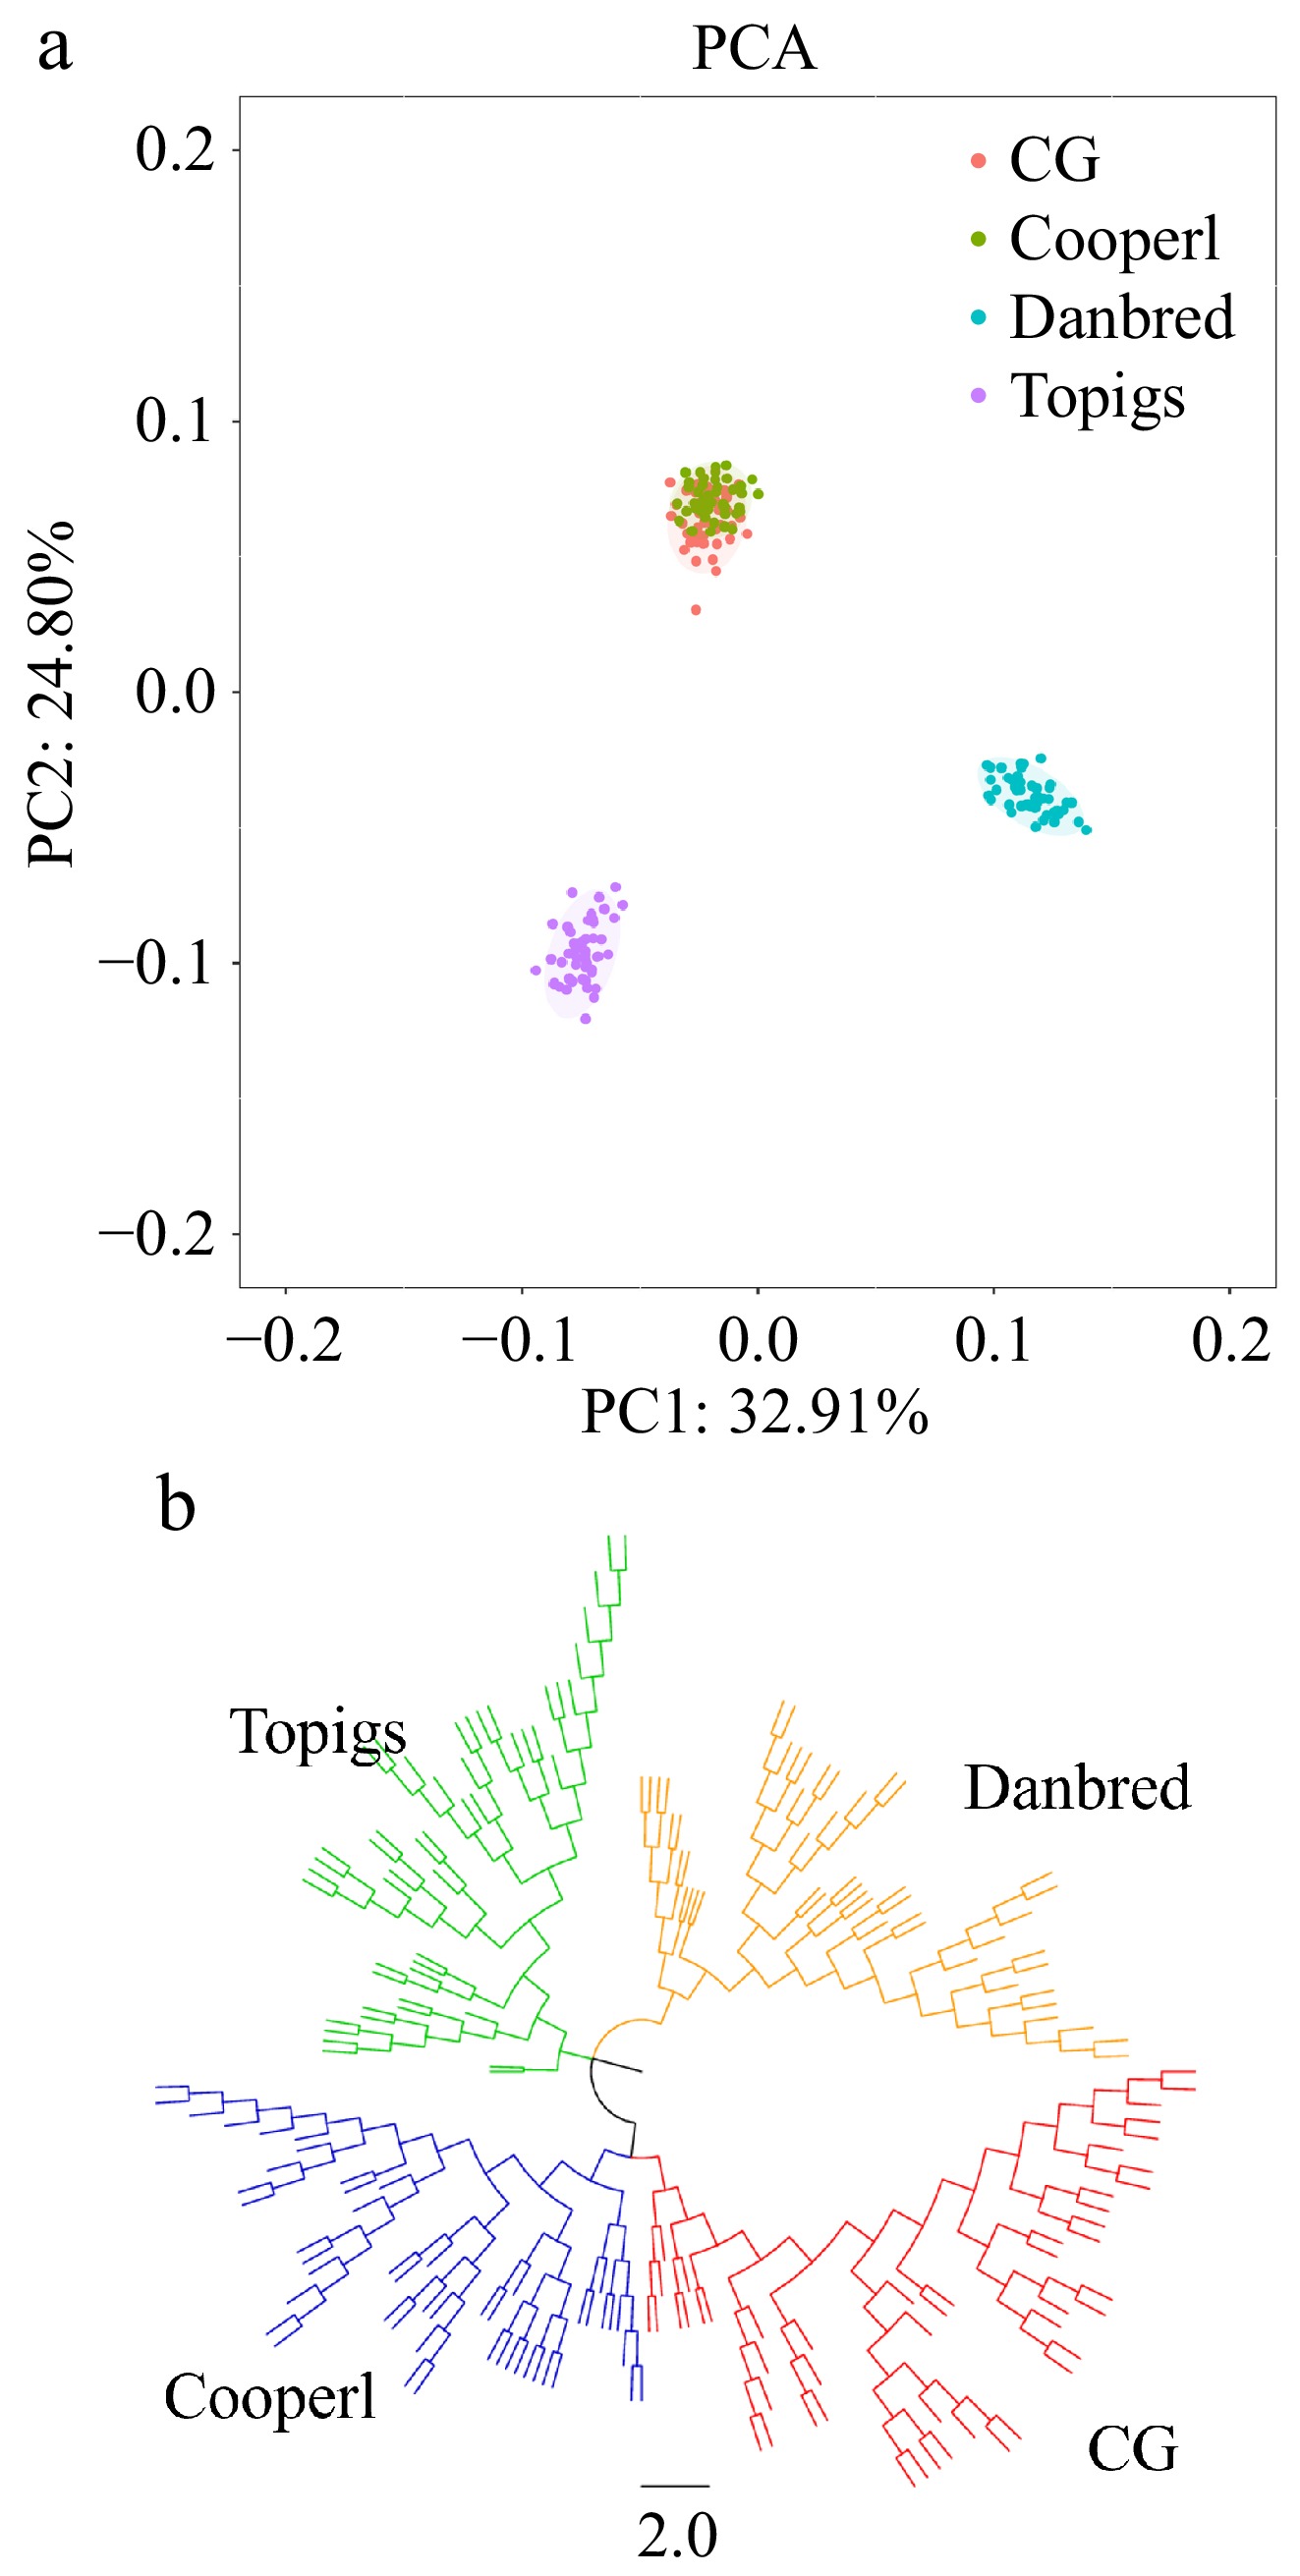
Figure 1.
Analysis of the population structure in four Large White pigs. (a) Principal component analysis. (b) Neighbor-joining tree.
-
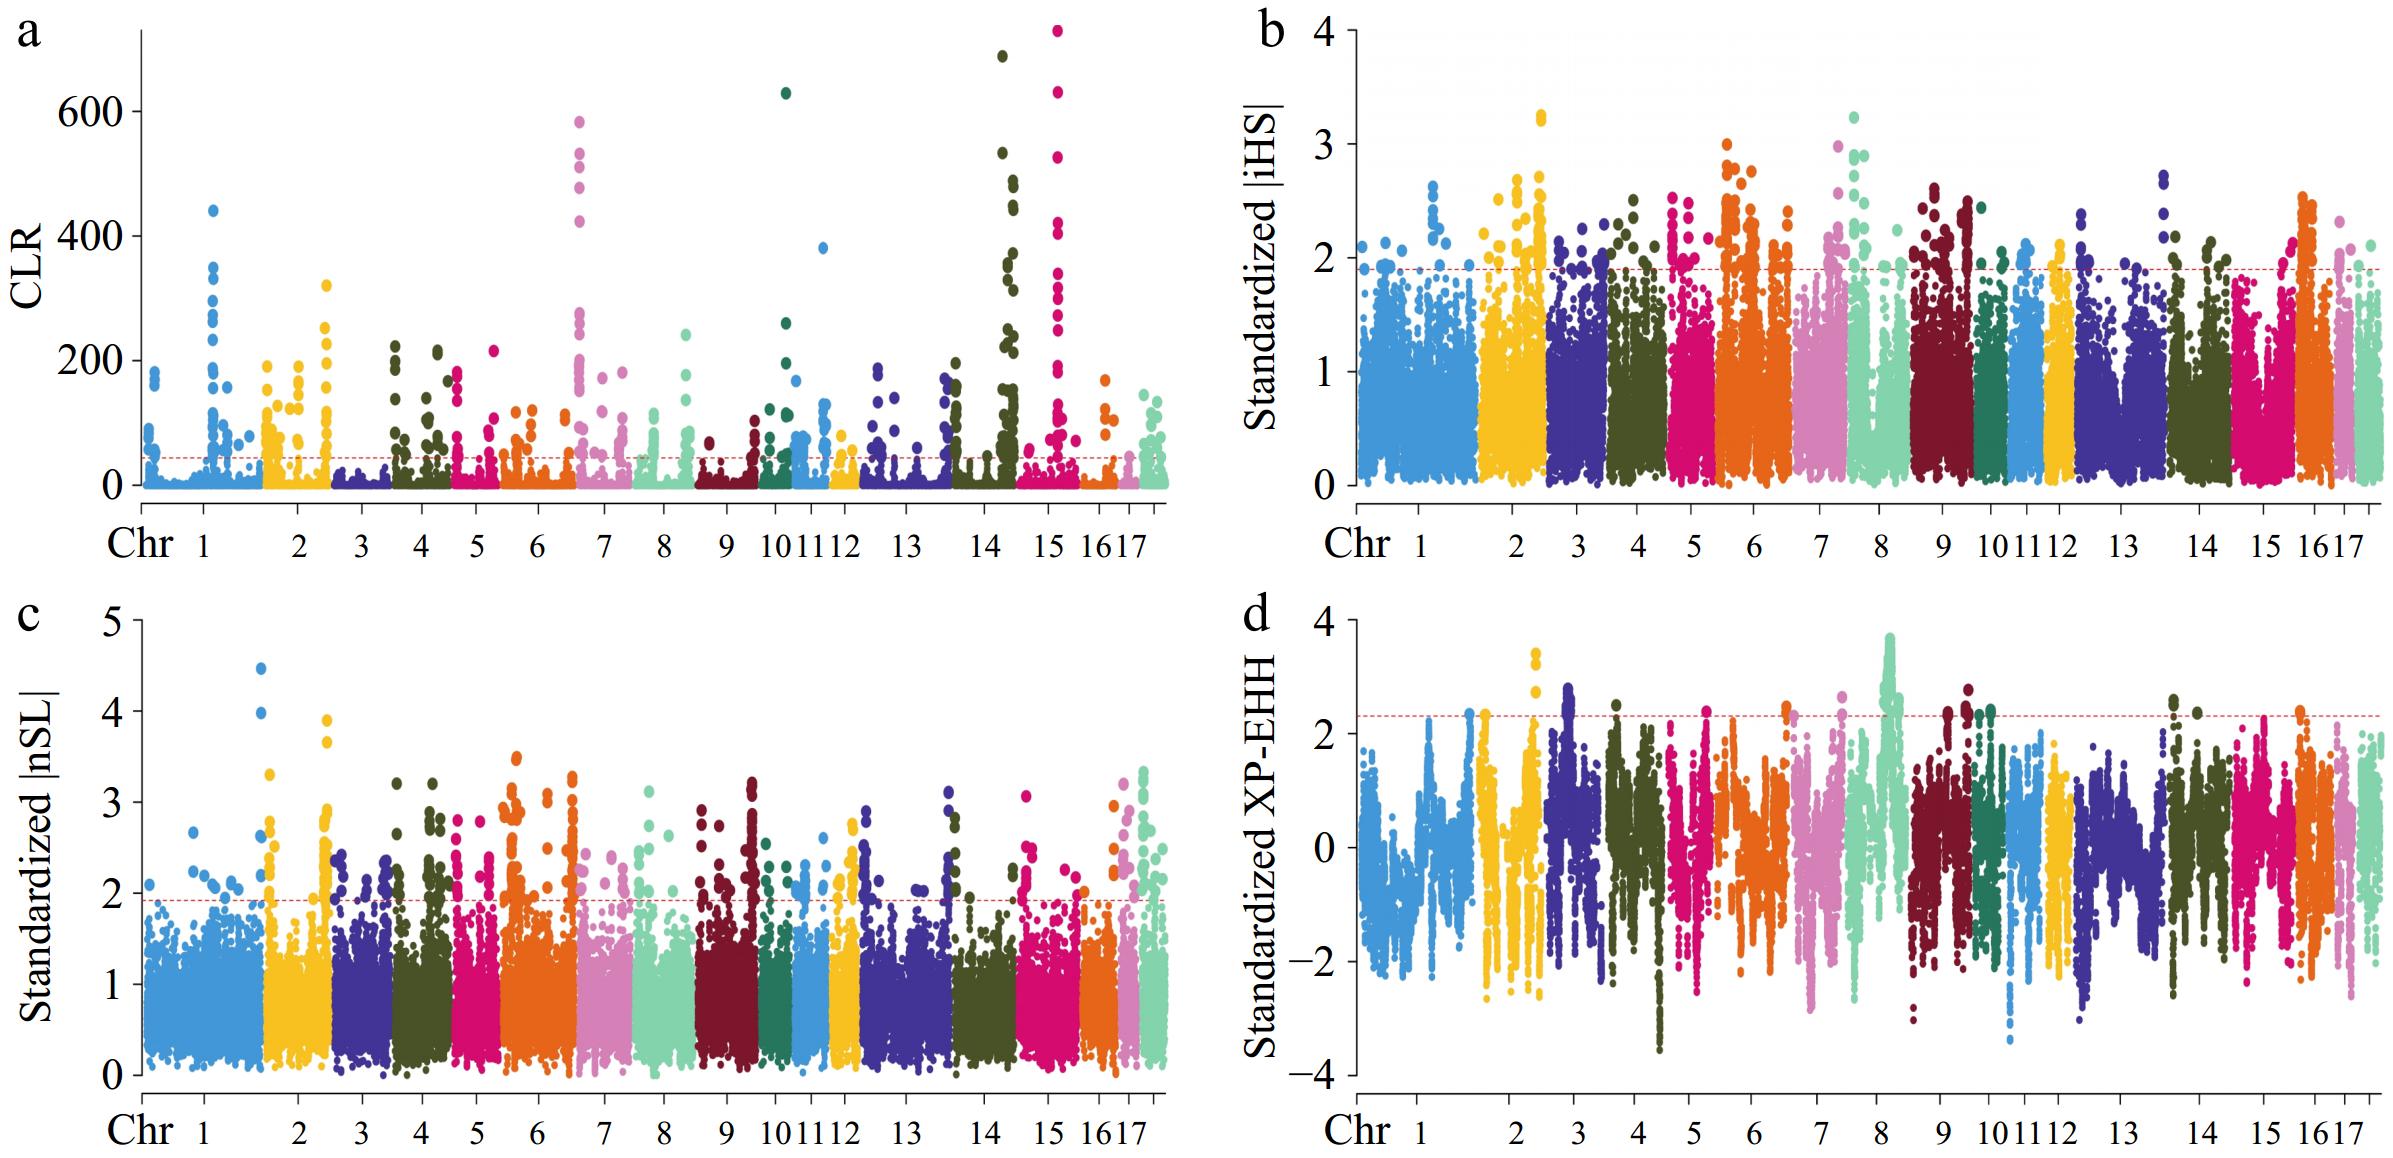
Figure 2.
Manhattan plots for selective sweep analyses of CG strain with the (a) CLR, (b) iHS, (c) nSL, and (d) XP-EHH analyses.
-
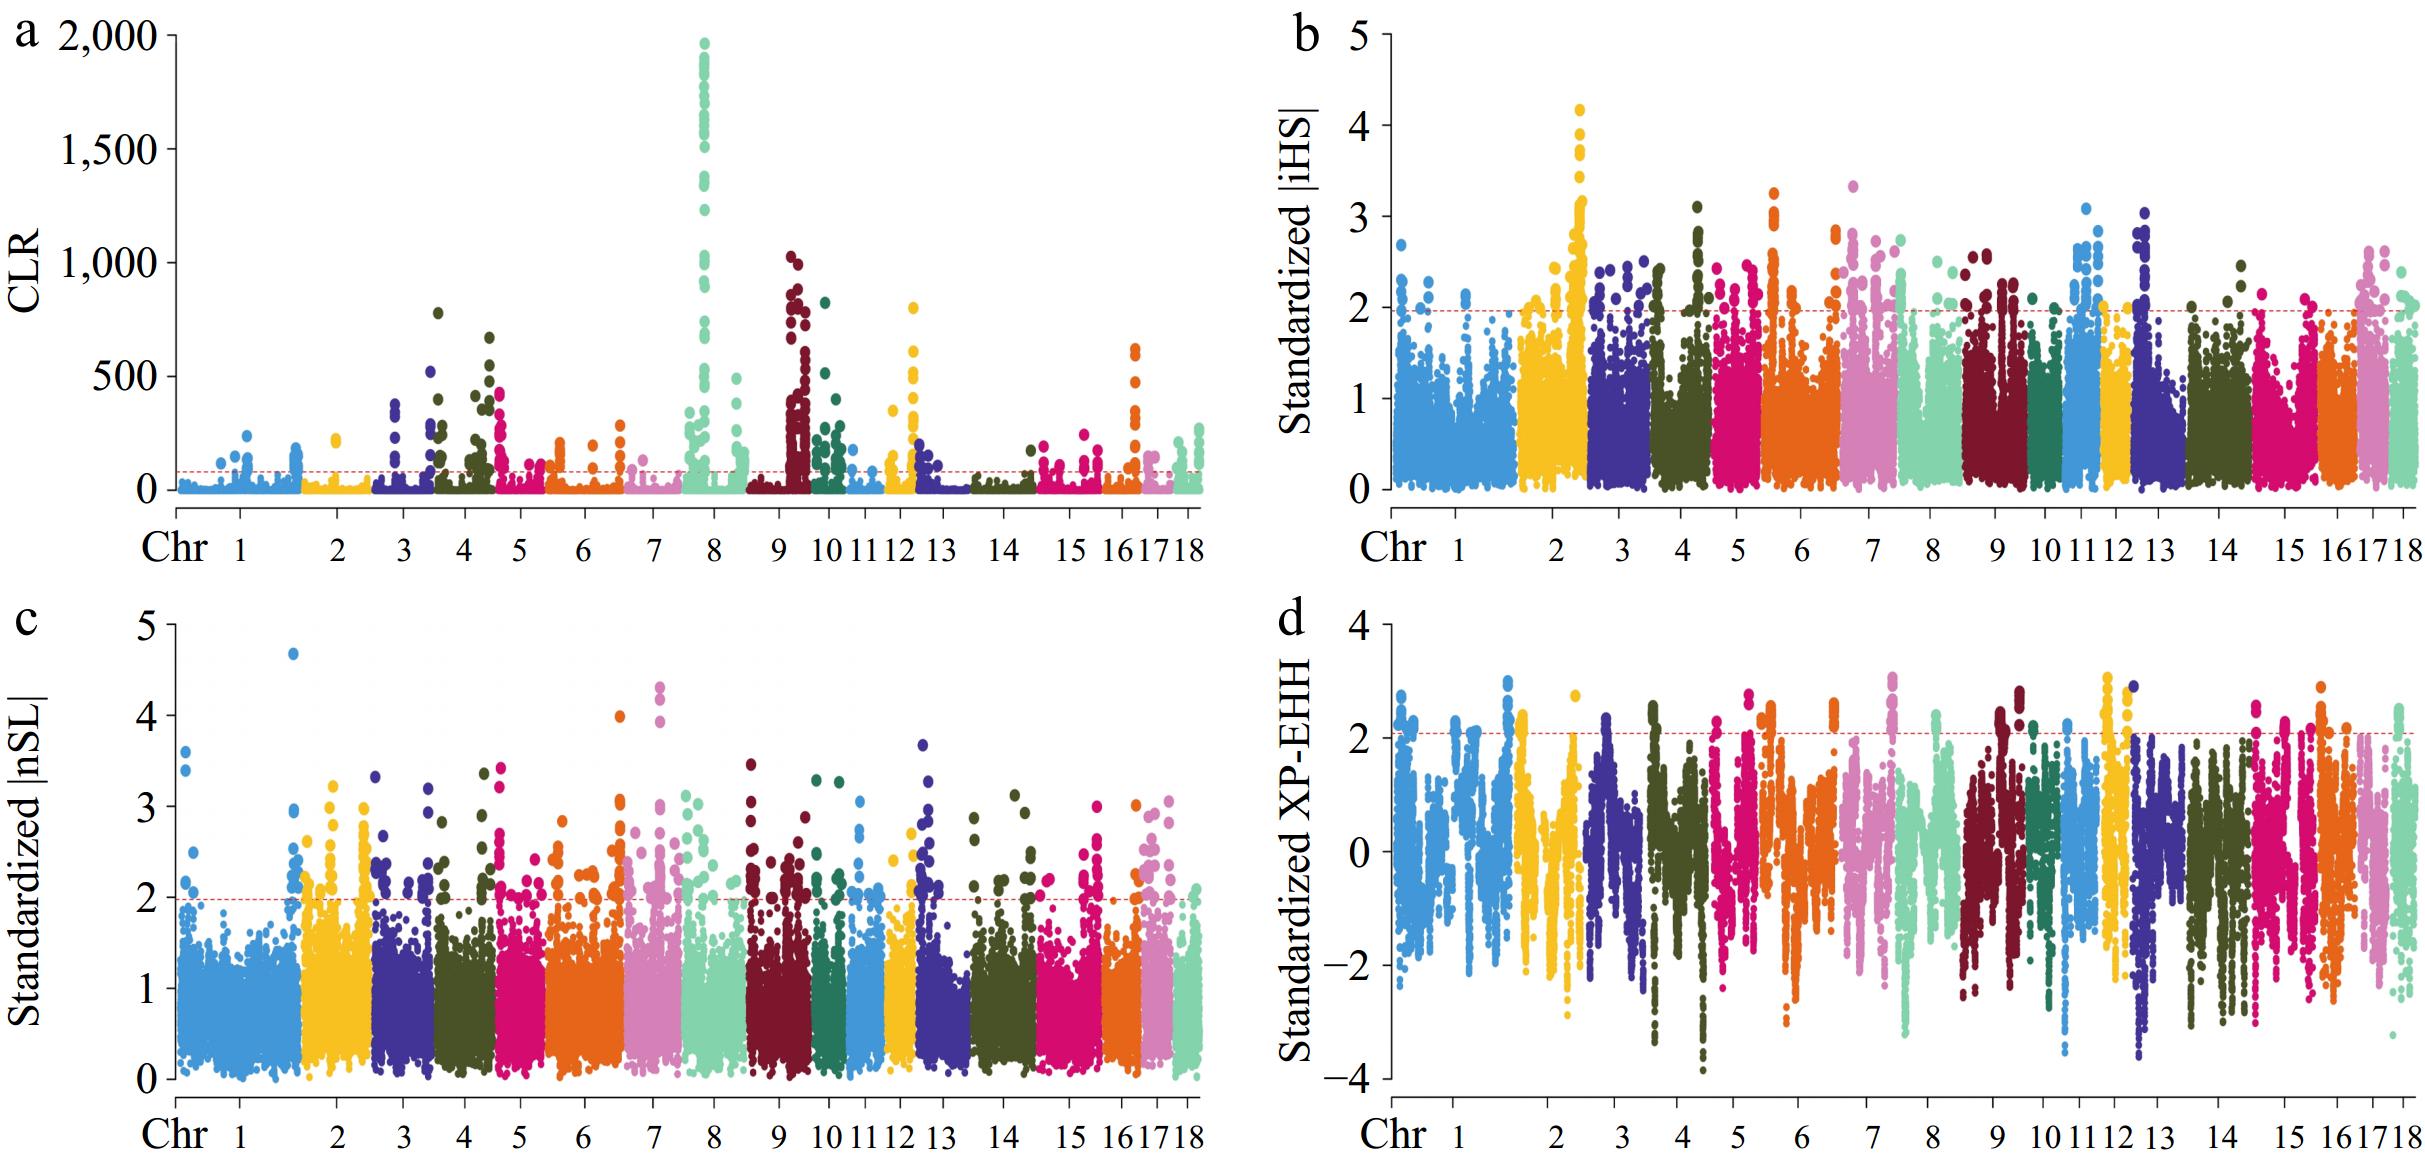
Figure 3.
Manhattan plots for selective sweep analyses of Cooperl strain with the (a) CLR, (b) iHS, (c) nSL, and (d) XP-EHH analyses.
-
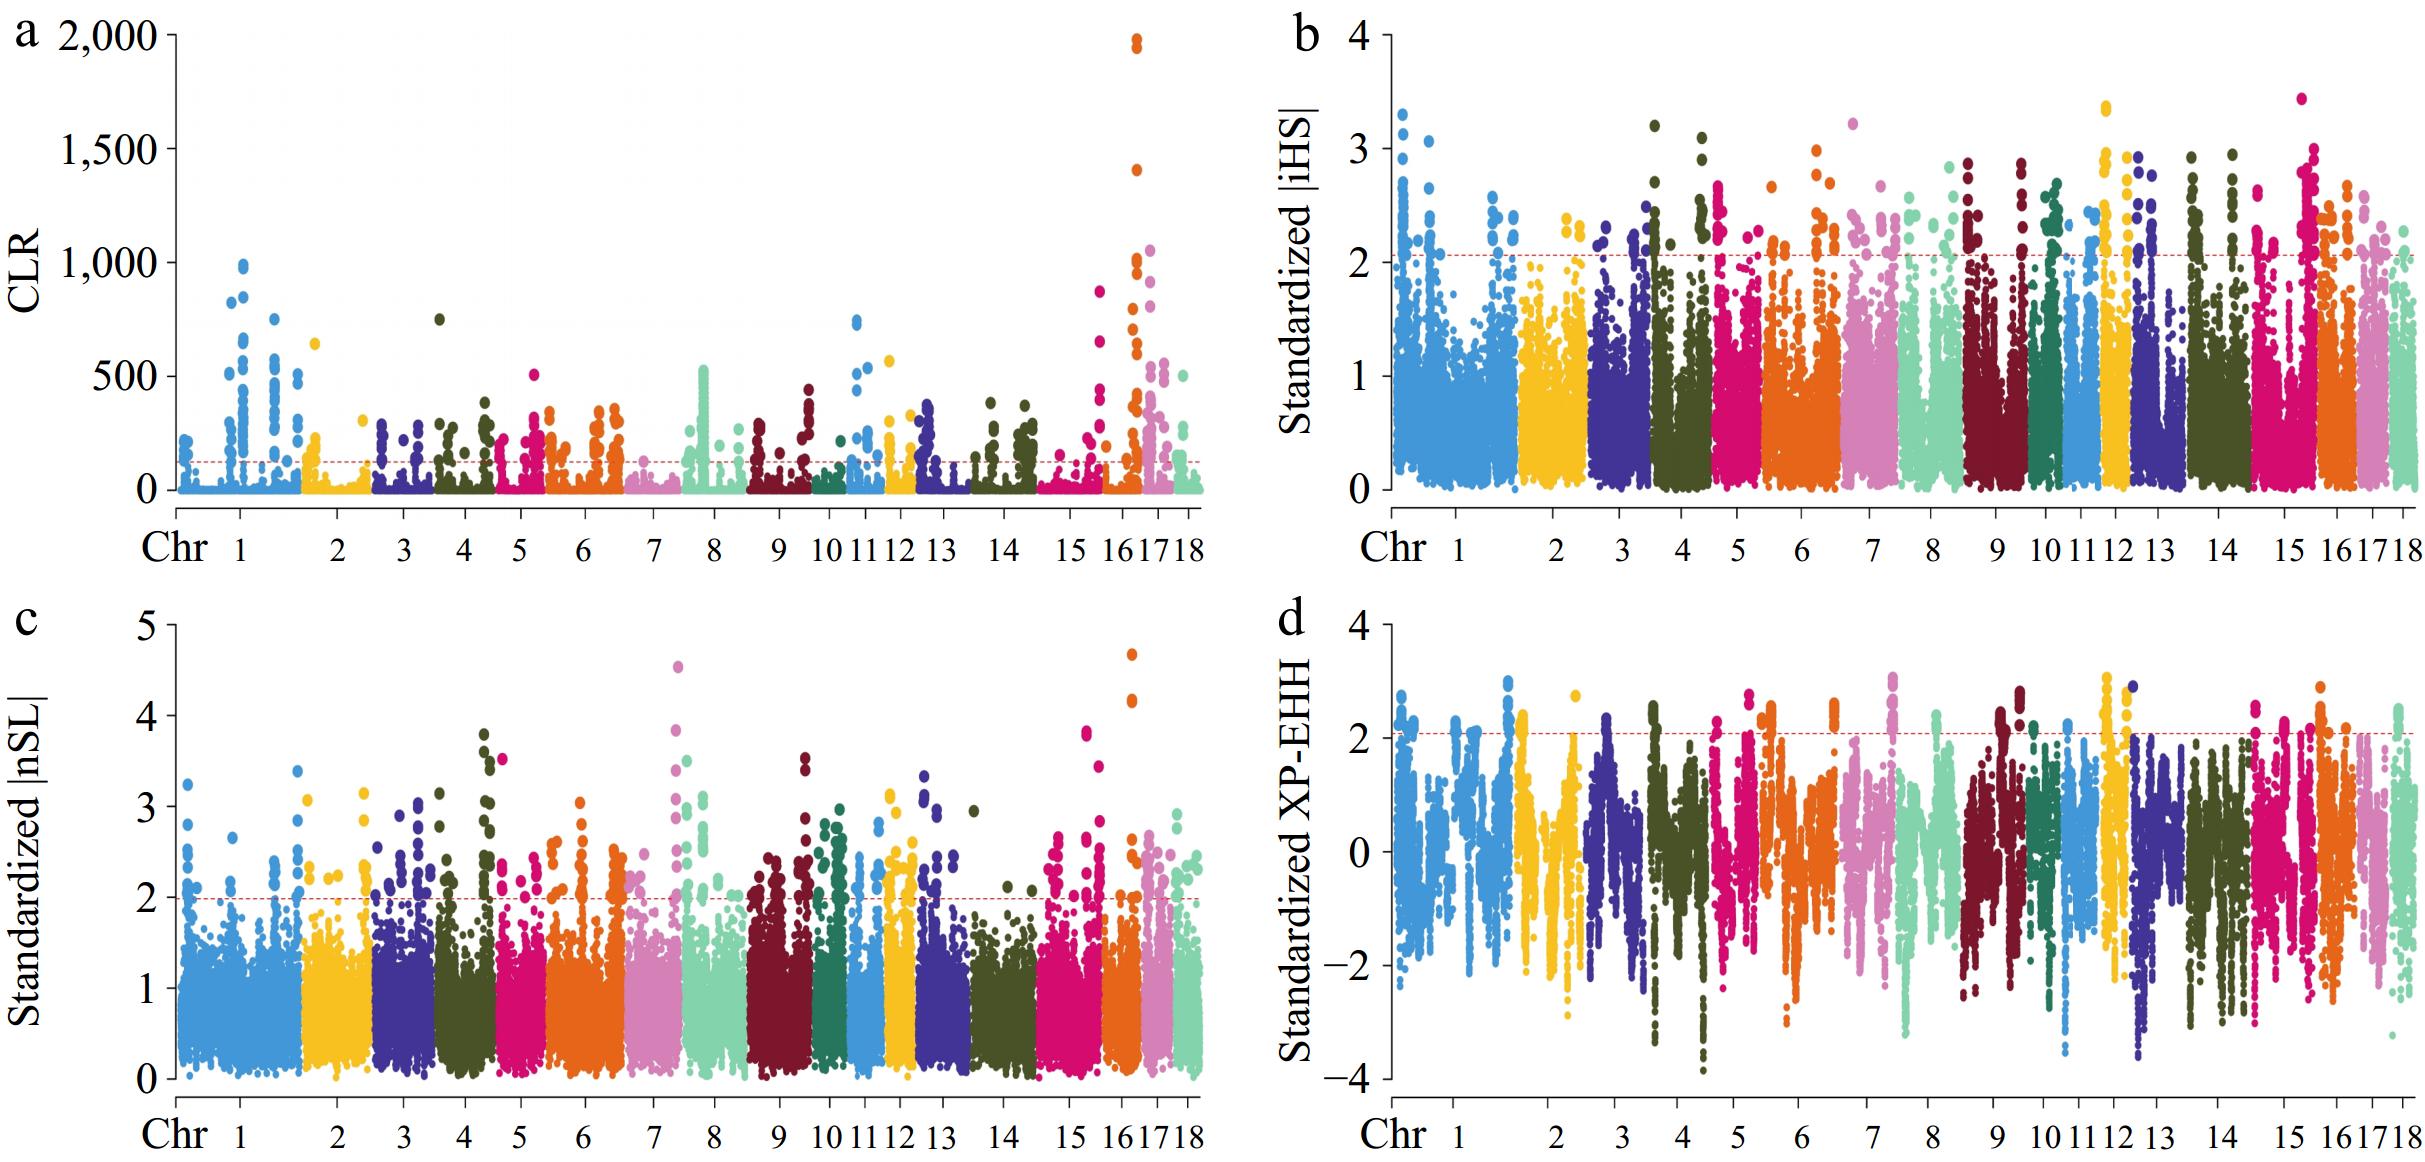
Figure 4.
Manhattan plots for selective sweep analyses of Topigs strain with the (a) CLR, (b) iHS, (c) nSL, and (d) XP-EHH analyses.
-
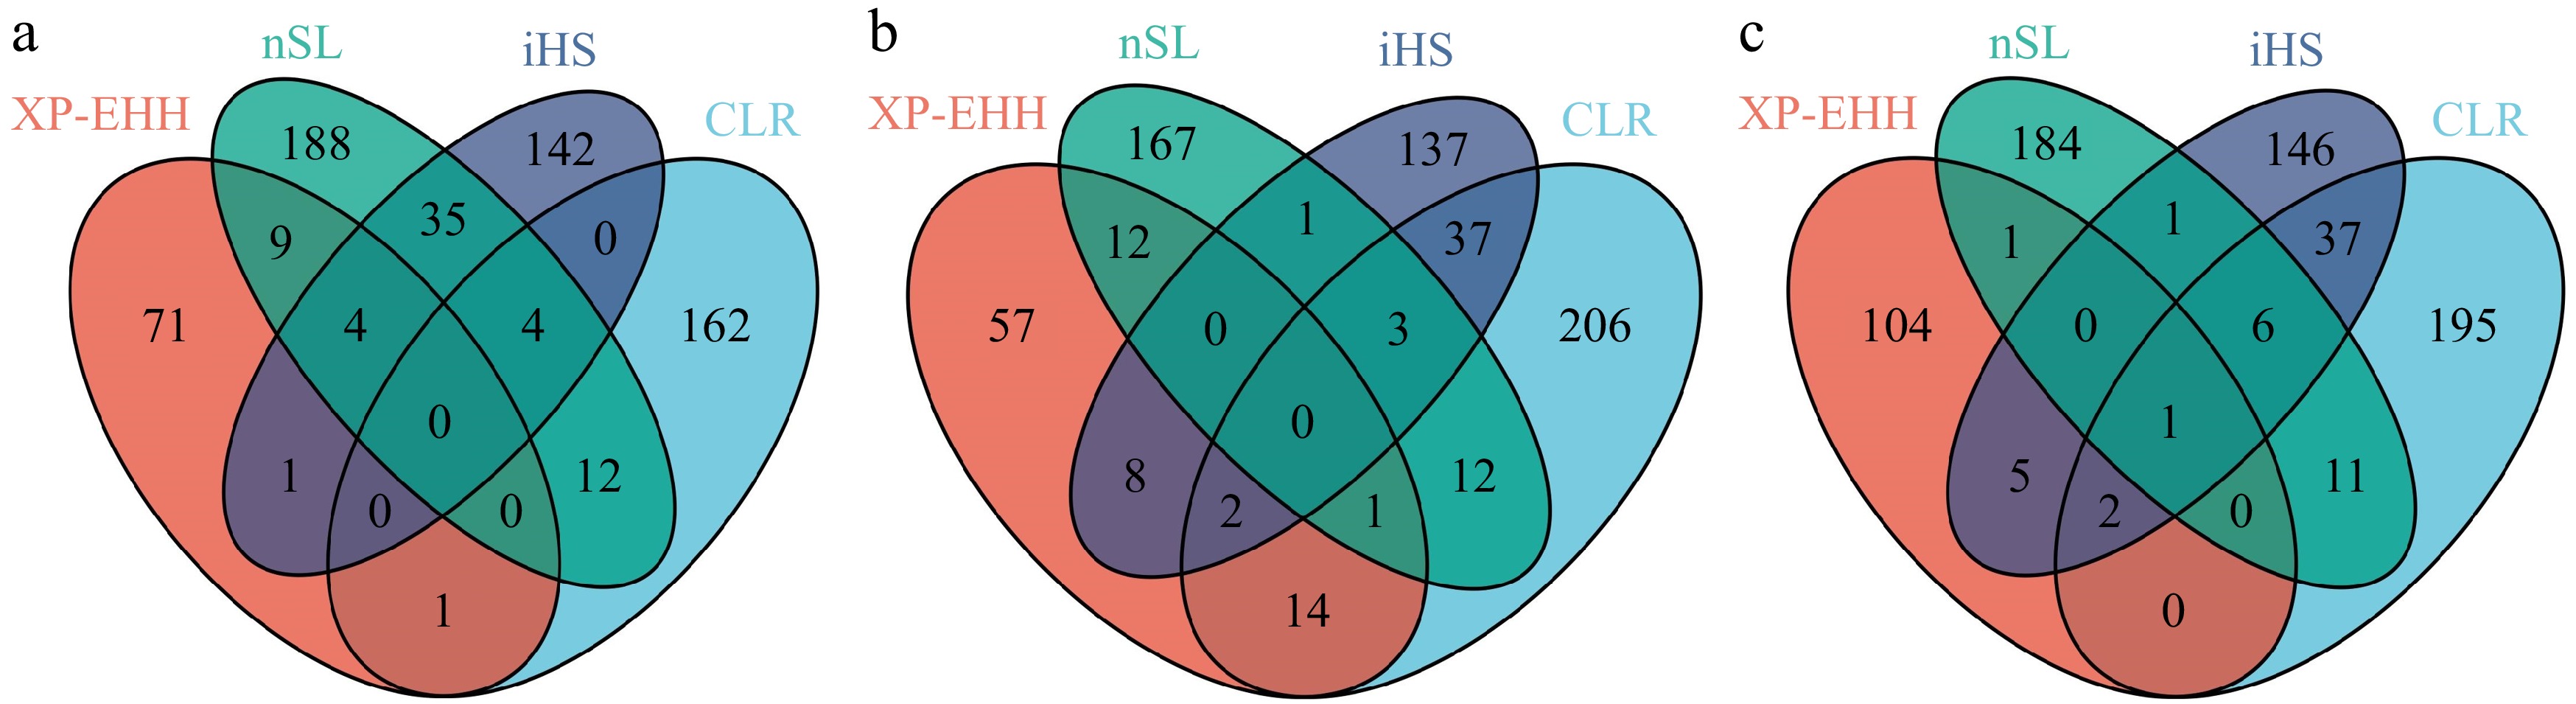
Figure 5.
The Venn diagram illustrates the overlap of genes between four different approaches. (a) CG, (b) Cooperl, (c) Topigs.
-
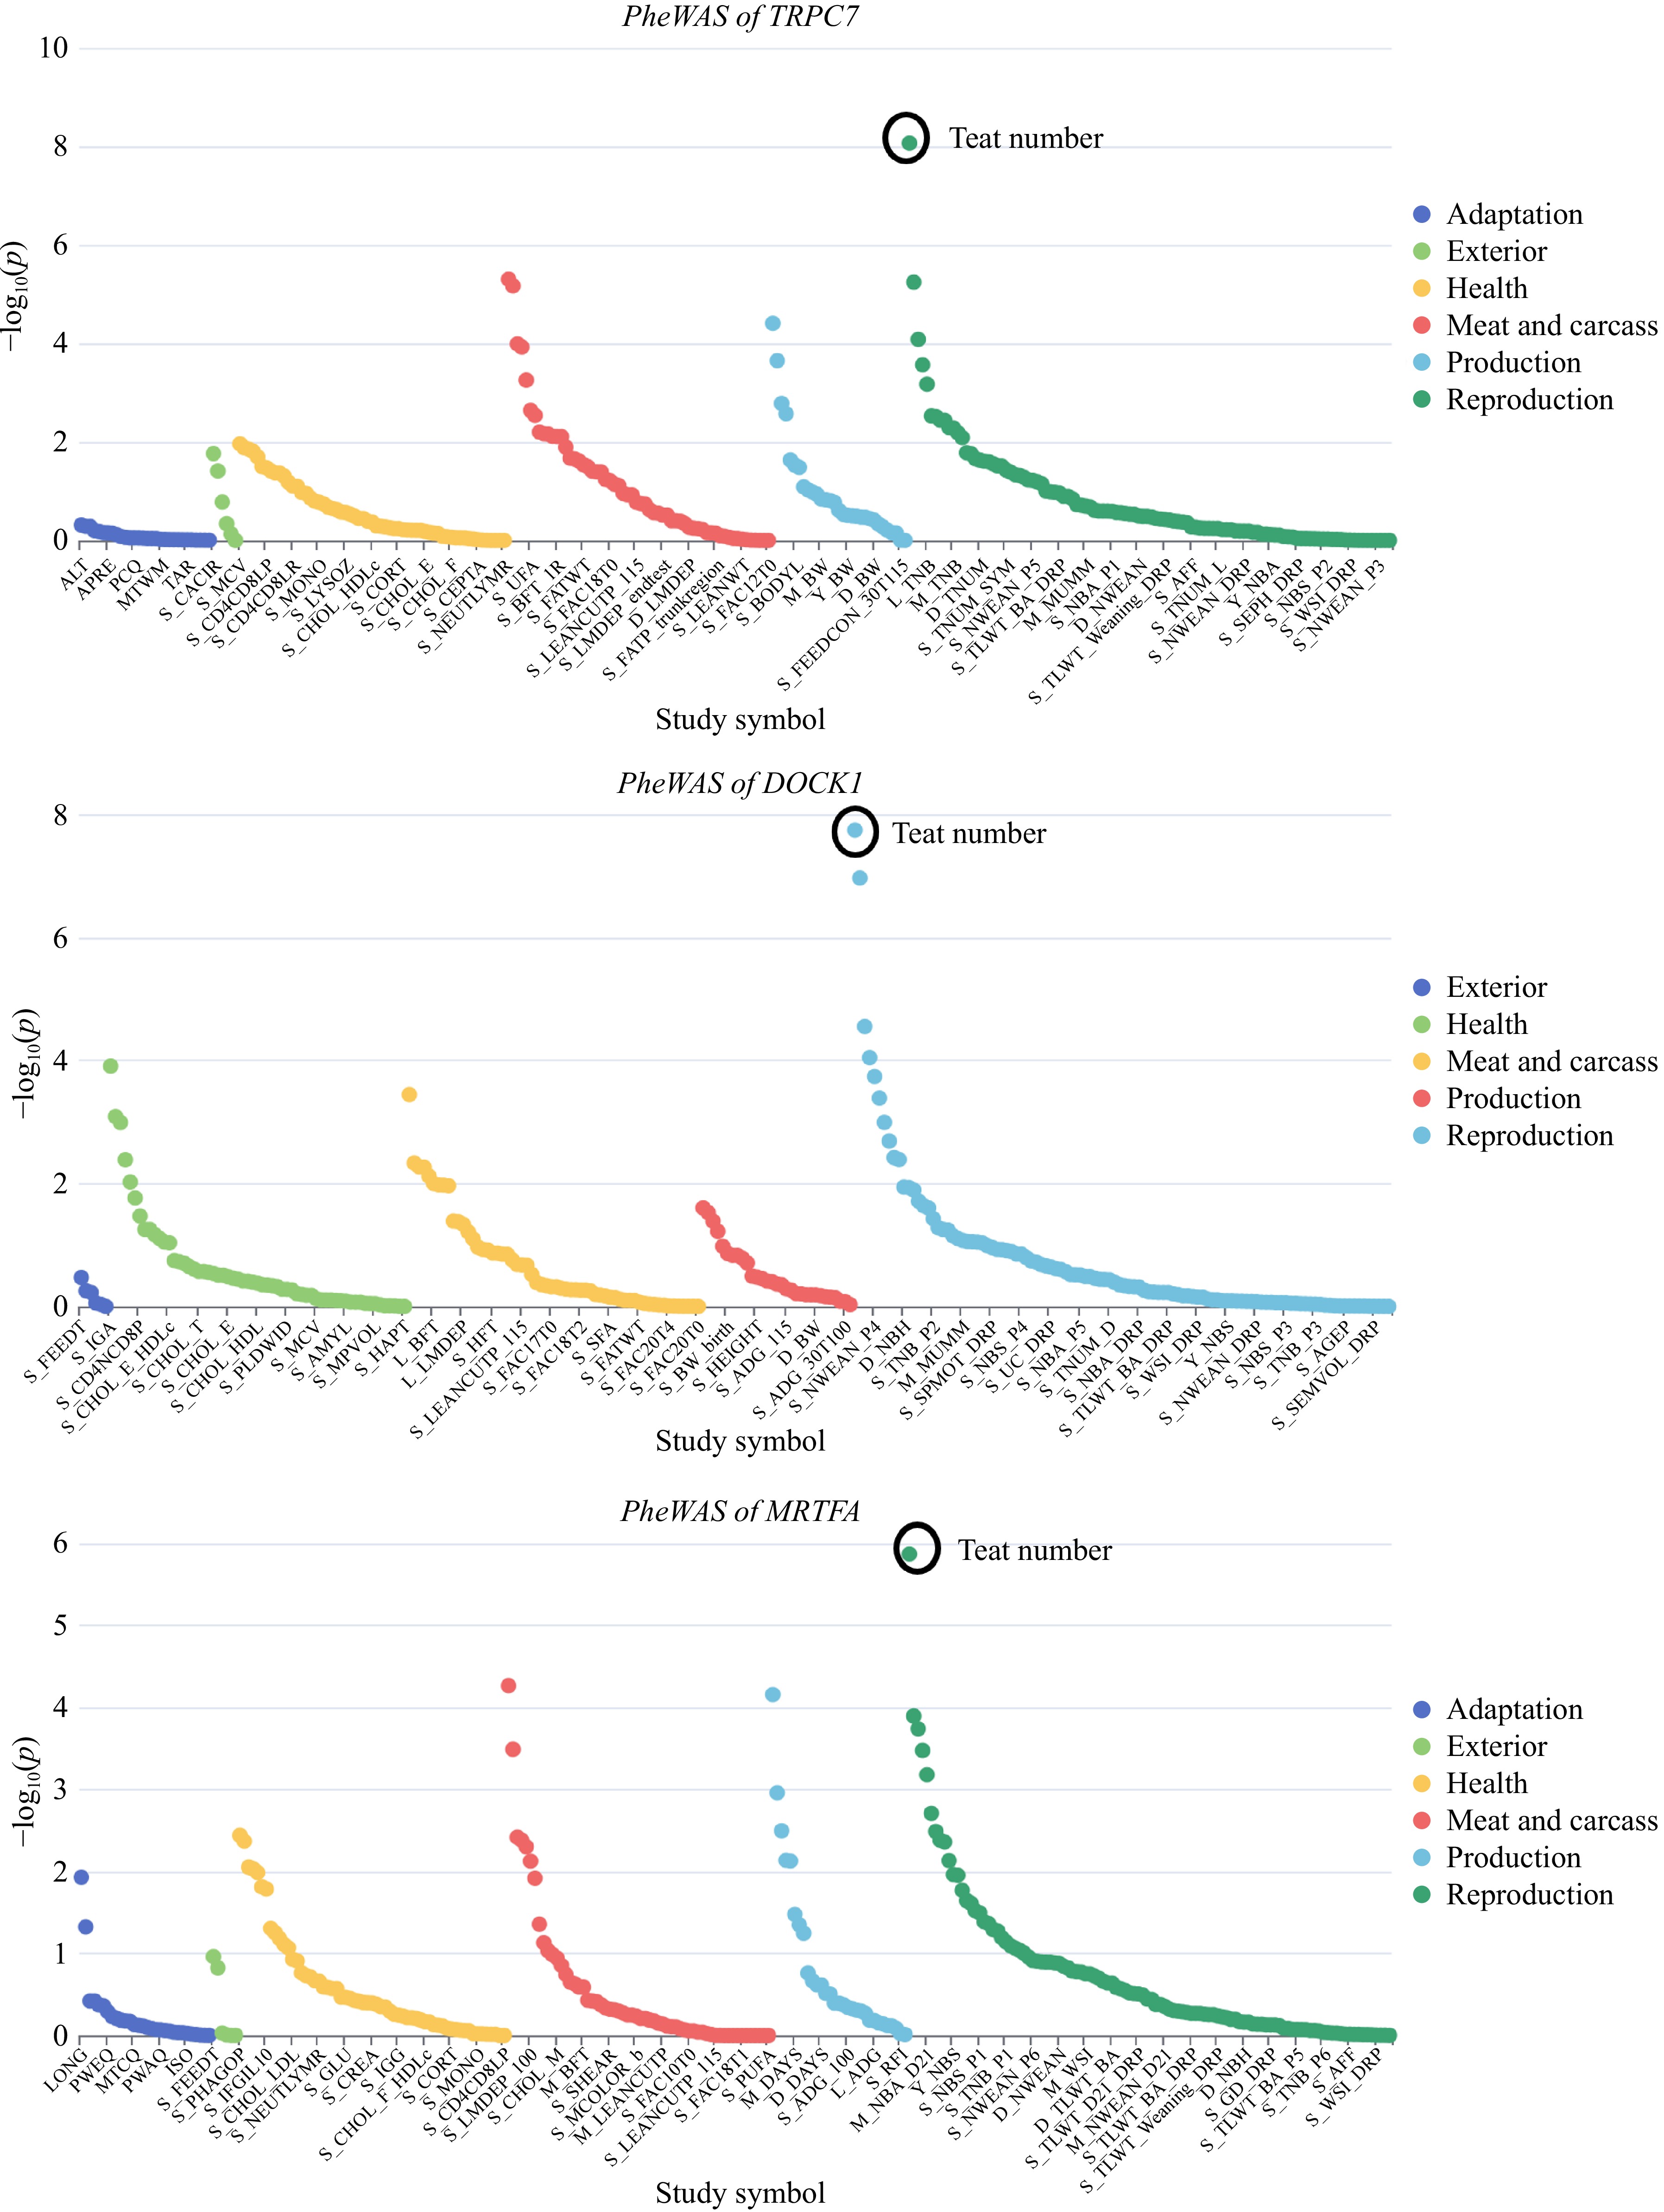
Figure 6.
Results of the PheWAS analysis based on the identified candidate genes.
-
Groups N1 Min2 Max3 Mean4 ± SE5 French CG Large White pigs 50 16 20 18.27 ± 0.10 French Cooperl Large White pigs 50 18 20 18.32 ± 0.07 Dutch Topigs Large White pigs 50 18 19 18.26 ± 0.06 Danish Large White pig 50 10 13 12.40 ± 0.09 1 Number of individuals with phenotypic records. 2 Minimum of phenotype. 3 Maximum of phenotype. 4 Mean of phenotype. 5 Standard error. Table 1.
Descriptive statistics of the number of teats in 50 Large White pigs of each strain.
-
Group Methods Genes Trait CG nSL PAFAH1B1 Teat number UBE2G1 Teat number DNAH12 Teat number PCM1 Teat number PACC1 Teat number iHS CDH13 Teat number CLR JAZF1 Teat number Cooperl CLR ARL4C Teat number RAPGEF2 Teat number Topig nSL DOCK1 Teat number PCM1 Teat number CLR DNAH12 Teat number DOCK1 Teat number PCM1 Teat number * This table is based on the information retrieved in the pig QTLdb database (accessed on 2 April 2024). Table 2.
Potential candidate genes detected using all methods*.
Figures
(6)
Tables
(2)