-
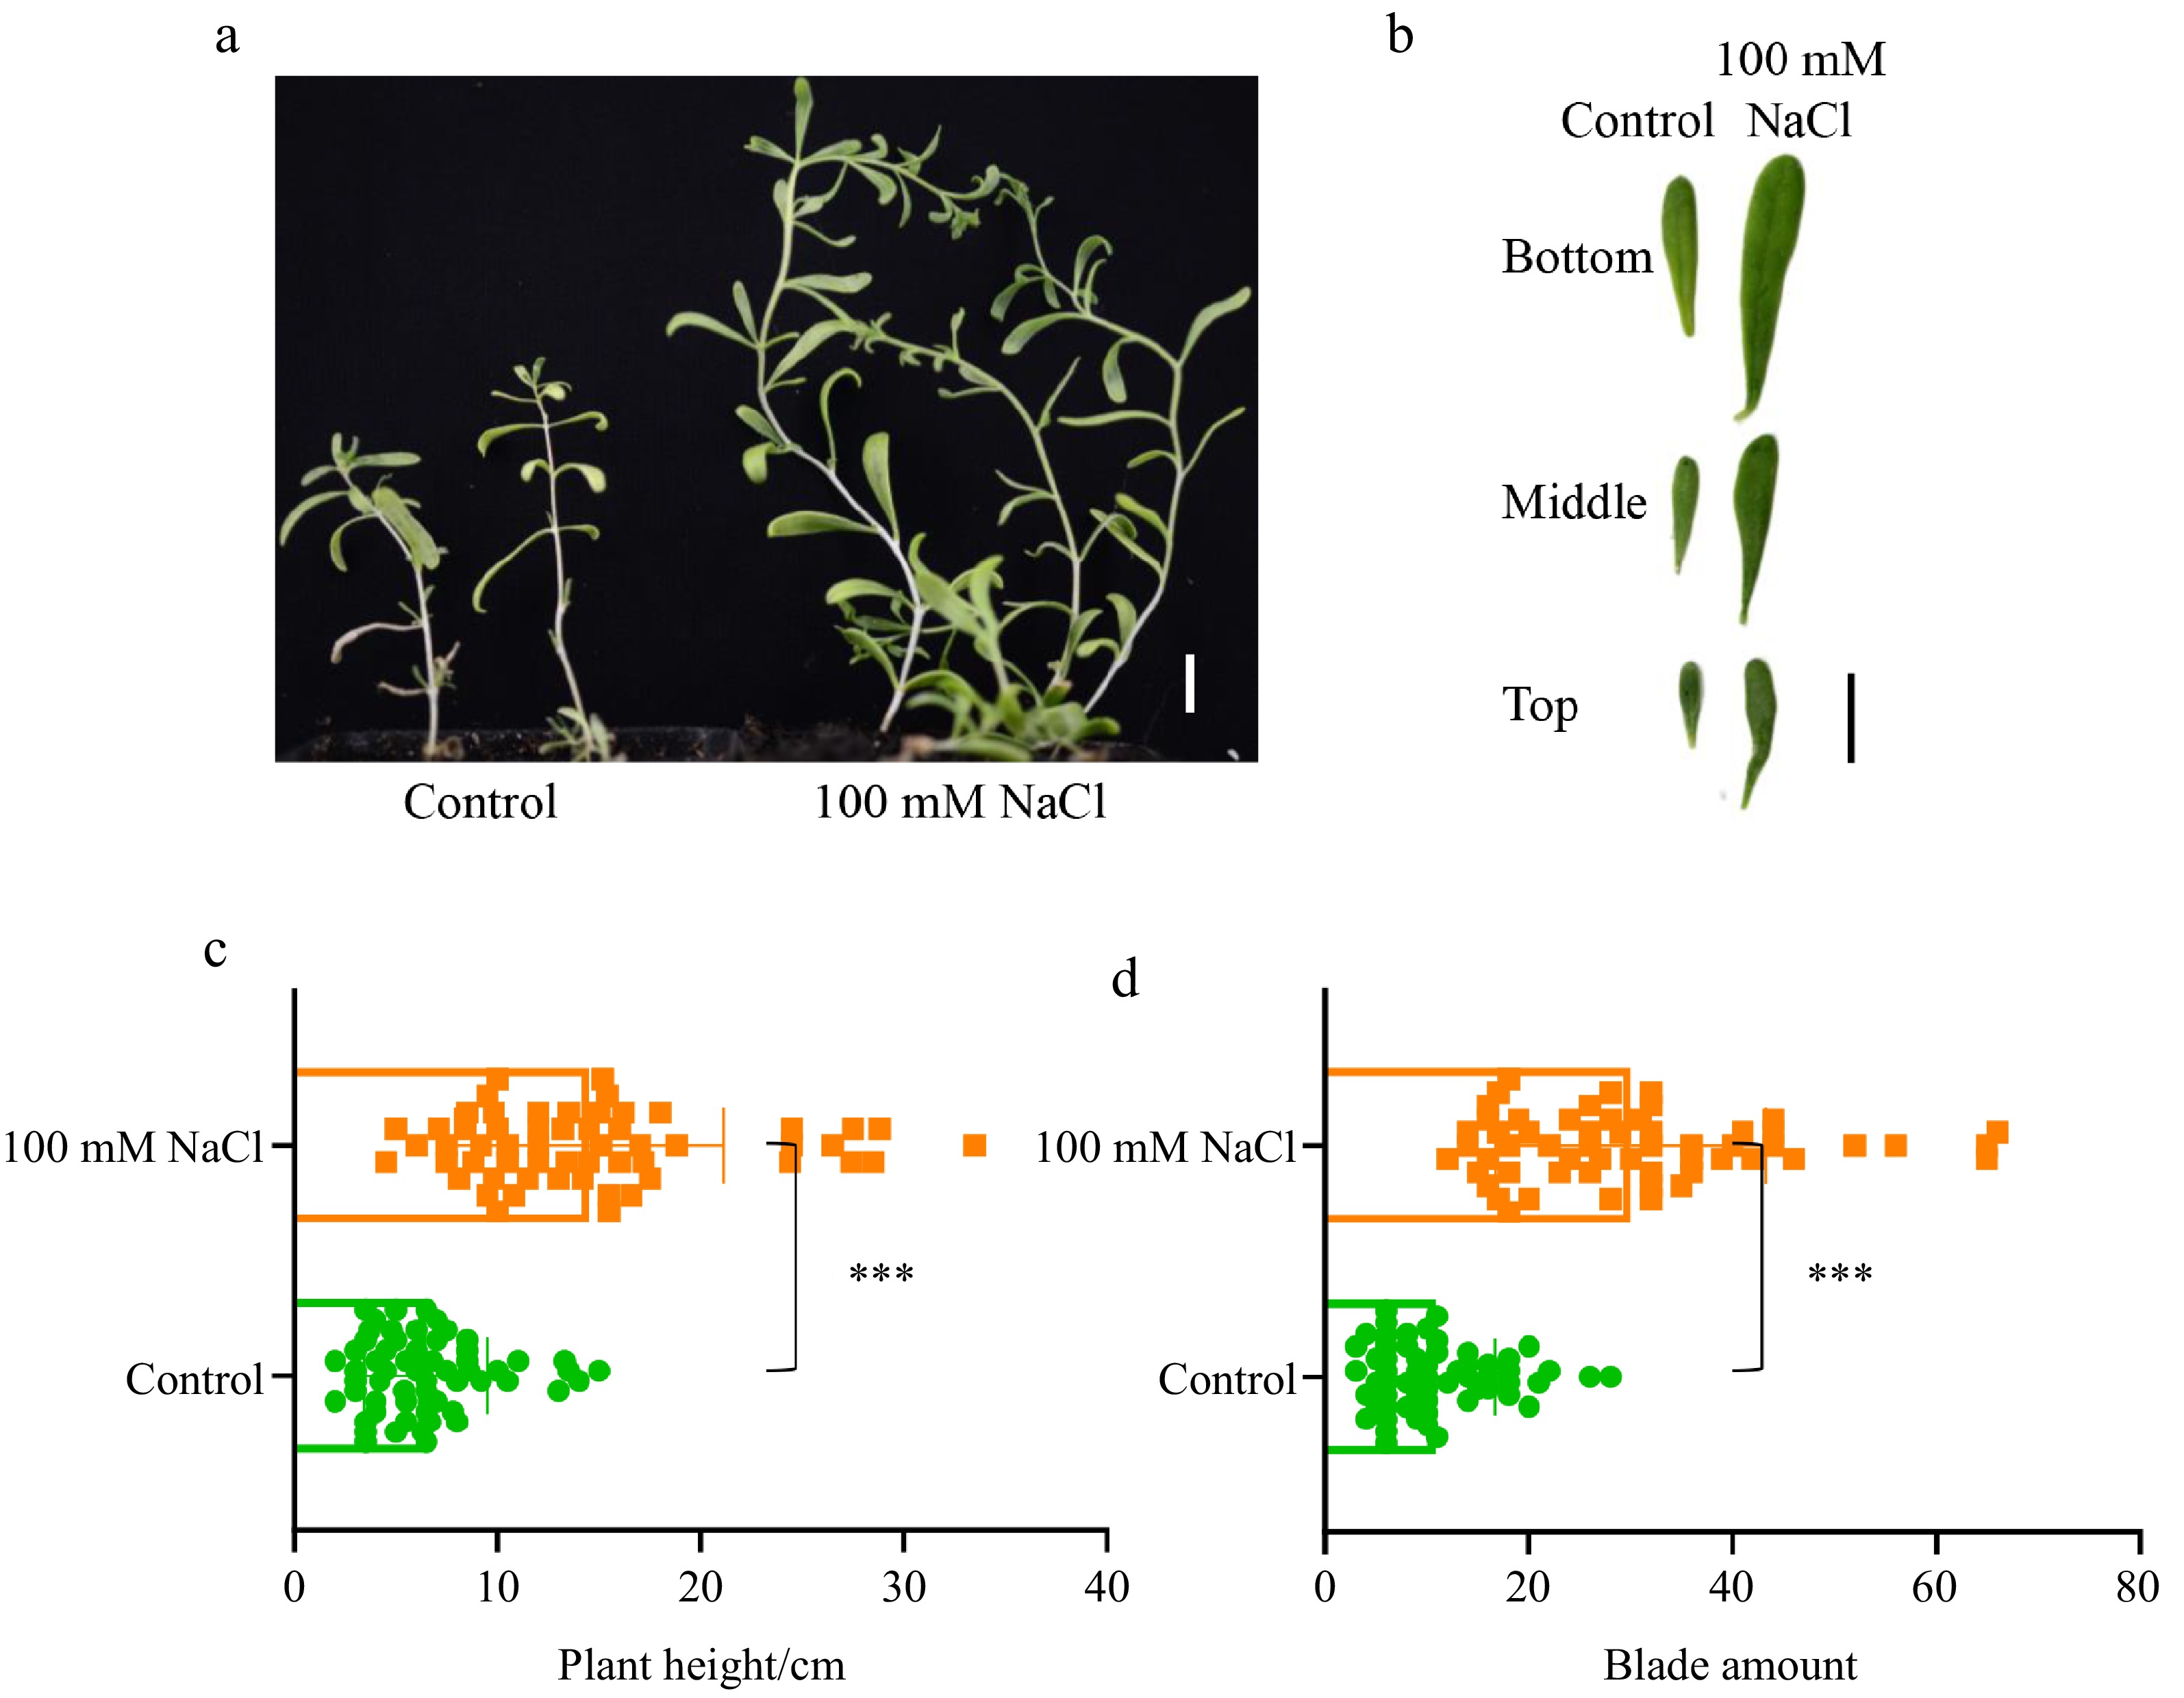
Figure 1.
Growth performance of Nitraria sibirica under salt stress conditions. (a) Two-month-old N. sibirica seedlings grown in soil irrigated with tap water (Control) or 100 mM NaCl following germination. (b) Leaves collected from the basal, middle, and apical sections of seedlings as described in (a). Scale bar = 1 cm. (c) Plant height, and (d) leaf number of two-month-old seedlings grown under the conditions described in (a). Data are presented as means ± standard deviation (SD) from three biological replicates. Statistical significance was determined using a Student's t-test, where *** indicates p < 0.001.
-
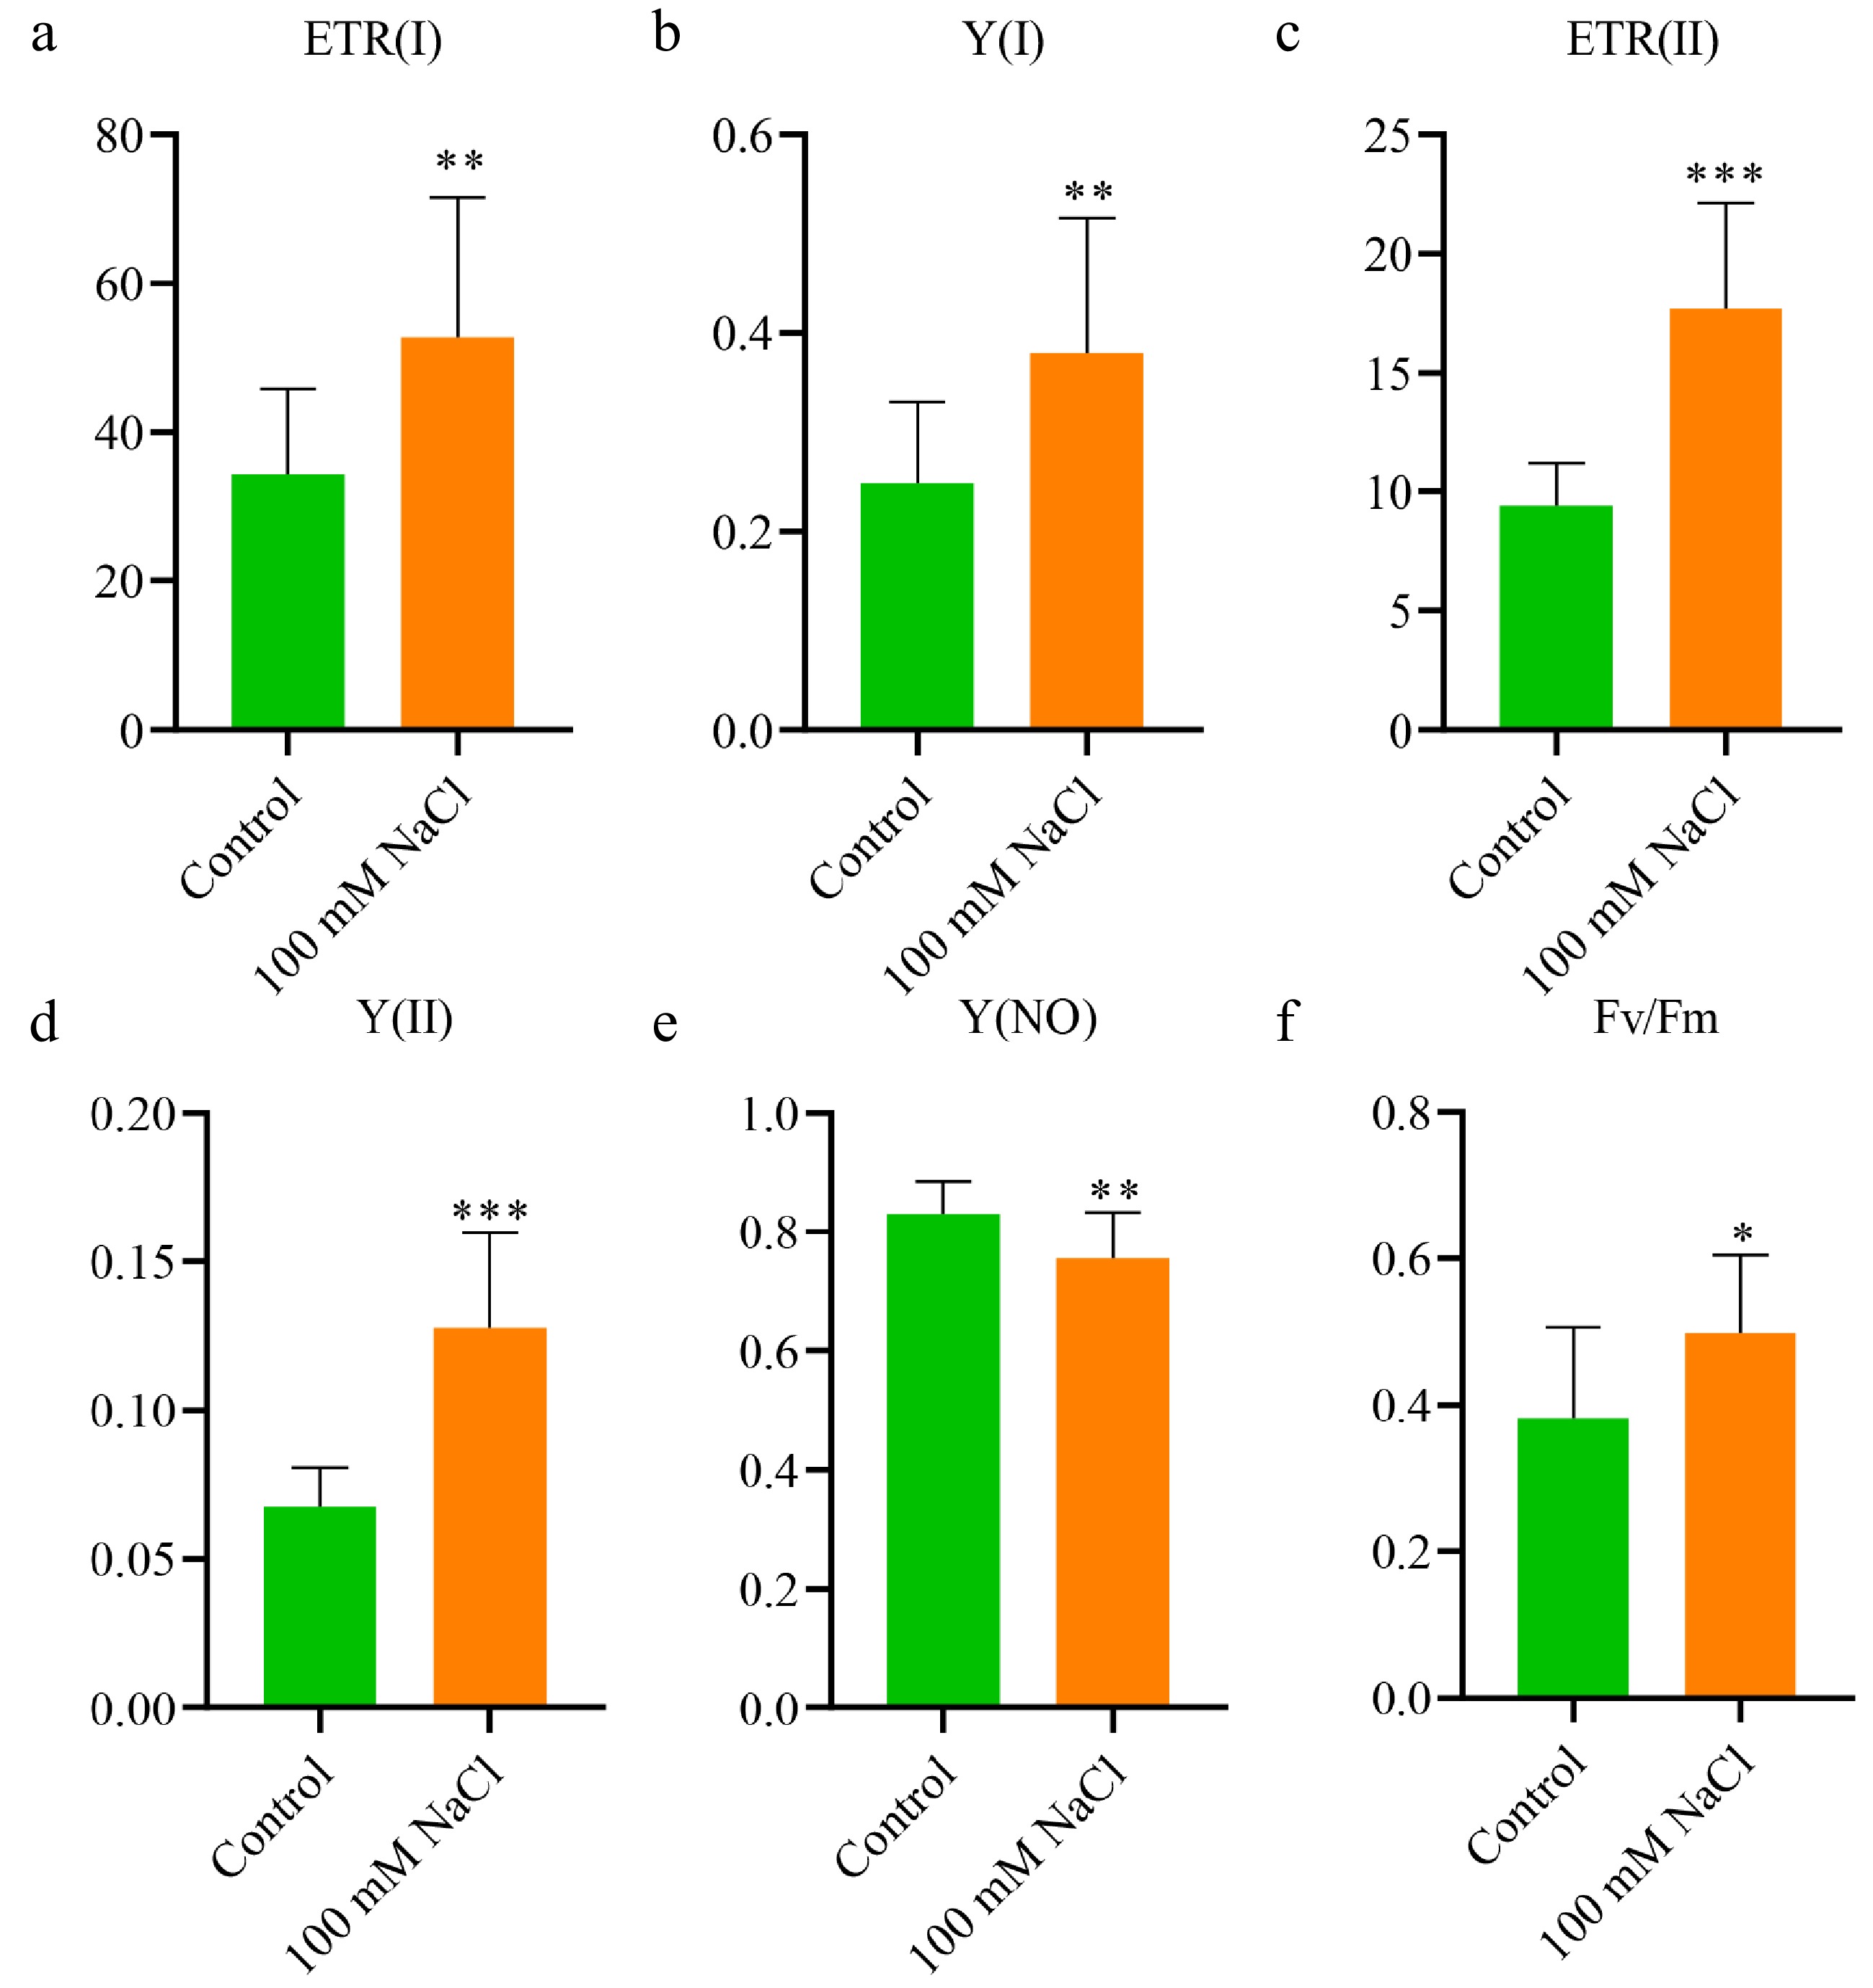
Figure 2.
Enhanced photosynthetic activity of N. sibirica in response to salt treatment. (a) Electron transport rate of Photosystem I (ETR(I)); (b) Quantum yield of Photosystem I photochemistry (Y(I)); (c) Electron transport rate of Photosystem II (ETR(II)); (d) Quantum yield of Photosystem II photochemistry (Y(II)); (e) Quantum yield of non-photochemical quenching (Y(NO)); (f) Maximal quantum yield of PS II (Fv/Fm). Photosynthetic parameters were measured in seedlings grown under normal conditions (Control) or treated with 100 mM NaCl for two months. Data are presented as means ± standard deviation (SD) from three biological replicates. Statistical significance was determined using a t-test: * p < 0.05, ** p < 0.01, *** p < 0.001.
-
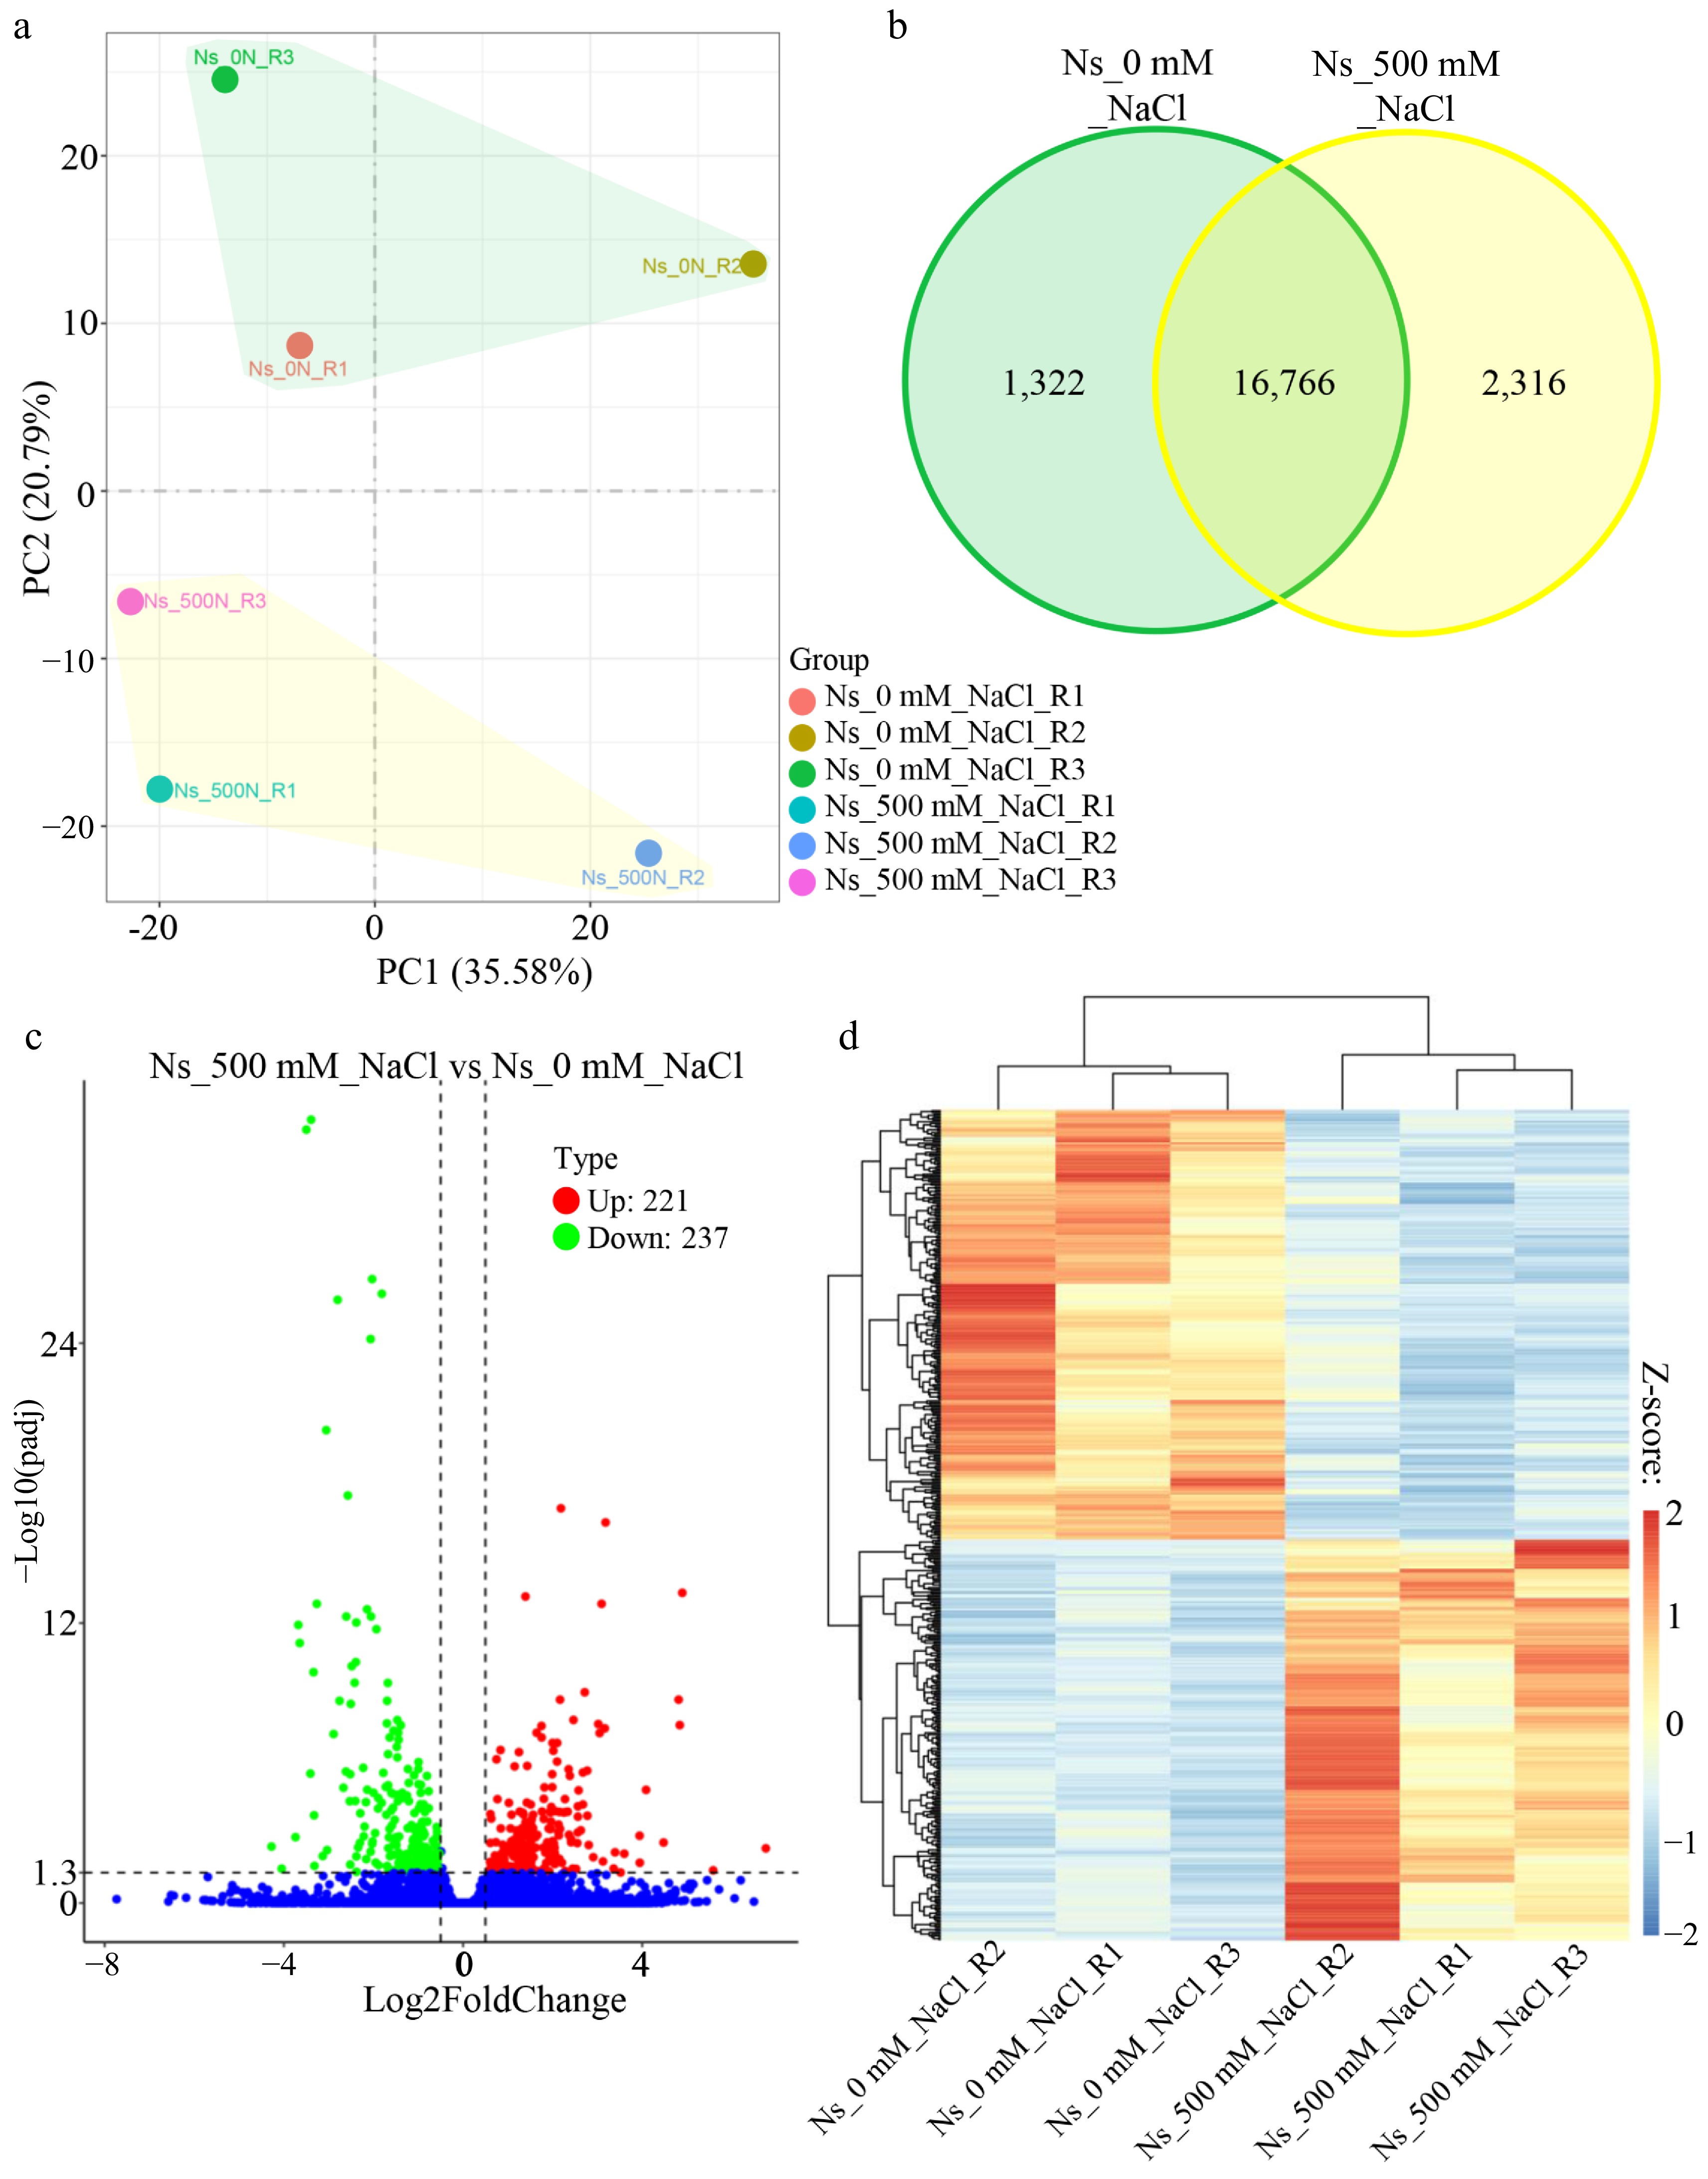
Figure 3.
Salt induces differential gene expression in N. sibirica. (a) PCA plot of gene expression in leaves of control and salt-treated seedlings generated using the ggplot2 R package (Version 3.0.3). Seedlings were treated with 500 mM NaCl for 1 h compared to controls. (b) Venn diagram showing the number of genes uniquely expressed in control and salt-treated seedlings. Green shading represents control-specific genes, while yellow shading indicates salt-treated-specific genes. (c) Volcano plot displaying fold changes of differentially expressed genes (DEGs) between 500 mM NaCl-treated (Ns_500 mM_NaCl) and control (Ns_0 mM_NaCl) seedlings. Red and green dots represent upregulated and downregulated DEGs, respectively, based on |Log2Fold change| > 0.5, and an adjusted p value (q value) < 0.05. '221' and '237' denote the number of upregulated and downregulated DEGs. (d) Heatmap and hierarchical clustering of 458 DEGs induced by salt treatment. Expression levels are color-coded based on fragments per kilobase of transcript per million mapped reads (FPKM), scaled by row using Z-scores. Red and blue indicate high and low expression, respectively.
-
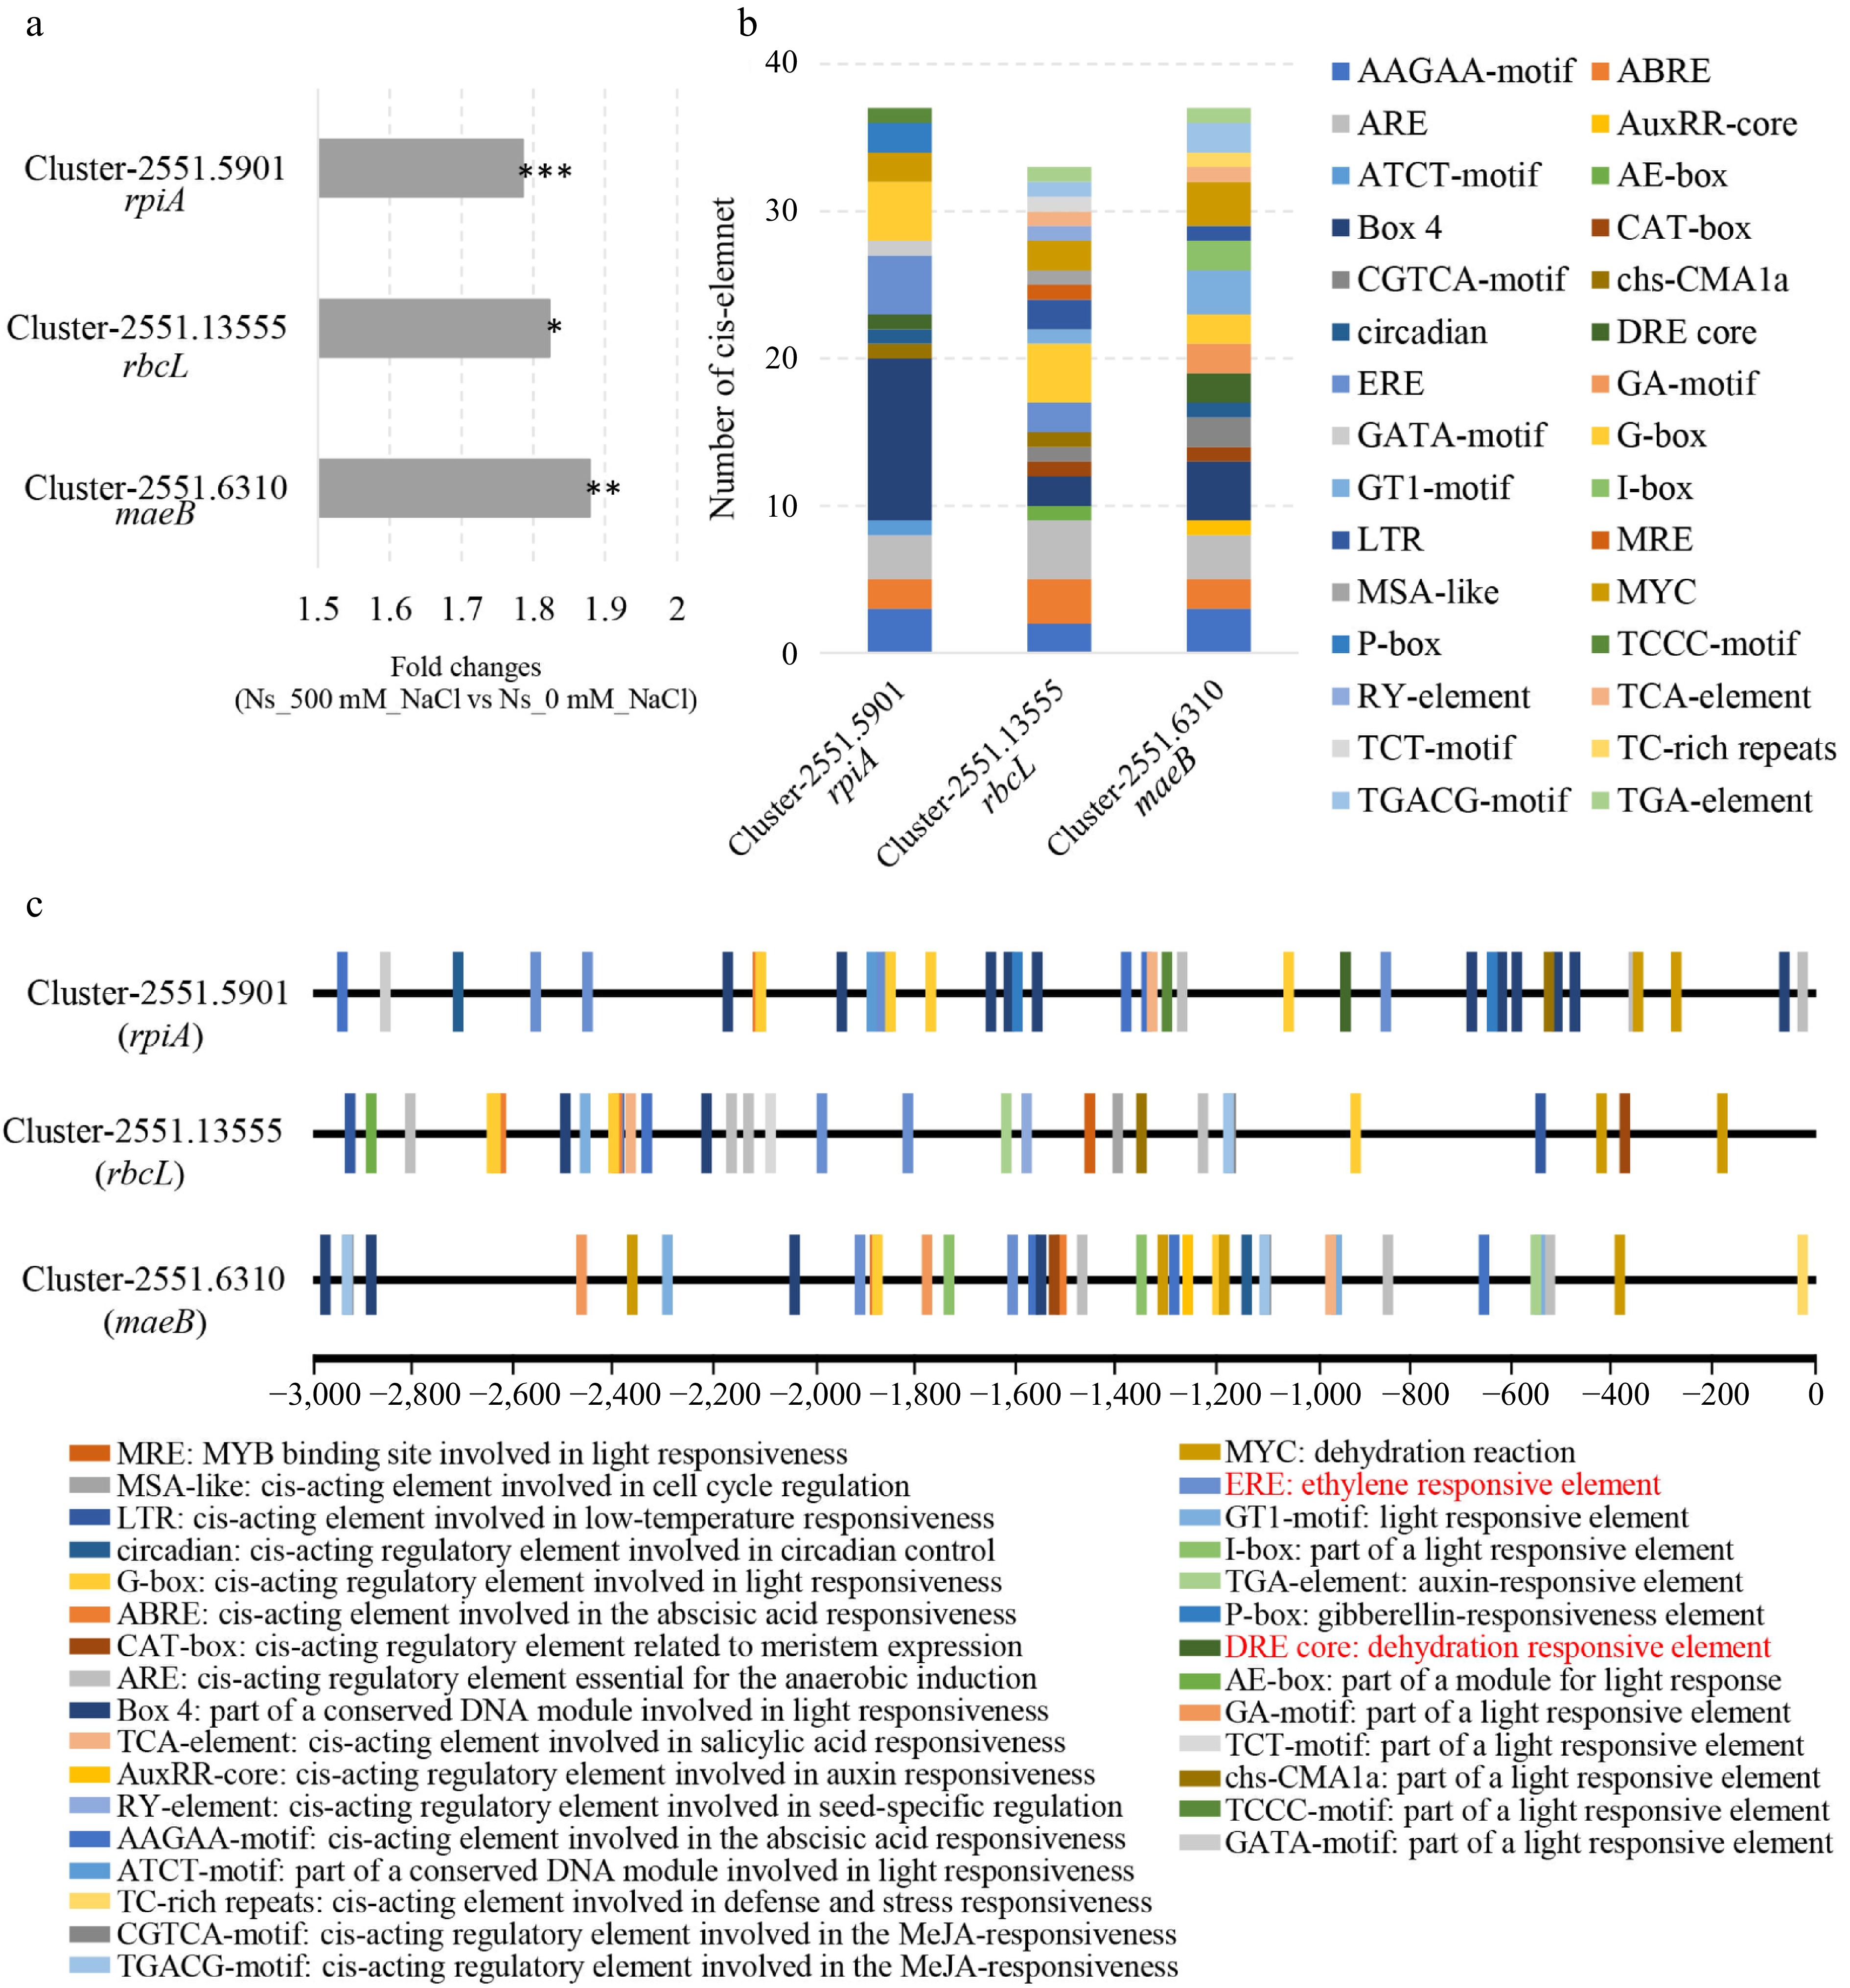
Figure 4.
Identification of specific cis-elements in the promoter regions of DEGs involved in carbon fixation. (a) Fold changes in the expression of rpiA, rbcL, and maeB in N. sibirica treated with 500 mM NaCl (Ns_500 mM_NaCl) compared to control (Ns_0 mM_NaCl). (b) Number of cis-acting elements identified in the promoter regions of rpiA, rbcL, and maeB. (c) Distribution of cis-acting element in the 3 kb upstream regions of rpiA, rbcL, and maeB. Elements responsive to light, low temperature, abscisic acid, salicylic acid, auxin, methyl jasmonate (MeJA), gibberellin, and ethylene are indicated by different colored boxes.
-
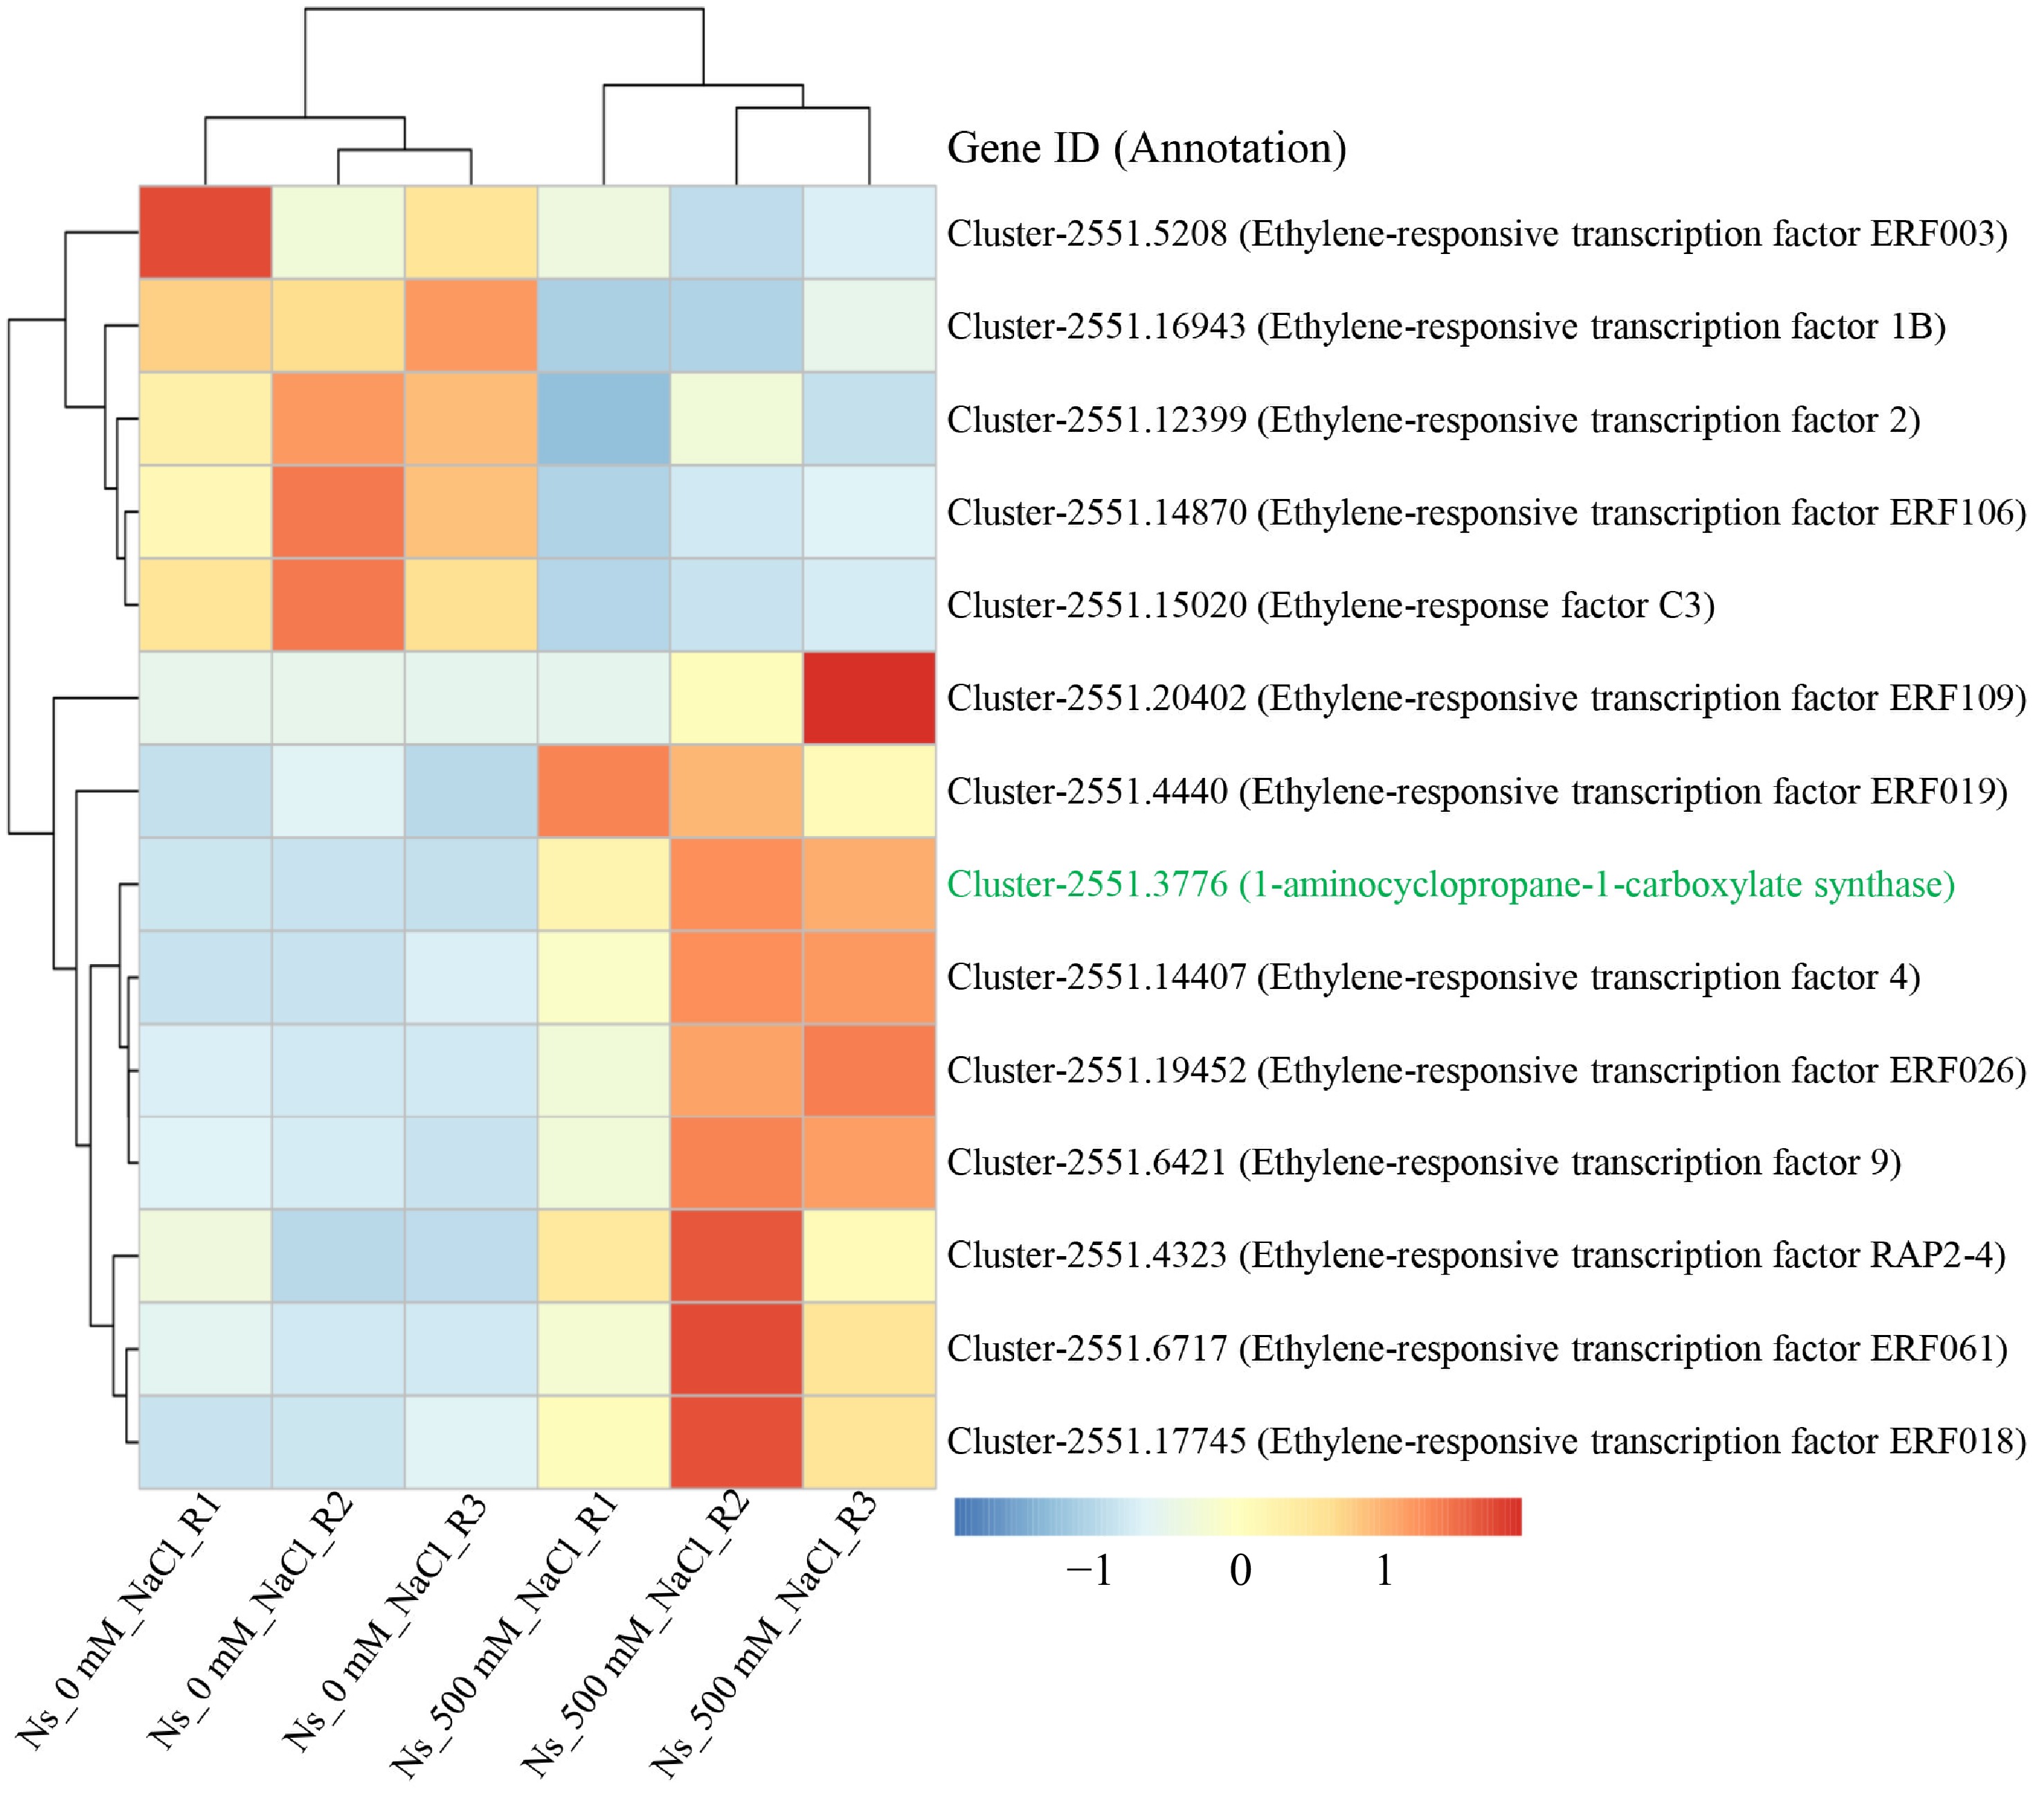
Figure 5.
Salt treatment induces DEGs involved in ethylene signal transduction. Heatmap (right) and clustering analysis (left) of differentially expressed genes (DEGs) related to ethylene biosynthesis and response. Gene expression patterns are color-coded based on FPKM values scaled by row using Z-scores, ranging from low (blue) to high (red). 'Ns_0 mM_NaCl' refers to control seedlings, while 'Ns_500 mM_NaCl' refers to seedlings treated with 500 mM NaCl. Gene IDs and annotations are displayed alongside the heatmap. The 1-aminocyclopropane-1-carboxylate synthase (ACS), highlighted in green, catalyzes the rate-limiting step in ethylene biosynthesis.
-
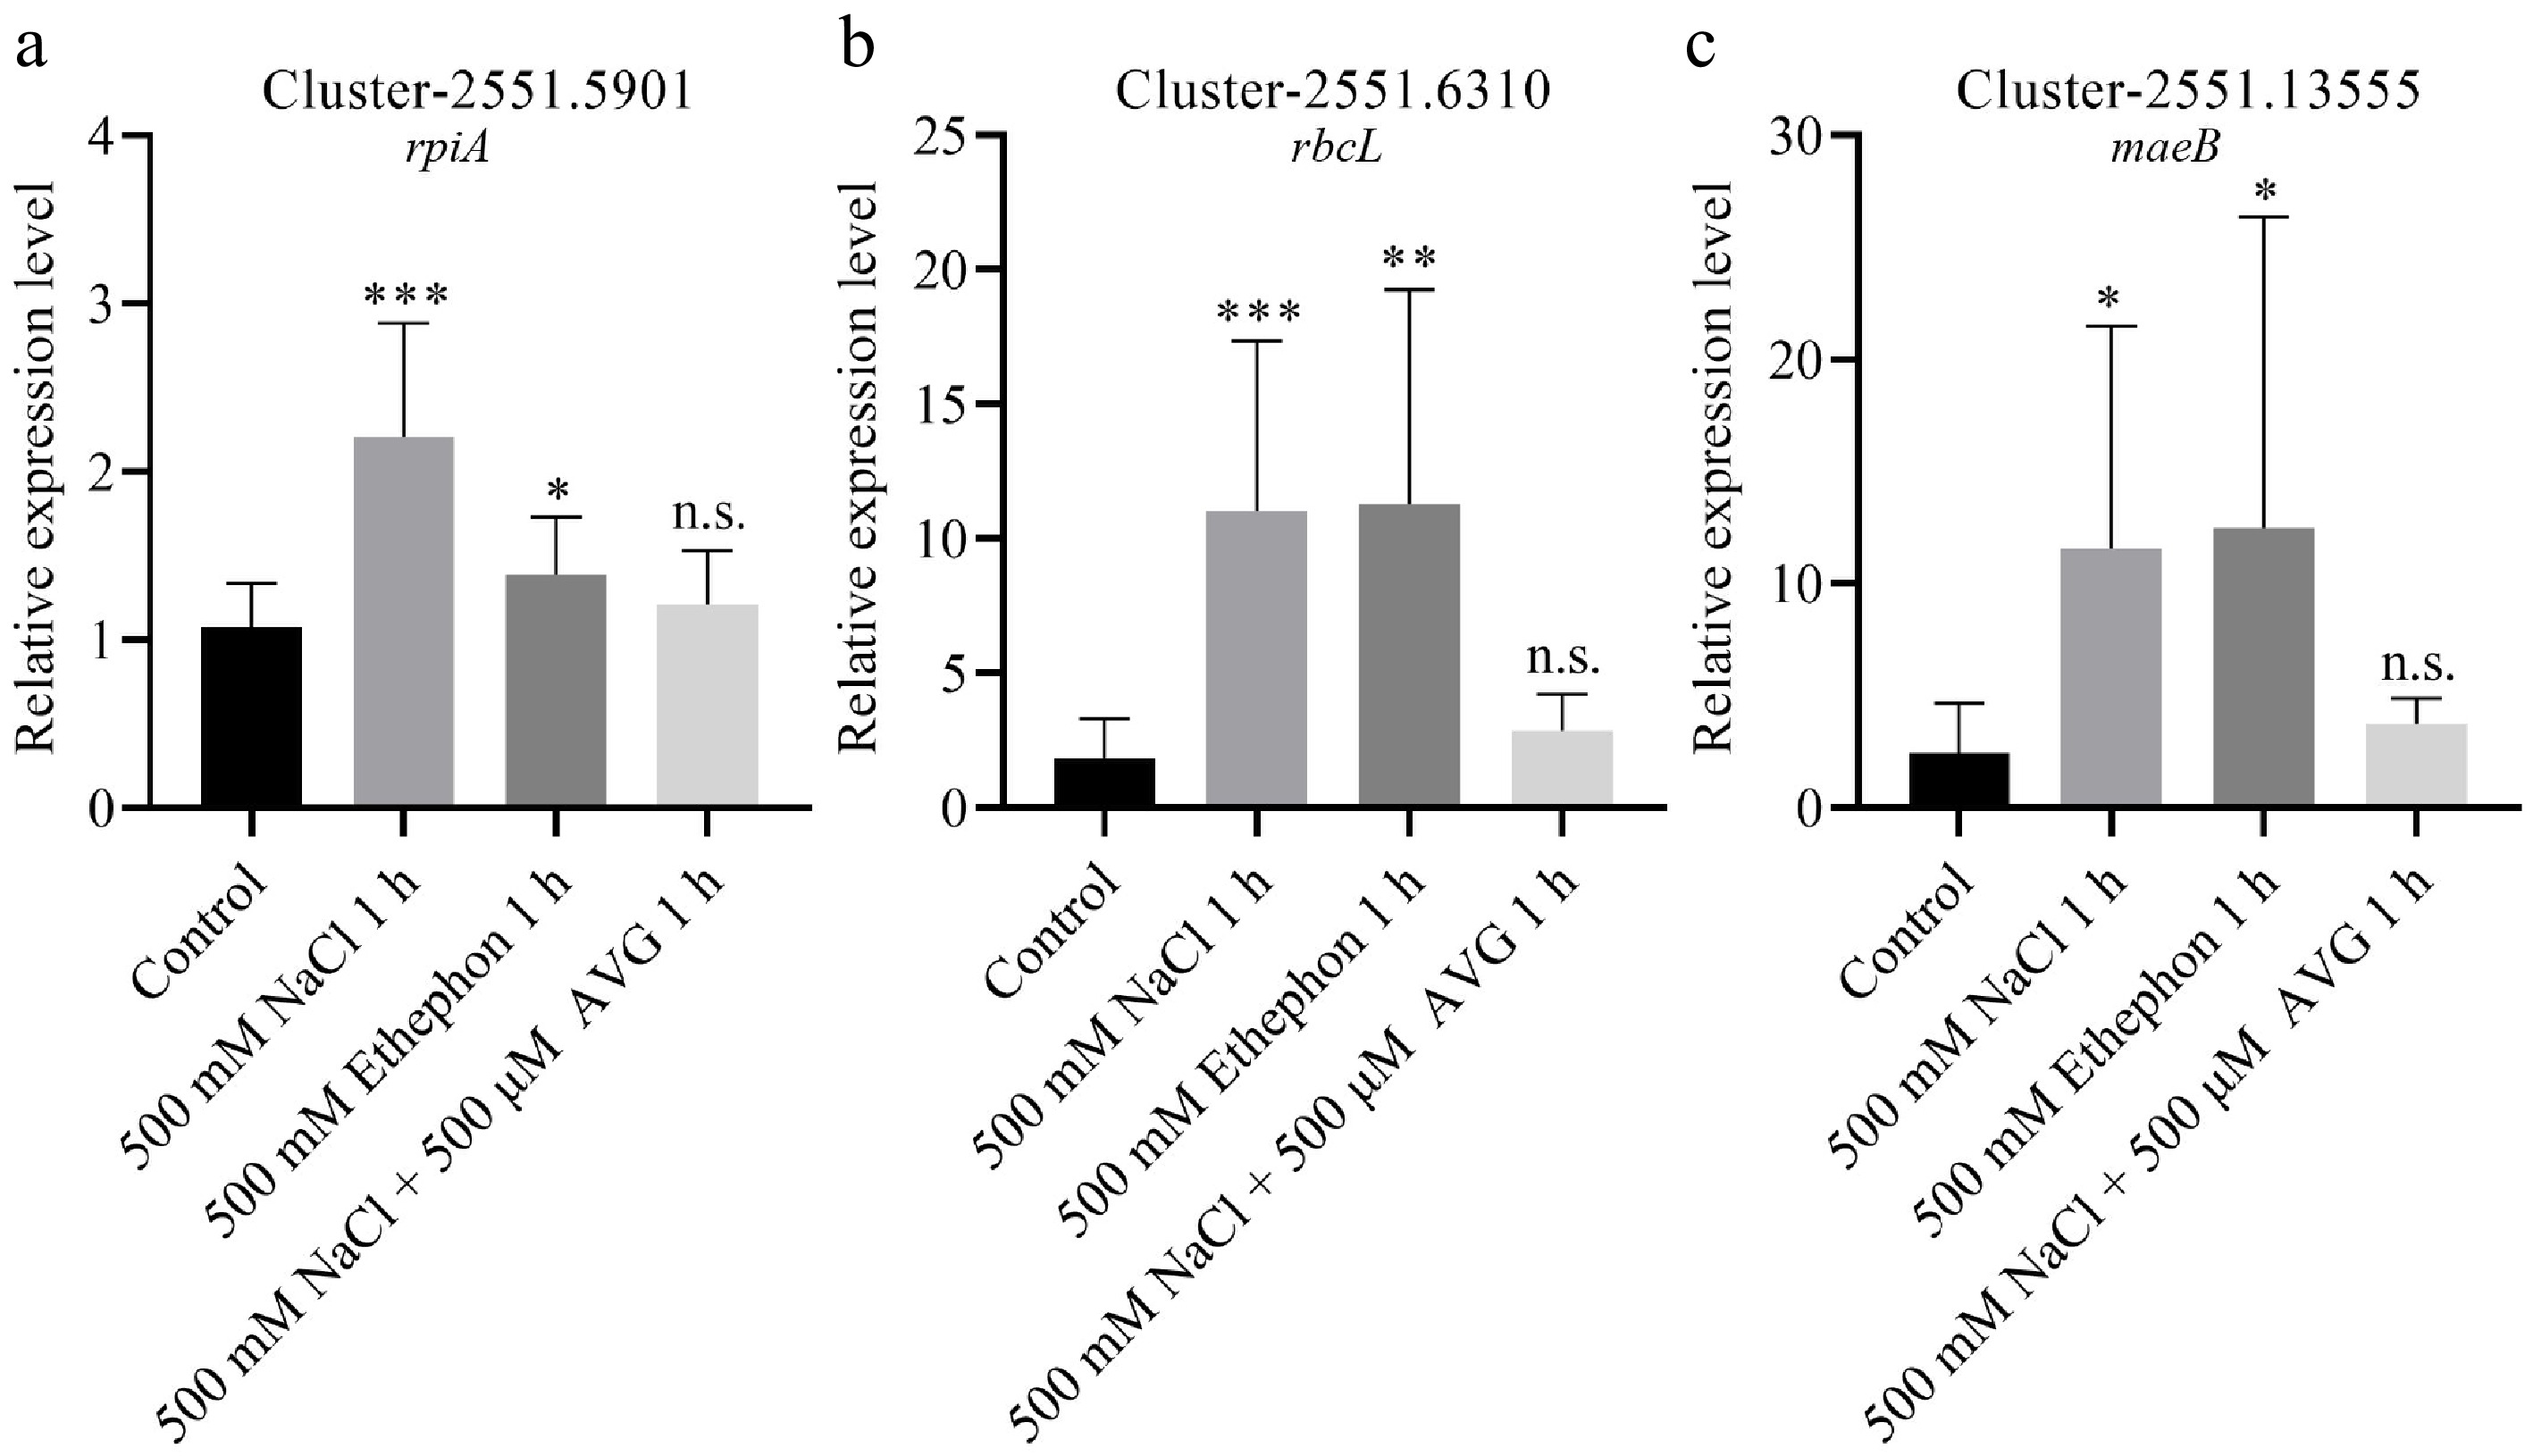
Figure 6.
DEGs involved in carbon fixation positively responded to salt and ethephon treatment. (a) Relative expression levels of rpiA, (b) rbcL, and (c) maeB were analyzed in seedlings treated with 500 mM NaCl, 500 mM ethephon, and 500 μM aminoethoxyvinylglycine (AVG) in combination with 500 mM NaCl for 1 h. Seedlings treated with 0 mM NaCl served as the control (Control).
-
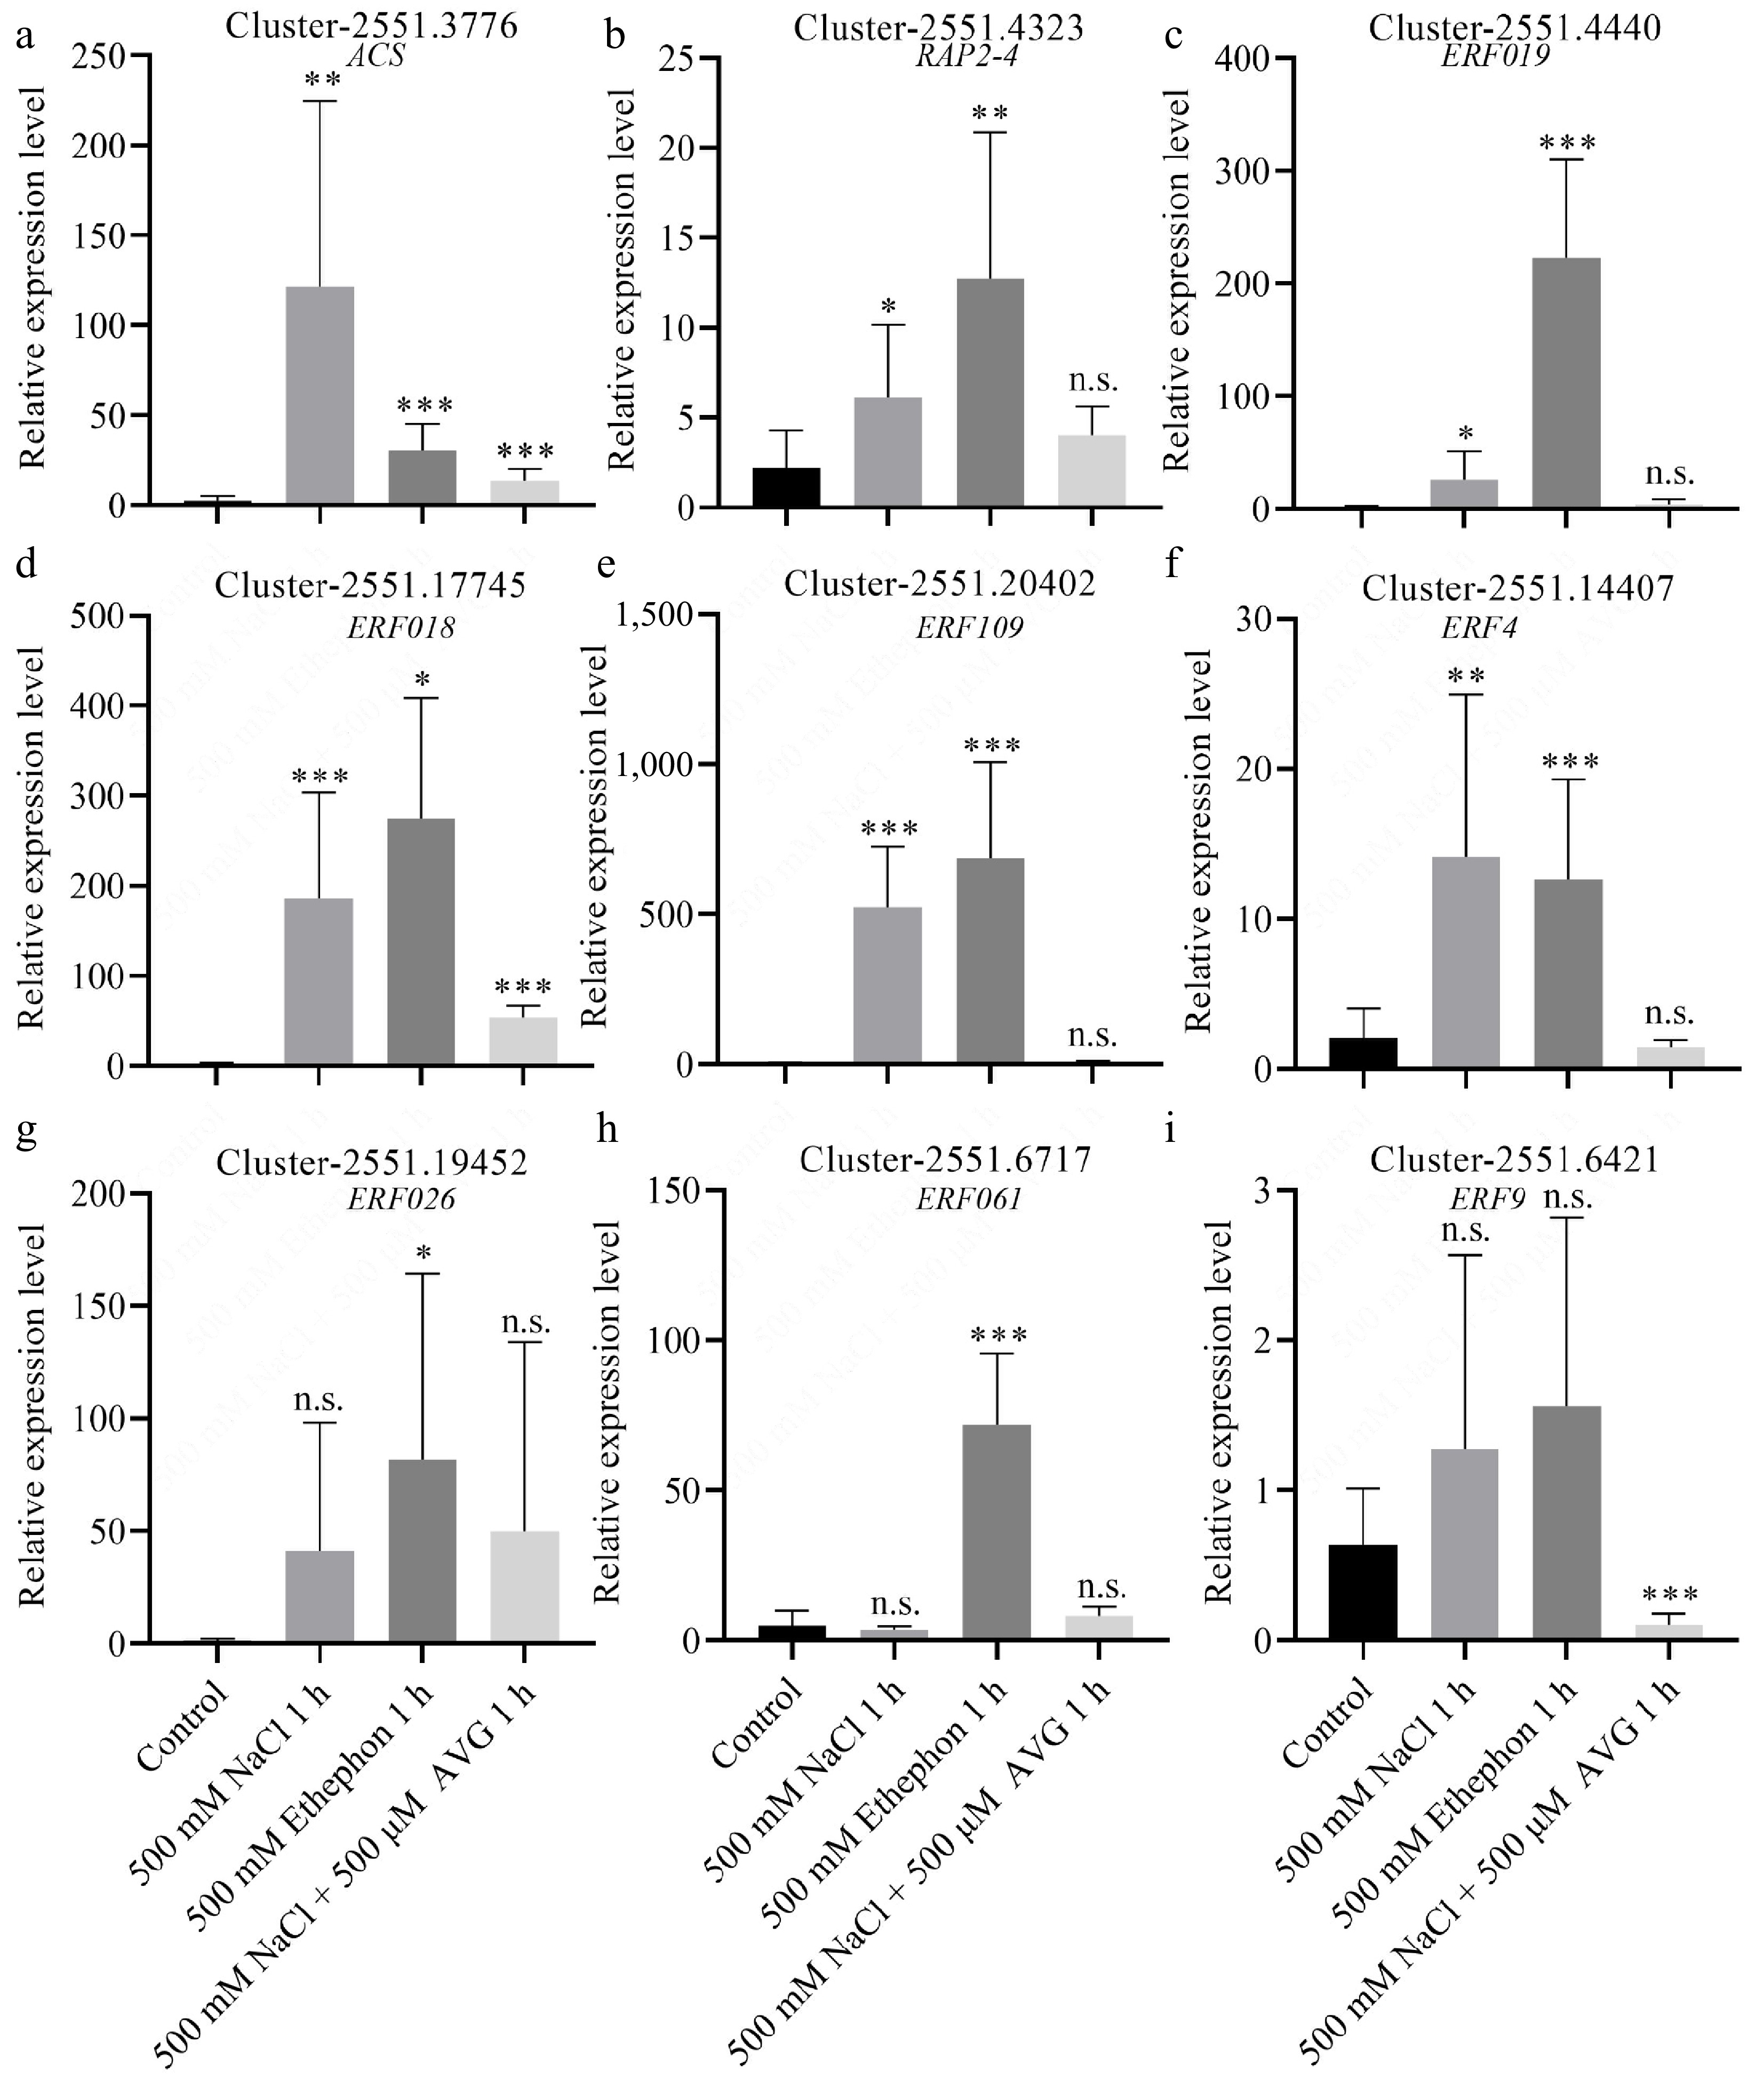
Figure 7.
DEGs involved in ethylene signaling positively respond to salt and ethephon treatments. (a) Relative expression levels of genes encoding 1-aminocyclopropane carboxylic acid synthase (ACS), (b) Ethylene-responsive transcription factor (ERF) RAP2-4, (c) ERF109, (d) ERF018, (e) ERF109, (f) ERF4, (g) ERF026, (h) ERF061, and (i) ERF9. Expression was measured in seedlings treated with 500 mM NaCl, 500 mM ethephon, and 500 μM aminoethoxyvinylglycine (AVG) in combination with 500 mM NaCl for 1 h, respectively. Control seedlings were treated with 0 mM NaCl.
-
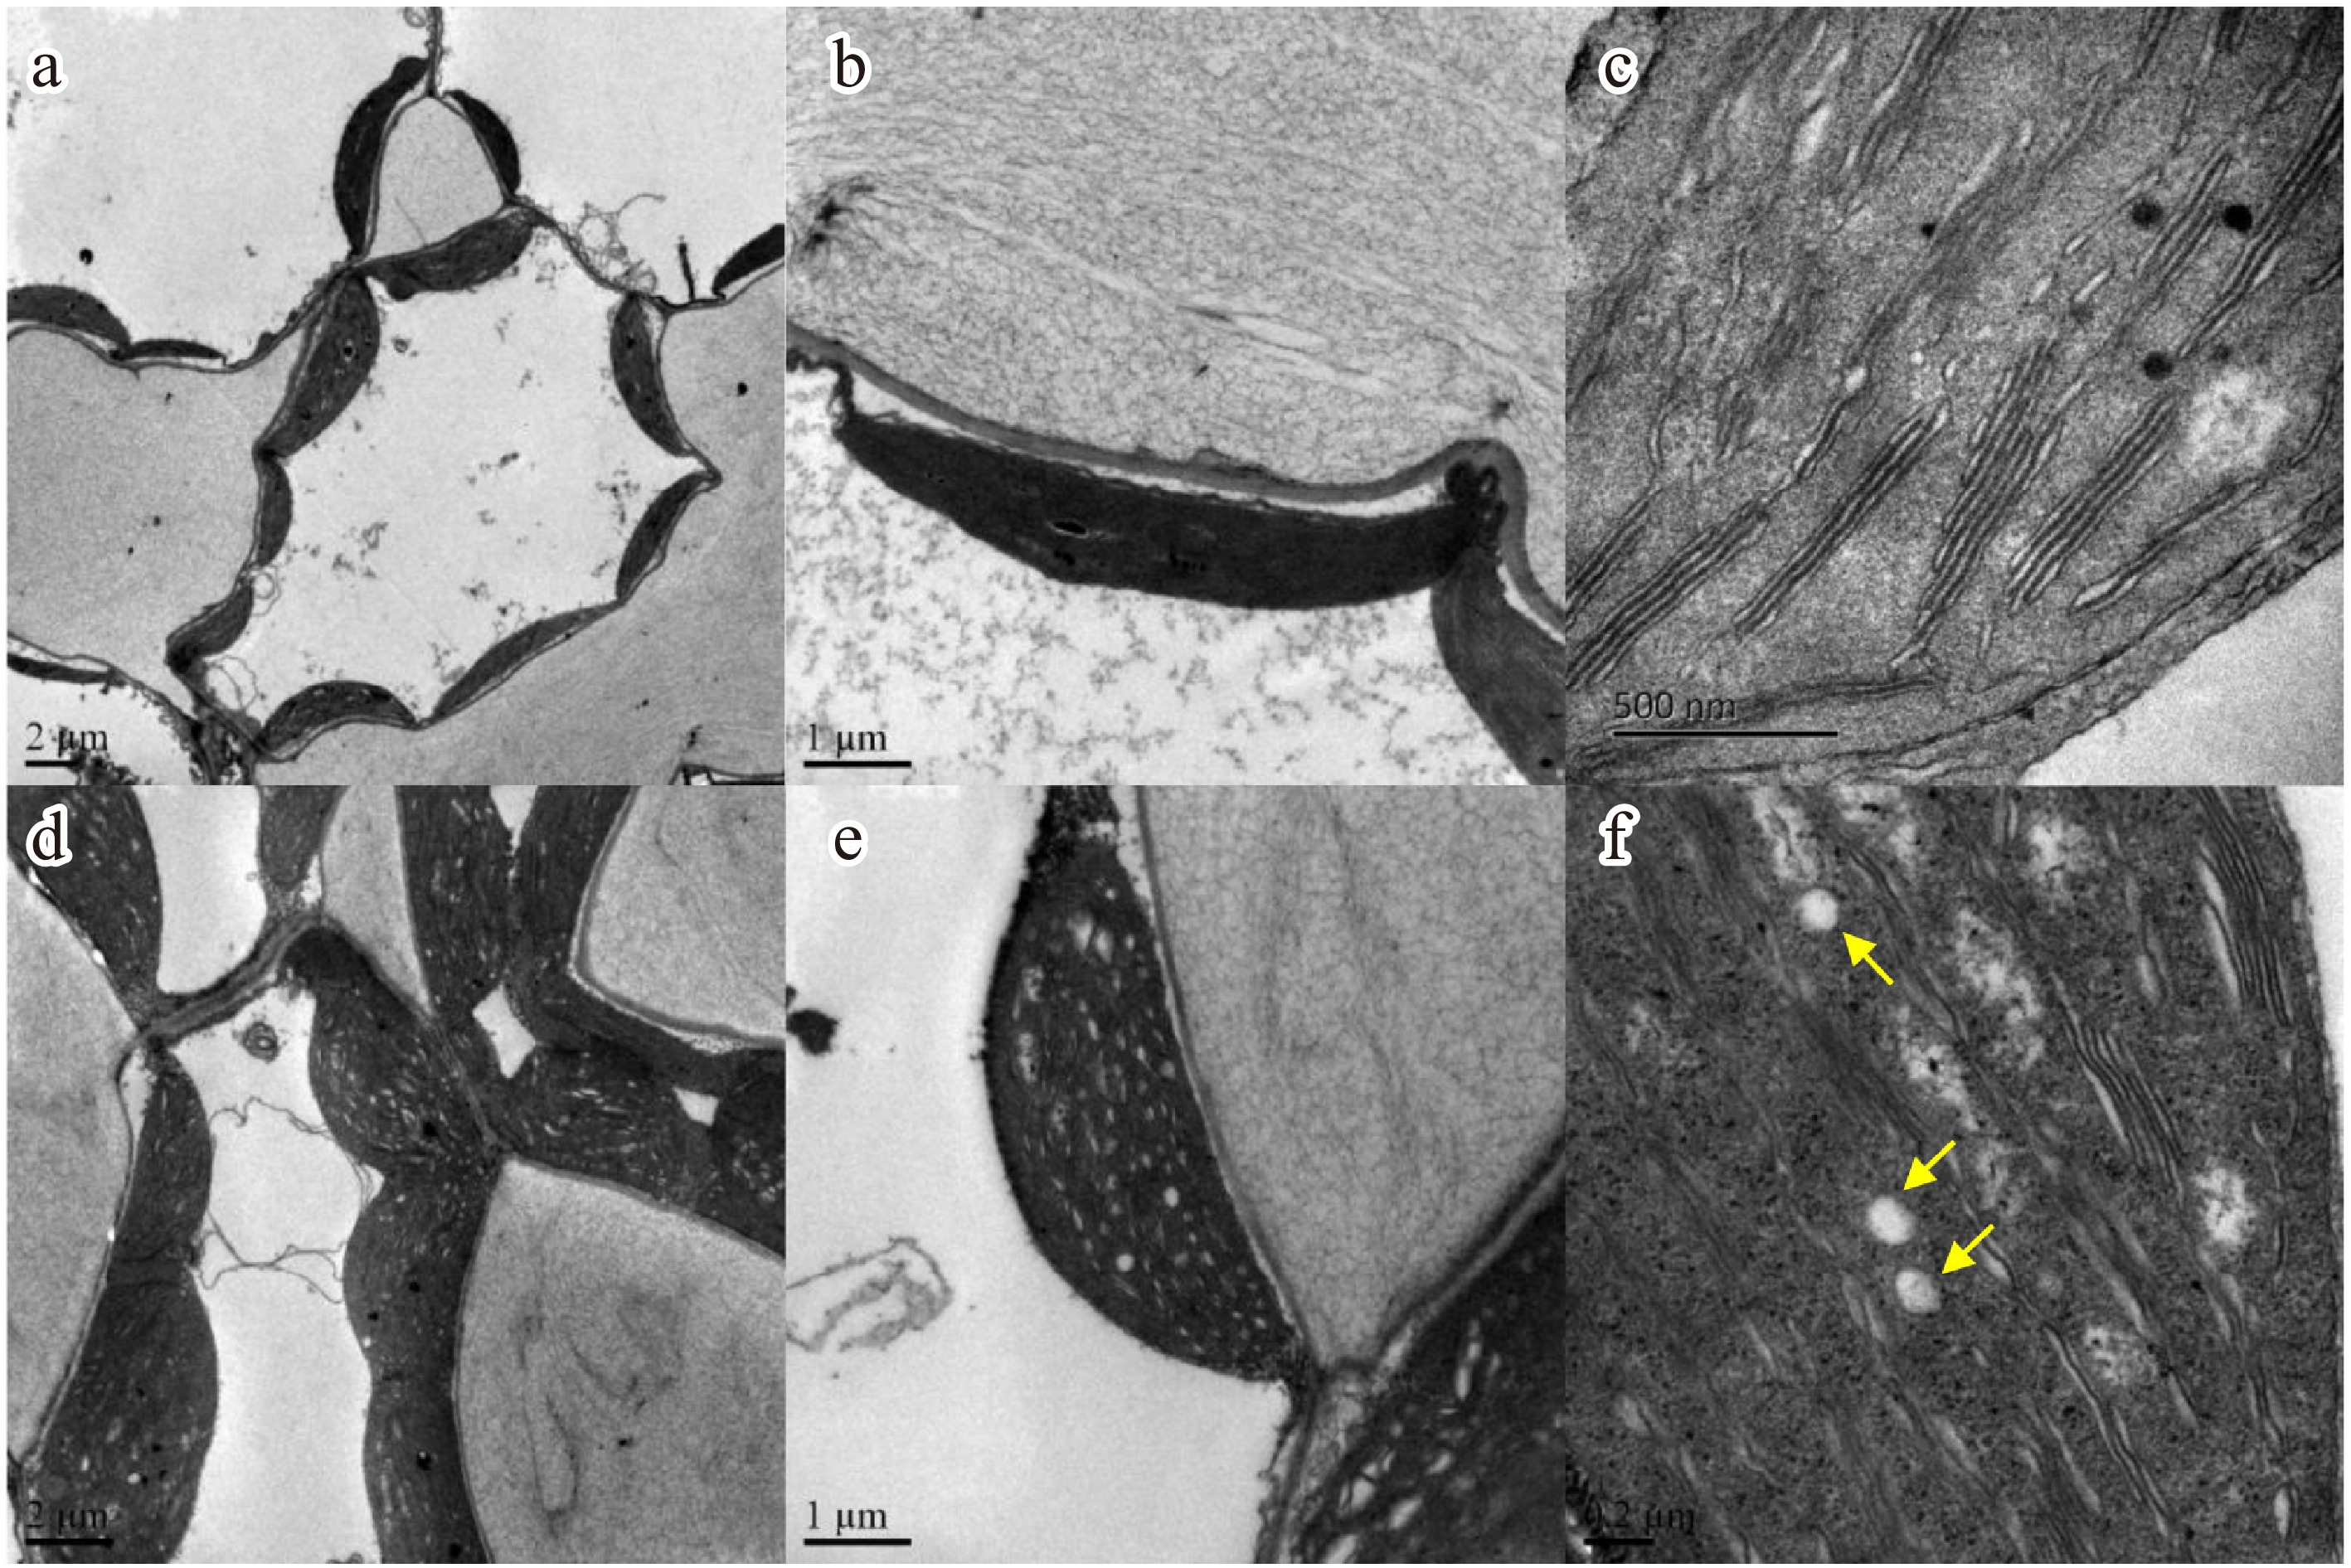
Figure 8.
N. sibirica photosynthesis and chloroplast structures under salt treatment. (a) Transmission electron micrographs of mesophyll cells with chloroplasts under control conditions, and (d) after treatment with 500 mM NaCl for 1 h. (b) Detailed chloroplast structure under normal conditions, and (e) following 500 mM NaCl treatment. (c) Starch granules, indicated by yellow arrows, in chloroplasts of control plants, and (f) salt-treated plants.
Figures
(8)
Tables
(0)