-
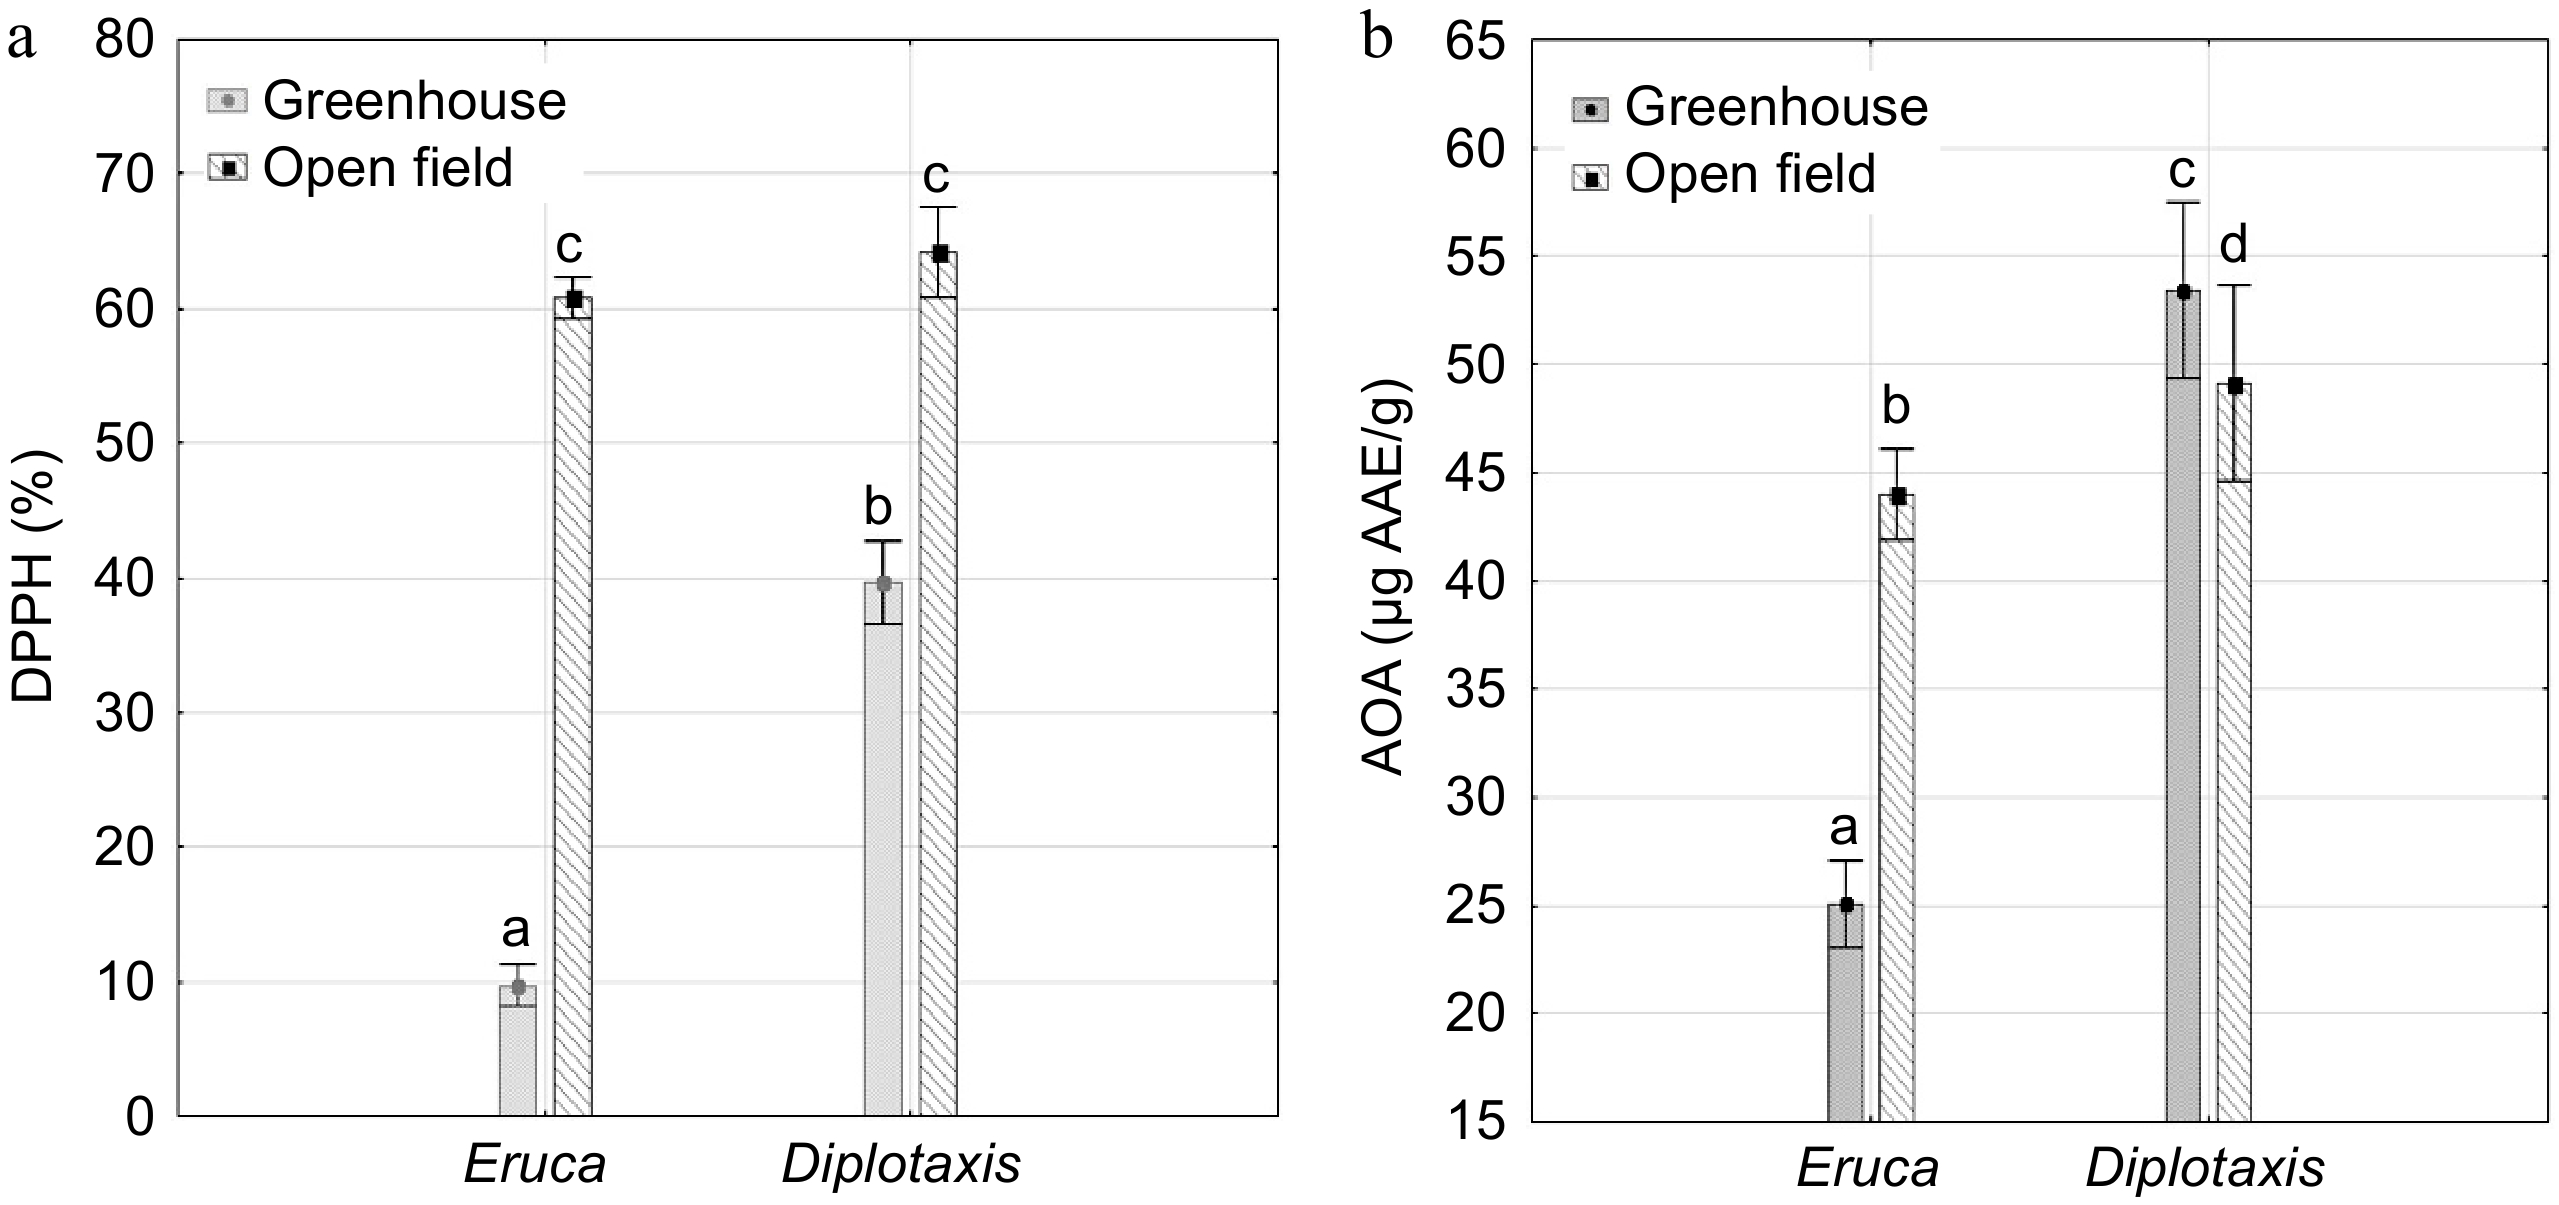
Figure 1.
Levels of antioxidant activity in Eruca and Diplotaxis accessions in the open field and the greenhouse. (a) Rate of oxidation of the DPPH radical (%), (b) level of antioxidant activity (μg AAE/g). Mean ± SE. a−d Values with different superscript letters were significantly different p < 0.05 (Tukey's HSD test).
-
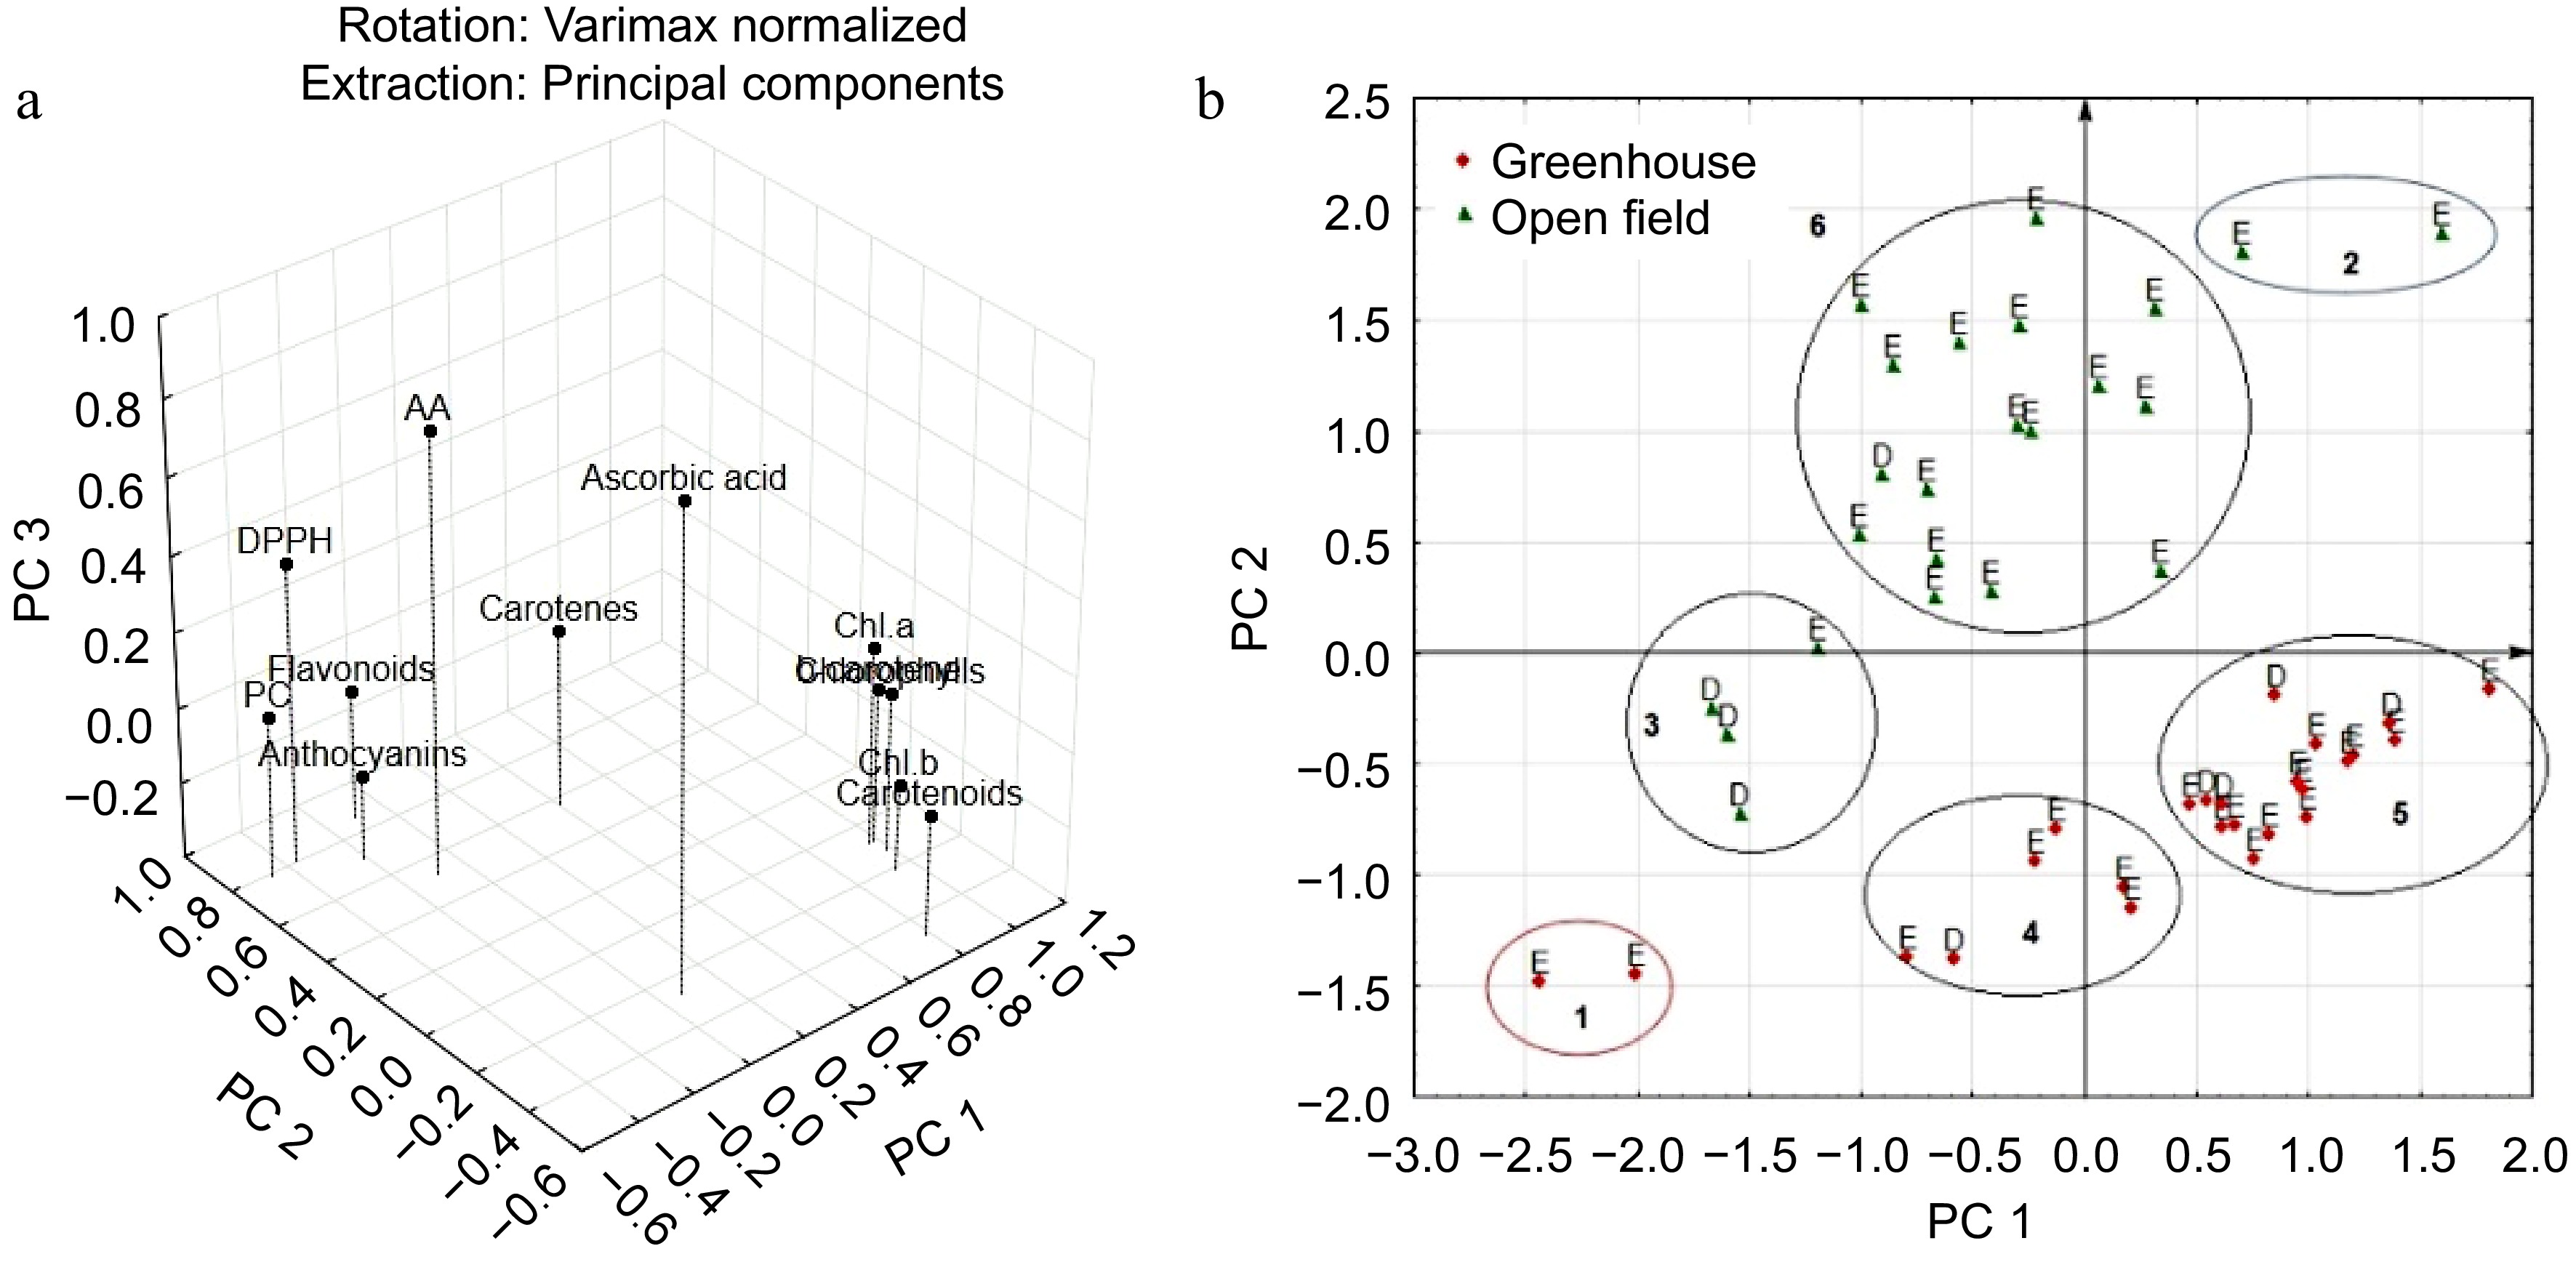
Figure 2.
Distribution of (a) features, and (b) accessions of Eruca (E) and Diplotaxis (D) in the space of the first two components. Places of cultivation are indicated by color.
-
Traits Place Eruca (20 acc.) Diplotaxis (5 acc.) Mean ± SD Range CV** (%) Mean ± SD Range CV (%) Ascorbic acid, mg/100 g Greenhouse 17.1 ± 6.8 4.2−35.2 39.9 37.0 ± 3.6 30.8−39.6 9.8 Open field 16.5 ± 3.1 10.3−22.7 18.9 18.3 ± 3.9 14.4−22.7 21.7 Total chl, mg/100 g Greenhouse 135.6 ± 37.6 34.0−179.9 27.7 137.8 ± 21.5 103.7−163.0 15.6 Open field 108.3 ± 24.5 71.8−165.6 22.6 73.8 ± 4.1 67.1−78.2 5.6 Chl.a, mg/100 g Greenhouse 98.8 ± 25.5 26.6−123.7 25.8 107.5 ± 16.4 81.5−126.4 15.3 Open field 84.9 ± 16.7 57.0−114.0 19.7 59.2 ± 3.0 54.7−63.1 5.1 Chl.b, mg/100 g Greenhouse 36.8 ± 12.6 7.4−56.2 34.3 30.4 ± 5.1 22.2−36.1 16.8 Open field 23.4 ± 8.6 14.8−51.6 37.0 14.6 ± 1.3 12.3−15.5 8.8 Carotenoids, mg/100 g Greenhouse 41.0 ± 17.3 7.0−61.3 42.2 46.0 ± 8.4 33.6−57.2 18.4 Open field 15.9 ± 4.7 9.4−29.1 29.6 10.9 ± 2.6 7.0−13.4 23.9 Carotenes, mg/100 g Greenhouse 6.8 ± 0.8 5.0−8.7 11.7 8.5 ± 1.6 6.2−10.5 18.8 Open field 8.1 ± 2.0 3.9−10.9 24.9 5.1 ± 2.4 3.4−9.4 47.5 β-carotene, mg/100 g Greenhouse 5.9 ± 1.7 1.4−7.8 28.0 6.0 ± 0.9 4.5−6.9 15.4 Open field 4.8 ± 0.9 3.4−7.2 19.9 3.3 ± 0.2 3.0−3.6 6.1 Anthocyanins, mg/100 g Greenhouse 2.4 ± 0.8 0.6−3.6 32.4 1.8 ± 0.3 1.6−2.3 14.8 Open field 8.3 ± 6.6 3.8−29.5 79.2 4.2 ± 1.9 2.8−7.5 45.3 Total phenolic compounds, mg GAE/100 g Greenhouse 58.7 ± 9.6 43.3−76.9 16.4 73.3 ± 10.0 63.2−88.4 13.7 Open field 274.9 ± 76.1 120.0−402.6 27.7 242.2 ± 37.1 200.0−287.0 15.3 Total flavonoids, mg/100 g Greenhouse 51.1 ± 33.5 5.9−120.9 65.6 20.5 ± 10.2 8.0−33.6 49.9 Open field 185.7 ± 48.3 103.9−308.8 26.0 71.1 ± 18.1 53.2−95.8 25.5 * N, replicates number; **CV, coefficient of variation. Table 1.
Biologically active substances Eruca and Diplotaxis in the open field and the greenhouse in North-West Russia (N* = 3).
-
Traits Place Eruca Diplotaxis AAE DPPH AAE DPPH Ascorbic acid Greenhouse 0.55* 0.60* −0.74* −0.65* open field −0.22 −0.17 −0.70 −0.77 Total chlorophylls Greenhouse 0.19 0.09 0.67 0.70 Open field 0.42 0.09 0.27 0.22 Chl.a Greenhouse 0.23 0.15 0.65 0.70 Open field 0.37 0.03 0.41 0.35 Chl.b Greenhouse 0.09 −0.05 0.50 0.46 Open field 0.49* 0.20 −0.02 −0.09 Carotenoids Greenhouse −0.14 −0.43 0.62 0.67 Open field −0.21 −0.47* −0.08 −0.03 Carotenes Greenhouse 0.10 0.09 0.18 0.20 Open field −0.13 0.17 0.60 0.59 β-carotene Greenhouse 0.15 0.05 0.50 0.47 Open field 0.42 0.11 0.44 0.42 Anthocyanins Greenhouse −0.35 −0.46* 0.56 0.60 Open field 0.01 0.21 0.60 0.51 Total polyphenolic compounds Greenhouse 0,02 0.23 0.88* 0.90* Open field −0,53* −0.13 0.80 0.83 Total flavonoids Greenhouse 0.13 −0.07 0.90* 0.85* Open field 0.70* 0.57* 0.53 0.58 * significant at p ≤ 0.05 (Pearson's correlation coefficient). Table 2.
Correlation analysis of pigments and phenolic compounds with antioxidant activity of Eruca and Diplotaxis in the open field and the greenhouse.
-
Component Eigenvalue Total (%) Cumulative Cumulative (%) 1 6.00 49.97 6.00 49.97 2 2.54 21.16 8.54 71.13 3 1.46 12.19 10.00 83.32 Table 3.
Dispersion of the principal components of the biochemical characteristics of Eruca and Diplotaxis.
-
Traits Group 1 Group 2 Group 3 Group 4 Group 5 Group 6 Ascorbic acid* 13.8 ± 0.8a 12.9 ± 3.6a 17.8 ± 3.7b 25.7 ± 11.0c 20.6 ± 10.3c 17.0 ± 2.8b 13.3−14.3 10.3−15.5 14.4−22.7 15.4−39.6 4.2−39.6 12.4−22.7 Total chl* 39.1 ± 7.3a 154.9 ± 15.2d 76.0 ± 8.3b 116.8 ± 15.1c 152.2 ± 12.1d 100.4 ± 18.1c 34.0−44.3 144.1−165.6 67.1−87.1 97.6−131.4 131.8−179.9 71.8−135.2 Chl.a* 30.5 ± 5.5a 113.0 ± 1.4c 61.0 ± 6.2b 90.0 ± 11.0b 111.3 ± 7.0c 80.1 ± 14.0b 26.6−34.4 112.0−114.0 54.7−69.6 75.1−98.5 97.4−126.9 57.0−106.7 Chl.b* 8.6 ± 1.8a 41.8 ± 13.8c 15.0 ± 2.2a 26.8 ± 4.5b 40.9 ± 7.2c 20.4 ± 4.3b 7.4−9.9 32.0−51.6 12.3−17.5 22.2−32.9 30.1−56.2 14.8−29.3 Carotenoids* 12.5 ± 3.1a 17.4 ± 5.4b 9.5 ± 2.0a 23.9 ± 16.0b 50.4 ± 4.8c 15.7 ± 4.5b 10.3−14.7 13.6−21.1 7.0−11.8 7.0−41.9 42.7−61.3 11.2−29.1 Carotenes* 6.2 ± 1.8a 9.1 ± 2.5c 4.0 ± 0.4a 6.3 ± 0.7a 7.5 ± 1.1b 8.4 ± 1.7b 5.0−7.5 7.4−10.9 3.4−4.5 5.3−7.0 6.3−10.5 5.2−10.2 β-carotene* 1.6 ± 0.3a 6.7 ± 0.6c 3.4 ± 0.3b 5.0 ± 0.7c 6.7 ± 0.5c 4.6 ± 0.8b 1.4−1.9 6.3−7.2 3.0−3.9 4.2−5.8 5.9−7.8 3.4−5.9 Anthocyanins* 2.6 ± 1.4a 6.4 ± 1.1b 3.8 ± 0.8a 1.8 ± 1.1a 2.3 ± 0.5a 9.0 ± 7.0c 1.6−3.6 5.6−7.1 2.8−4.8 0.6−3.6 1.6−3.2 3.8−29.5 Total PC, mg GAE/100 g 50.0 ± 6.9a 177.2 ± 51.9b 250.6 ± 30.3c 62.6 ± 7.9a 62.6 ± 11.9a 296.1 ± 59.6c 45.1−54.9 140.5−214.0 210.6−278.6 48.8−68.6 43.3−88.4 142.8−402.6 Total flavonoids* 50.5 ± 39.4b 273.4 ± 50.0d 88.7 ± 41.3b 24.4 ± 14.6a 50.1 ± 33.9b 171.7 ± 43.1c 15.6−85.4 238.0−308.8 60.9−148.3 5.9−38.7 8.0−120.9 95.8−251.4 DPPH, % 6.5 ± 0.9a 73.6 ± 6.2c 61.3 ± 5.9c 18.2 ± 11.2b 16.0 ± 14.4b 60.0 ± 7.9c 5.9−7.2 69.2−78.0 54.3−68.1 7.2−33.0 5.0−46.5 43.0−71.3 AOA, μg AAE/g 18.6 ± 2.1a 61.8 ± 5.3c 46.8 ± 4.5c 32.3 ± 11.8b 31.7 ± 16.1b 42.4 ± 7.2c 17.1−20.1 58.0−65.5 41.4−52.1 17.1−44.4 10.9−62.6 30.3−55.5 * mg/100 g. All data are presented as Mean ± SD, Xmin−Xmax. a−d Values with different superscript letters were significantly different p < 0.05 (Tukey's HSD test). Table 4.
Characteristics of principal component groups of Eruca and Diplotaxis.
Figures
(2)
Tables
(4)