-
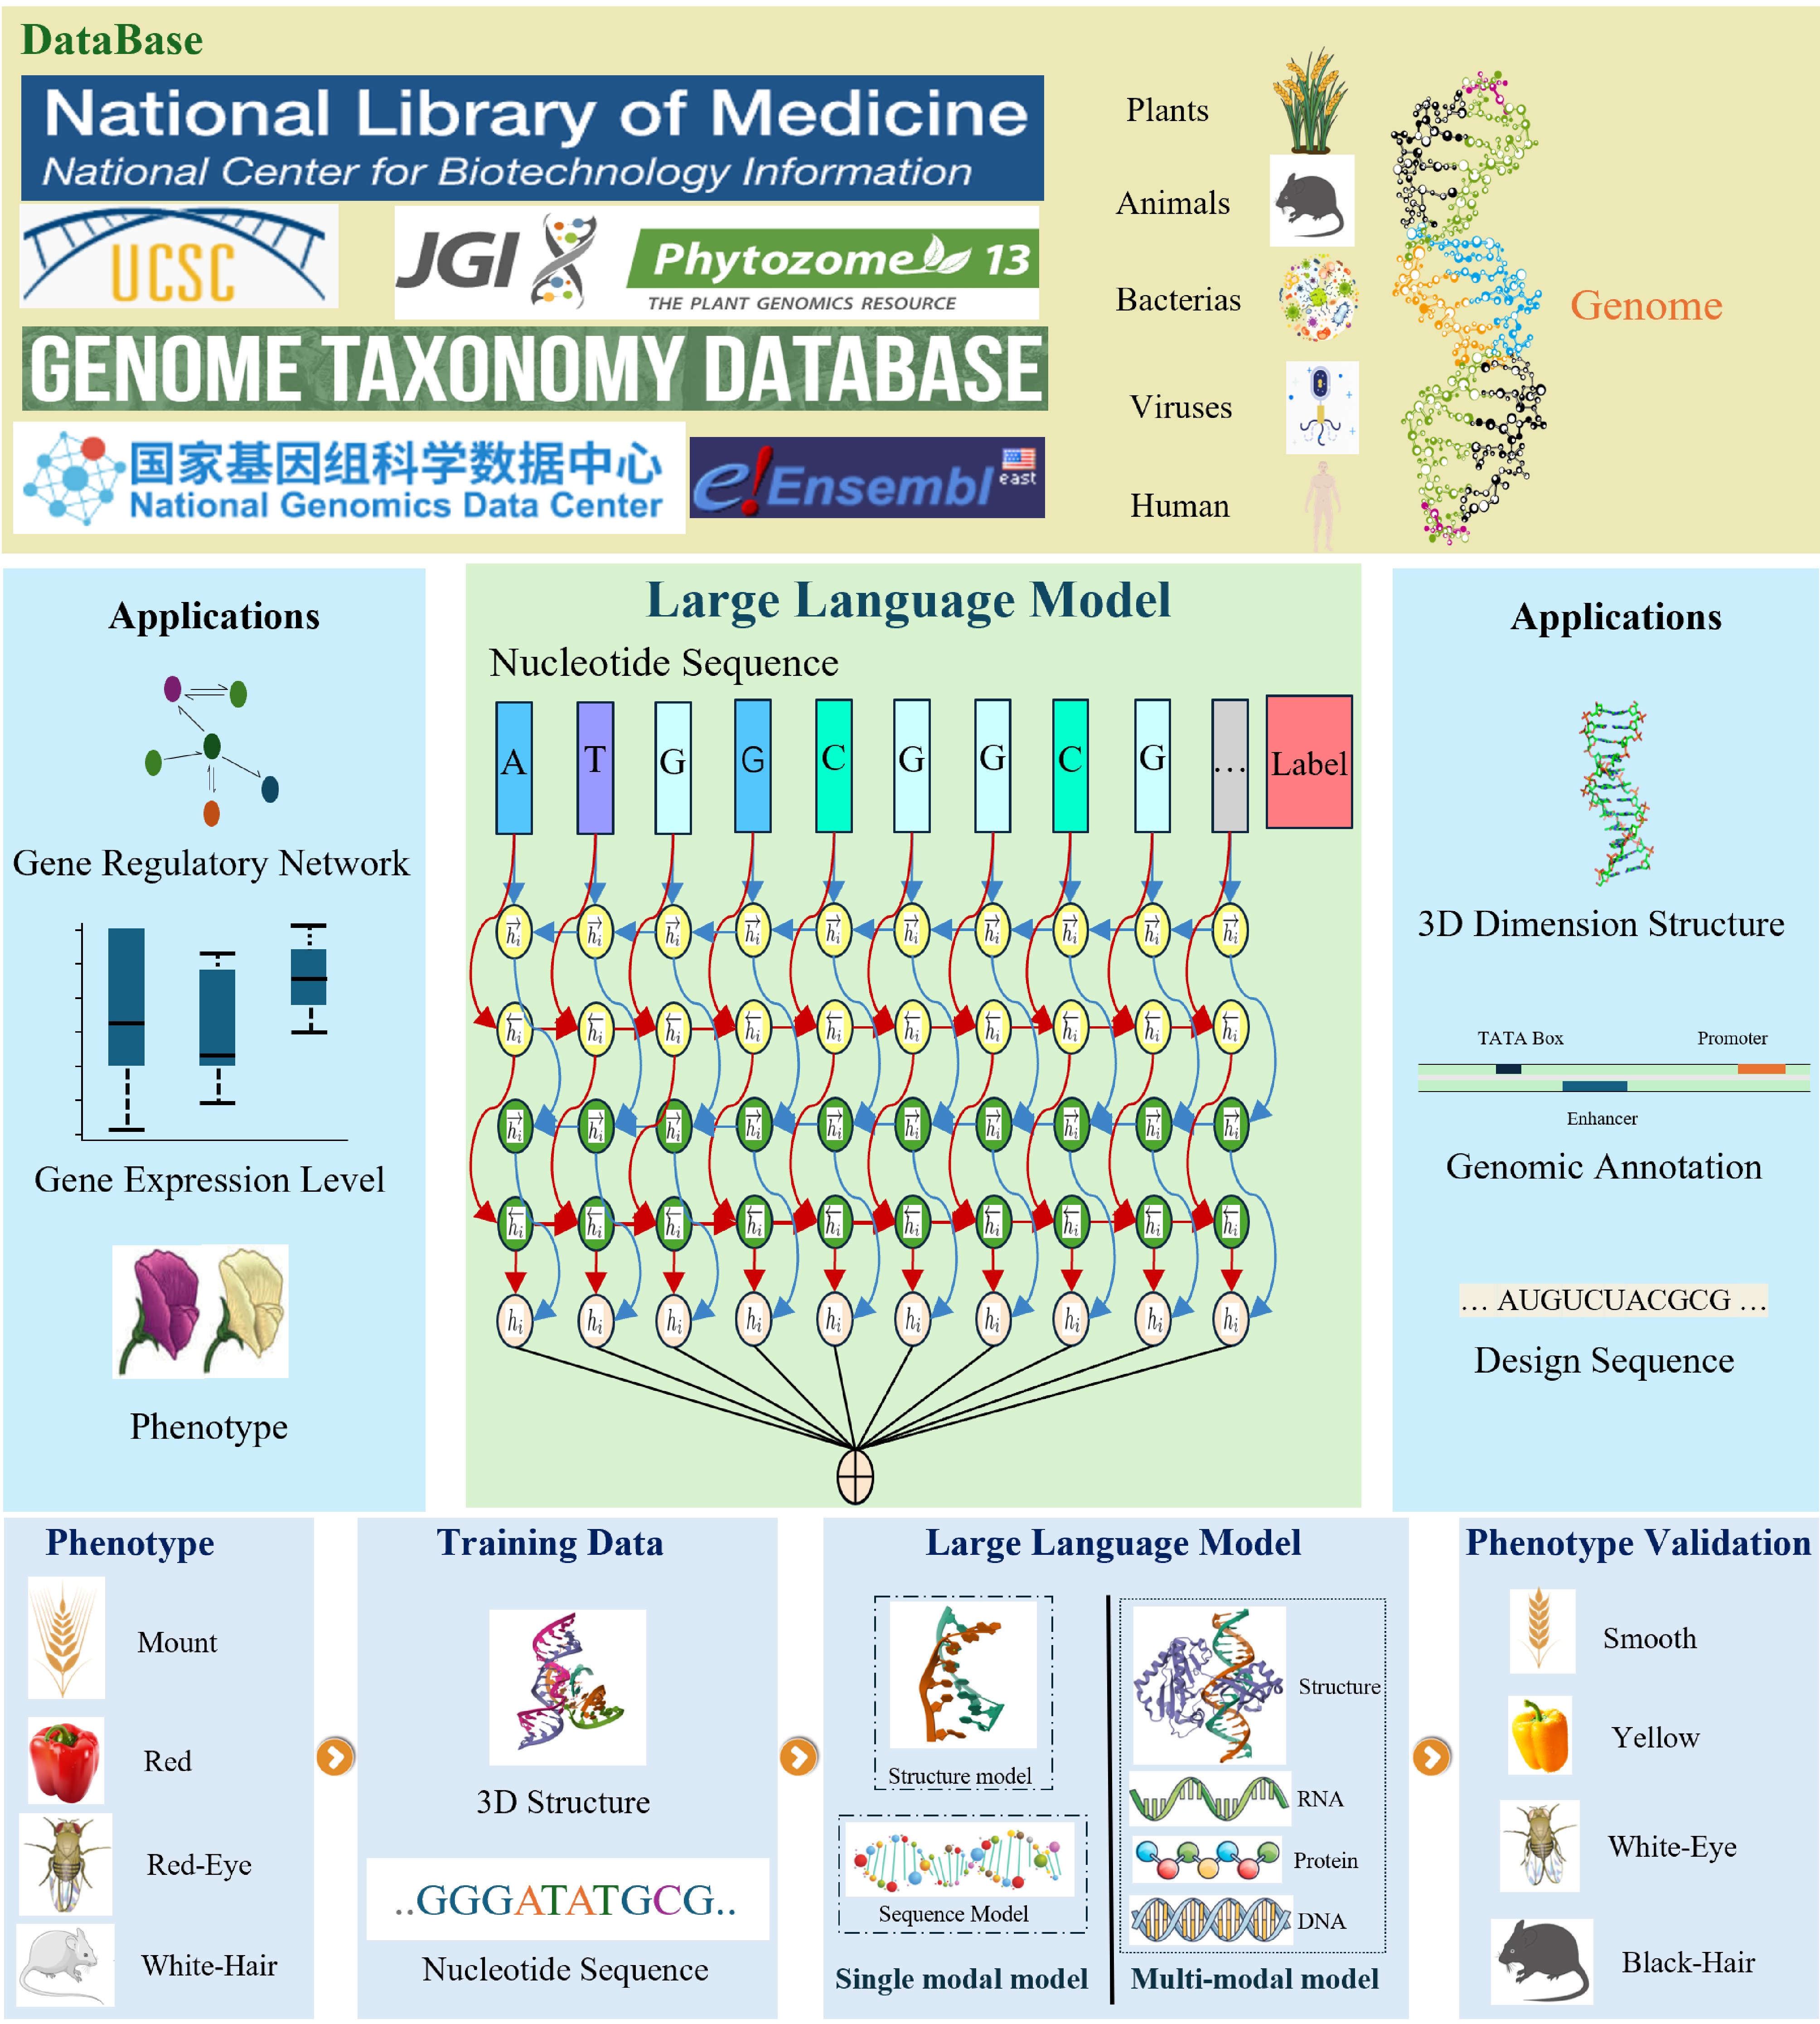
Figure 1.
The workflow of building genomic large language models.
-
Model Model Tokenization Pretraining genome Max model size (million) Open source Task list DNABERT[16] Bert K-mer Homo sapiens 89 Yes ITFBS, SSD , IFV DNABERT-2[17] Bert BPE Homo sapiens and the multispecies genome 117 Yes CPD, TFP, PD, SSD, EMP, CVC, IEPI Nucleotide transformer[18] Bert K-mer 850 Animal genome 2,500 Yes EMP, PD, ED, SSD , CPP, SAB, EAP AgroNT[19] Bert K-mer 48 Plant genome 1000 Yes PASP, SSD, LNRP, PTAP, CAP, IFV, ED, PGEL GenSLM[20] Bert Codon Sars-Cov-2, Prokaryotic gene sequences 25,000 Yes PA ProkBERT[21] Bert Local Context-aware tokenization 976,878 Unique Contigs 266 Yes PD, PI GROVER[22] Bert Sennrich et al. Homo sapiens 86 Yes PD, ITFBS, SSD, IPDB DNAGPT[23] GPT K-mer Arabidopsis thaliana, Caenorhabditis elegans, Bos taurus, Danio rerio, Drosophila melanogaster, Escherichia_Coli_Gca 001721525, Homo sapiens, Mus musculus, Saccharomyces cerevisiae and all mammals 3,000 Yes PASP, RTIS, mRNA-ELP, AHGG HyenaDNA[24] GPT Single-nucleotide Homo sapiens 6.6 Yes PD, ED, IOCR, EMP, SSD , CPP, SAB, EAP, SC PlantCaduceus[25] GPT K-mer 16 Angiosperm genomes 225 Yes ITFBS, RTTS, SDSD, SASD, ECE, IDM PDLLMs[26] BERT, GPT Single-Nucleotide,
BPE, k-mer14 plant Genomes 100 Yes LNRP, PCP, CAP, HMP, CPD, ECE Evo[27] GPT Single-Nucleotide Bacterial and Archaeal, Prokaryotic viruses, Plasmid 7,000 Yes PME, PARD, GDCMC, GDTS, GDS FloraBERT[28] BERT BPE Plant promoter × Yes PD, SC megaDNA[29] GPT Single-Nucleotide Bacteriophage Genomes 145 Yes PGE, PME, PTE, CTUS, GDS All models can be categorized into two main types: BERT-inspired and GPT-inspired. These models have been modified and improved based on the original BERT and GPT designs. For Task List: ITFBS (Identifies Transcription Factor Binding Site), IFV (Identify Functional Variant), CPD (Core Promoter Detection), TFP (Transcription Factor Prediction), PD (Promoter Detection), SSD (Splice Site Detection), EMP (Epigenetic Mark Prediction), CVC (Covid Variant Classification), IEPI (Identify Enhancer Promoter Interaction), SC (Species Classification), PA (Phylogenetic Analyses), PI (Phage Identification), PASP (Polyadenylation Signal Prediction), LNRP (Long Non-Coding RNA Prediction), PTAP (Promoter And Terminator Activity Prediction), CAP (Chromatin Accessibility Prediction), TSGEP (Tissue-Specific Gene Expression Prediction), ED (Enhancer Detection), PGEL (Predict Gene Expression Level), RTIS (Recognition Of Translation Initiation Site), mRNA-ELP (mRNA Expression Level Prediction), AHGG (Artificial Human Genomes Generation), IPDB (Identify Protein-DNA Binding), RTTS (Recognition Of Translation Termination Site), SDSD (Splice Donor Site Detection), SASD (Splice Acceptor Site Detection), ECE (Evolutionary Constraint Estimation), IDM (Identify Deleterious Mutation), IOCR (Identify Open Chromatin Region), CPP (Chromatin Profiles Prediction), EAP (Enhancer Activity Prediction), SAB (SpliceAI Benchmark), PME (Predicting Mutational Effects), PARD (Predicting Activity Of Regulatory DNA), GDCMC (Generative Design Of CRISPR-Cas Molecular Complexes), GDTS (Generative Design Of Transposon Systems), GDS (Generating DNA Sequences), PGE (Prediction Of Gene Essentiality), PTE (Prediction Of Translation Efficiency), CTUS (Classification Taxonomy Of Unannotated Sequences), PCP (Promoter Length Prediction), HMP (Histone Modification Prediction). × indicates that the model did not display statistical results for this metric. Table 1.
Statistical properties of LLMs in genome analysis.
-
Model Object Task Spearman R Pearson R Enformer[30] Genes Regression 0.849 × Borzoi[31] Genes Regression × 0.77 Proformer[33] Promoter Regression × 0.991 CRMnet[34] Promoter Regression × 0.971 The performance of each model is determined by the optimal results achieved on the test set. × indicates cases where the model did not display statistical results for this metric. Table 2.
Applications of LLMs in coding regions of nucleic acid sequences.
-
Model Object Task Accuracy Sensitive Specific MCC AUC AUCPR BERT-2D[35] Enhancer Classification 0.756 0.8 0.712 0.514 × × iEnhancer-BERT[36] Enhancer Classification 0.793 × × 0.585 × 0.844 iEnhancer-ELM[37] Enhancer Classification 0.83 0.8 0.86 0.661 0.856 × Enhancer-LSTMAtt[38] Enhancer Classification 0.805 0.795 0.815 0.61 0.859 × enhanceBD[39] Enhancer Classification 1 1 1 1 1 × iEnhancer-DCSV[40] Enhancer Classification 0.807 0.991 0.623 0.661 0.869 × ADH-Enhancer[41] Enhancer Classification 0.946 0.946 0.949 0.892 × × The performance of each model is determined by the optimal results achieved on the test set. × indicates cases where the model did not display statistical results for this metric. Table 3.
Applications of LLMs in the identification of enhancers.
-
Model Object Task Accuracy Precision Recall Specific F1 MCC AUC TEclass2[42] Transposon Classification × 0.86 0.91 × 0.88 × × CREATE[44] Transposon Classification × × × × × × 0.987 AMter[45] Terminator Classification 1 × 1 1 × 1 × The performance of each model is determined by the optimal results achieved on the test set. × indicates cases where the model did not display statistical results for this metric. Table 4.
Application of LLMs in terminator and transposon identification.
-
Model Year RMSD TM-score lDDT E2Efold-3D[46] 2022 3.486 0.518 0.739 DeepFoldRNA[47] 2022 2.72 0.654 × RoseTTAFoldNA[48] 2023 × × 0.73 trRosettaRNA[49] 2023 10.0 × × NuFold[50] 2023 7.66 × × DRfold[51] 2023 14.45 0.435 × RhoFold+[52] 2024 4.02 0.57 × × indicates that the model did not display statistical results for this metric. The performance of E2Efold-3D, DeepFoldRNA, trRosettaRNA, and RhoFold+ is evaluated using the RNA-Puzzles dataset as a benchmark, according to the original papers. Due to the lack of direct evaluation on RNA-Puzzles, the performance of RoseTTAFoldNA and DRfold is reported based on PDB structures, as presented in their respective papers. NuFold's performance is a combination of results from both PDB and RNA-Puzzles. Table 5.
LLMs for 3D nucleic acid structure annotation.
Figures
(1)
Tables
(5)