-
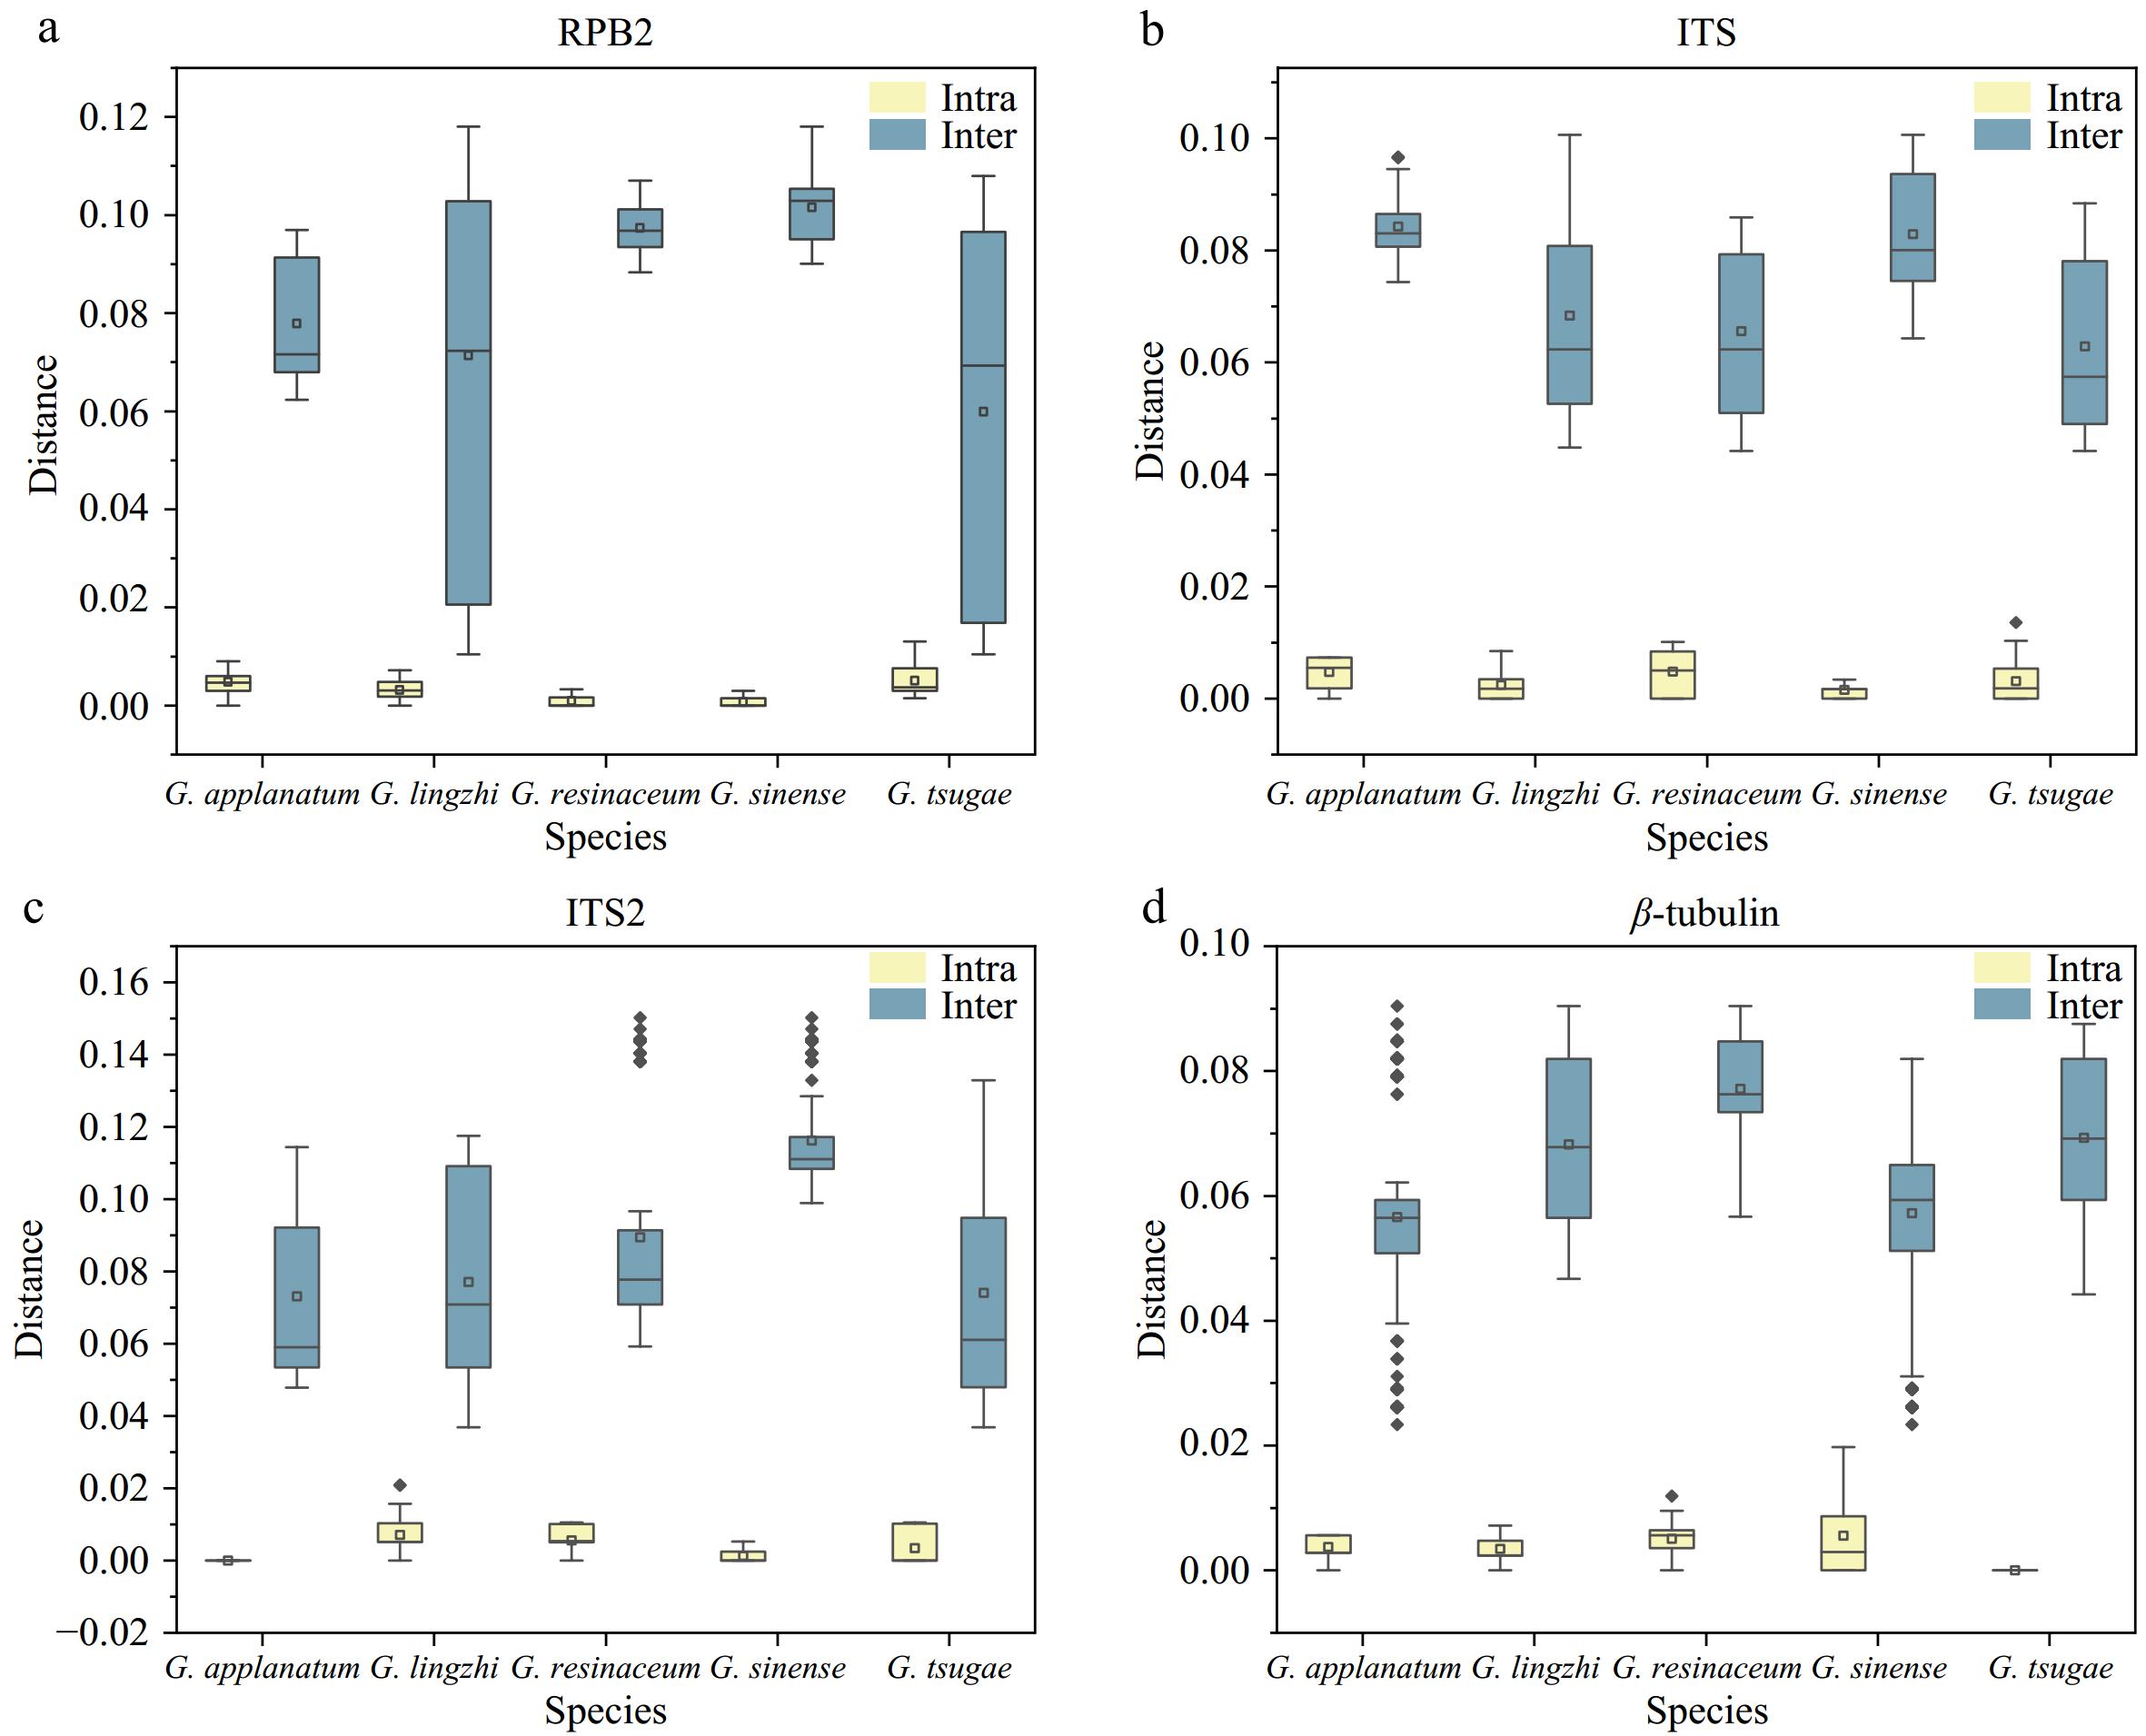
Figure 1.
The intra-GD and inter-GD of the (a) RPB2, (b) ITS, (c) ITS2, and (d) β-tubulin sequences of the Ganoderma species based on the K2P model.
-
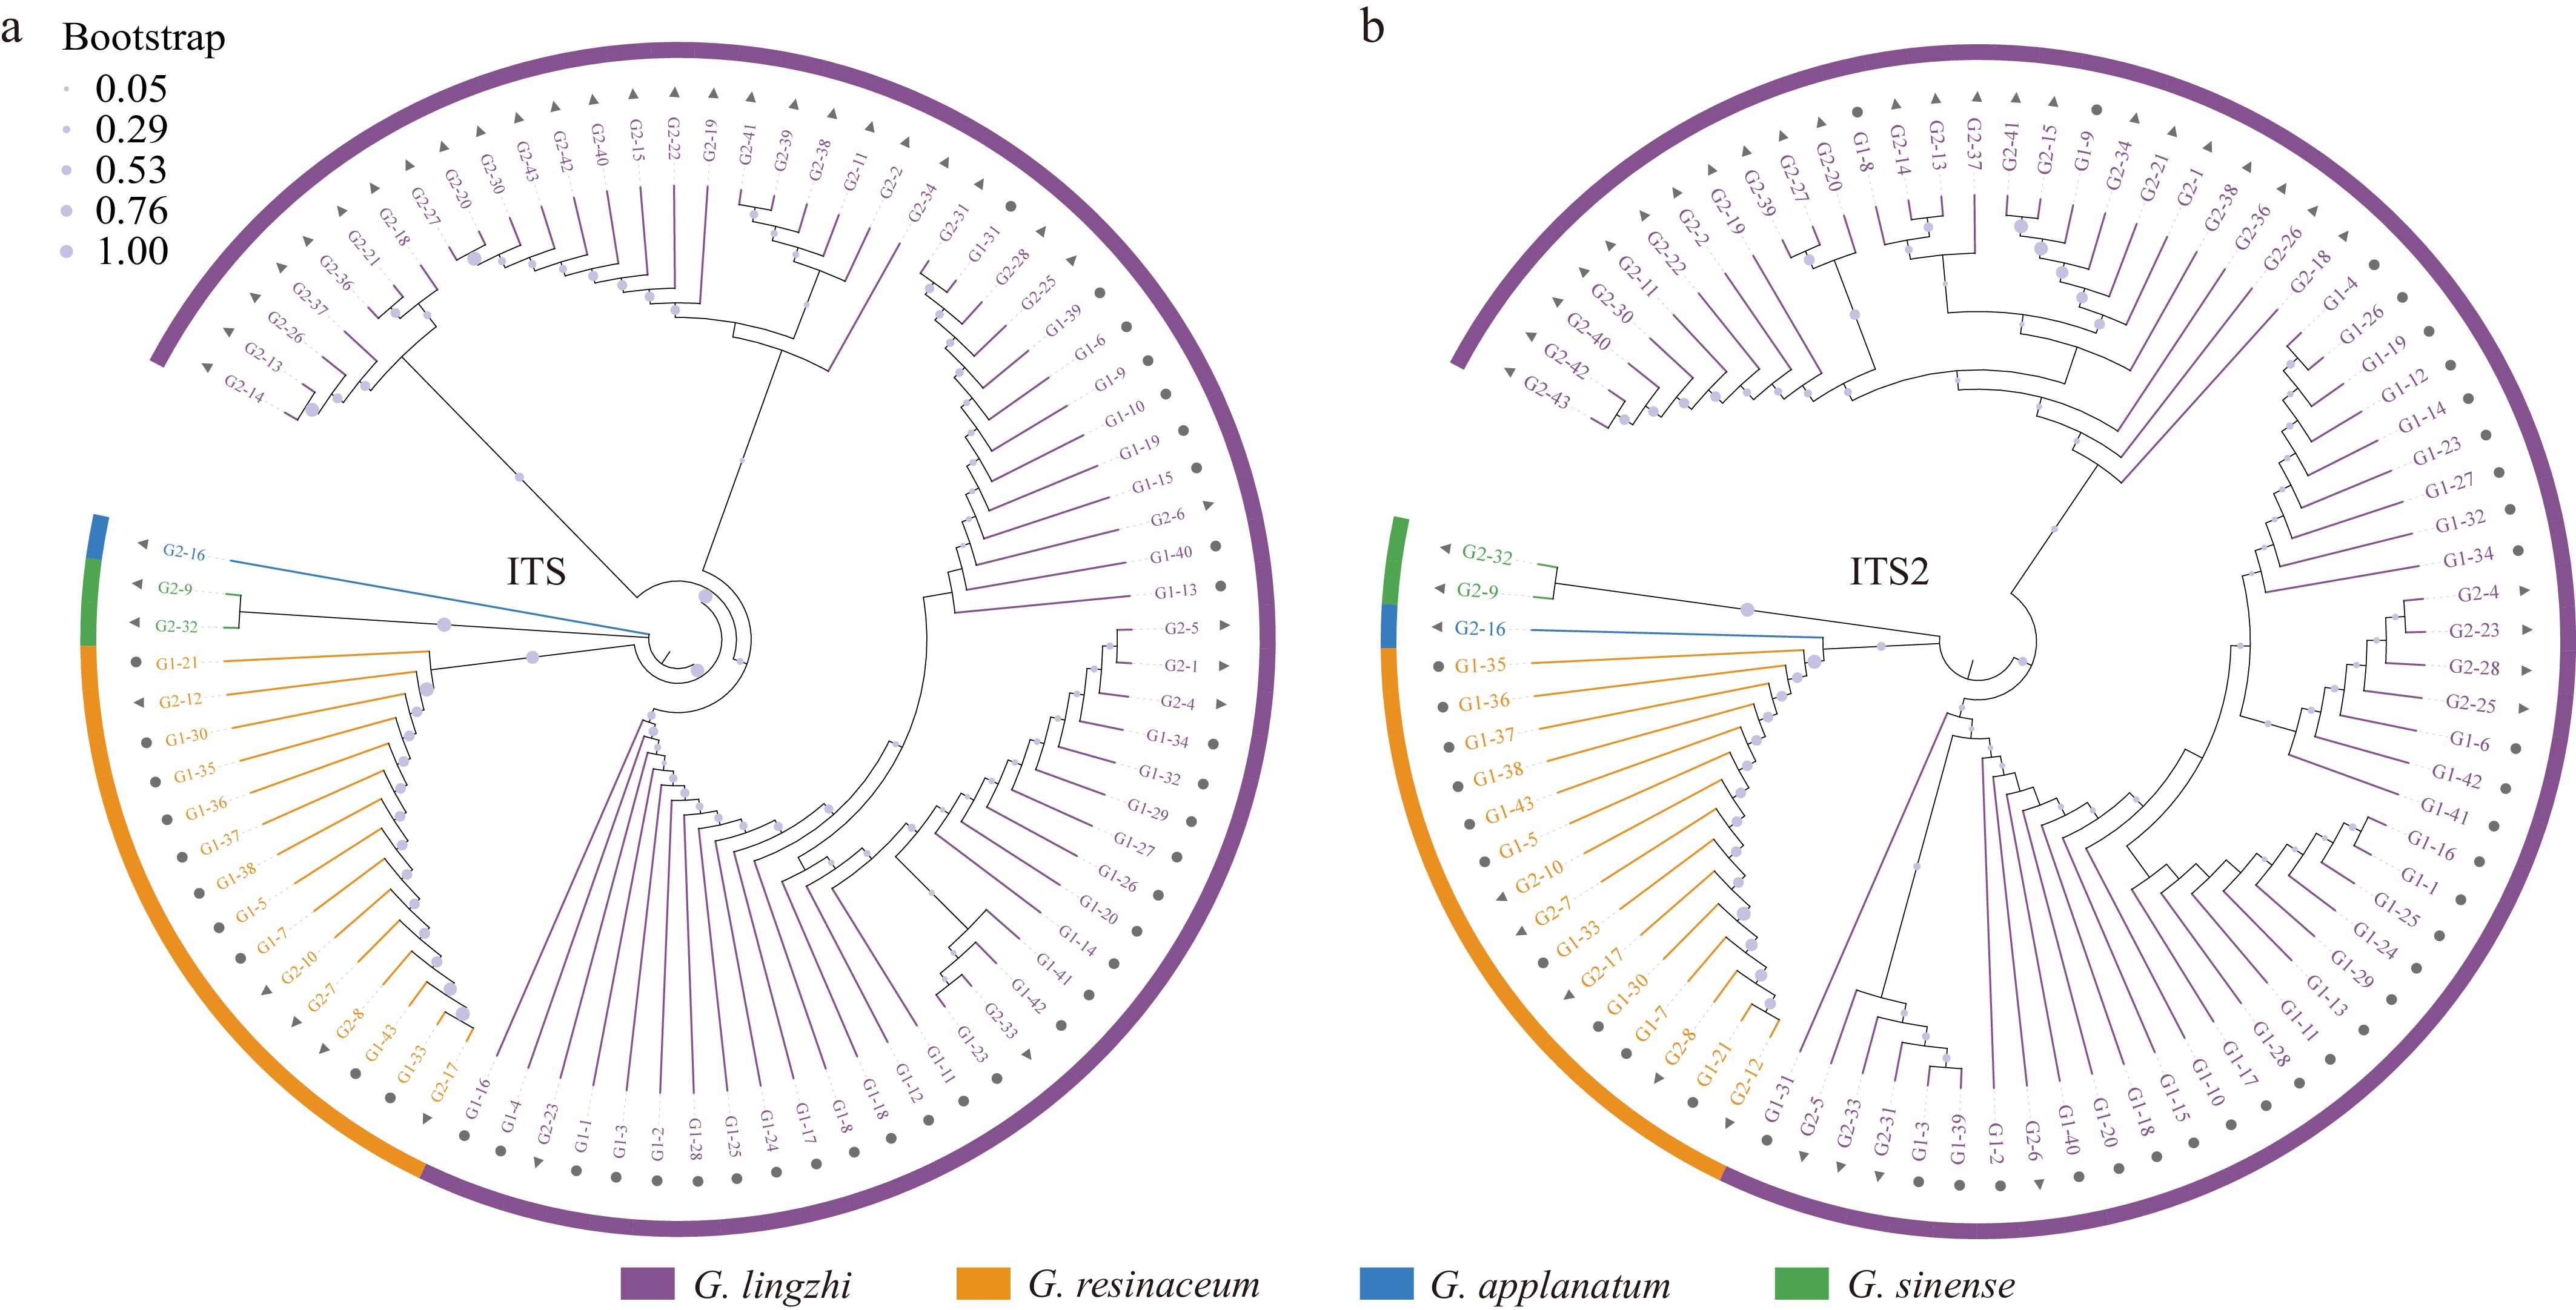
Figure 2.
Molecular identification of commercial Ganoderma based on DNA barcoding. The neighbor-joining tree is based on (a) ITS, and (b) ITS2 sequences of the commercial Ganoderma.
-
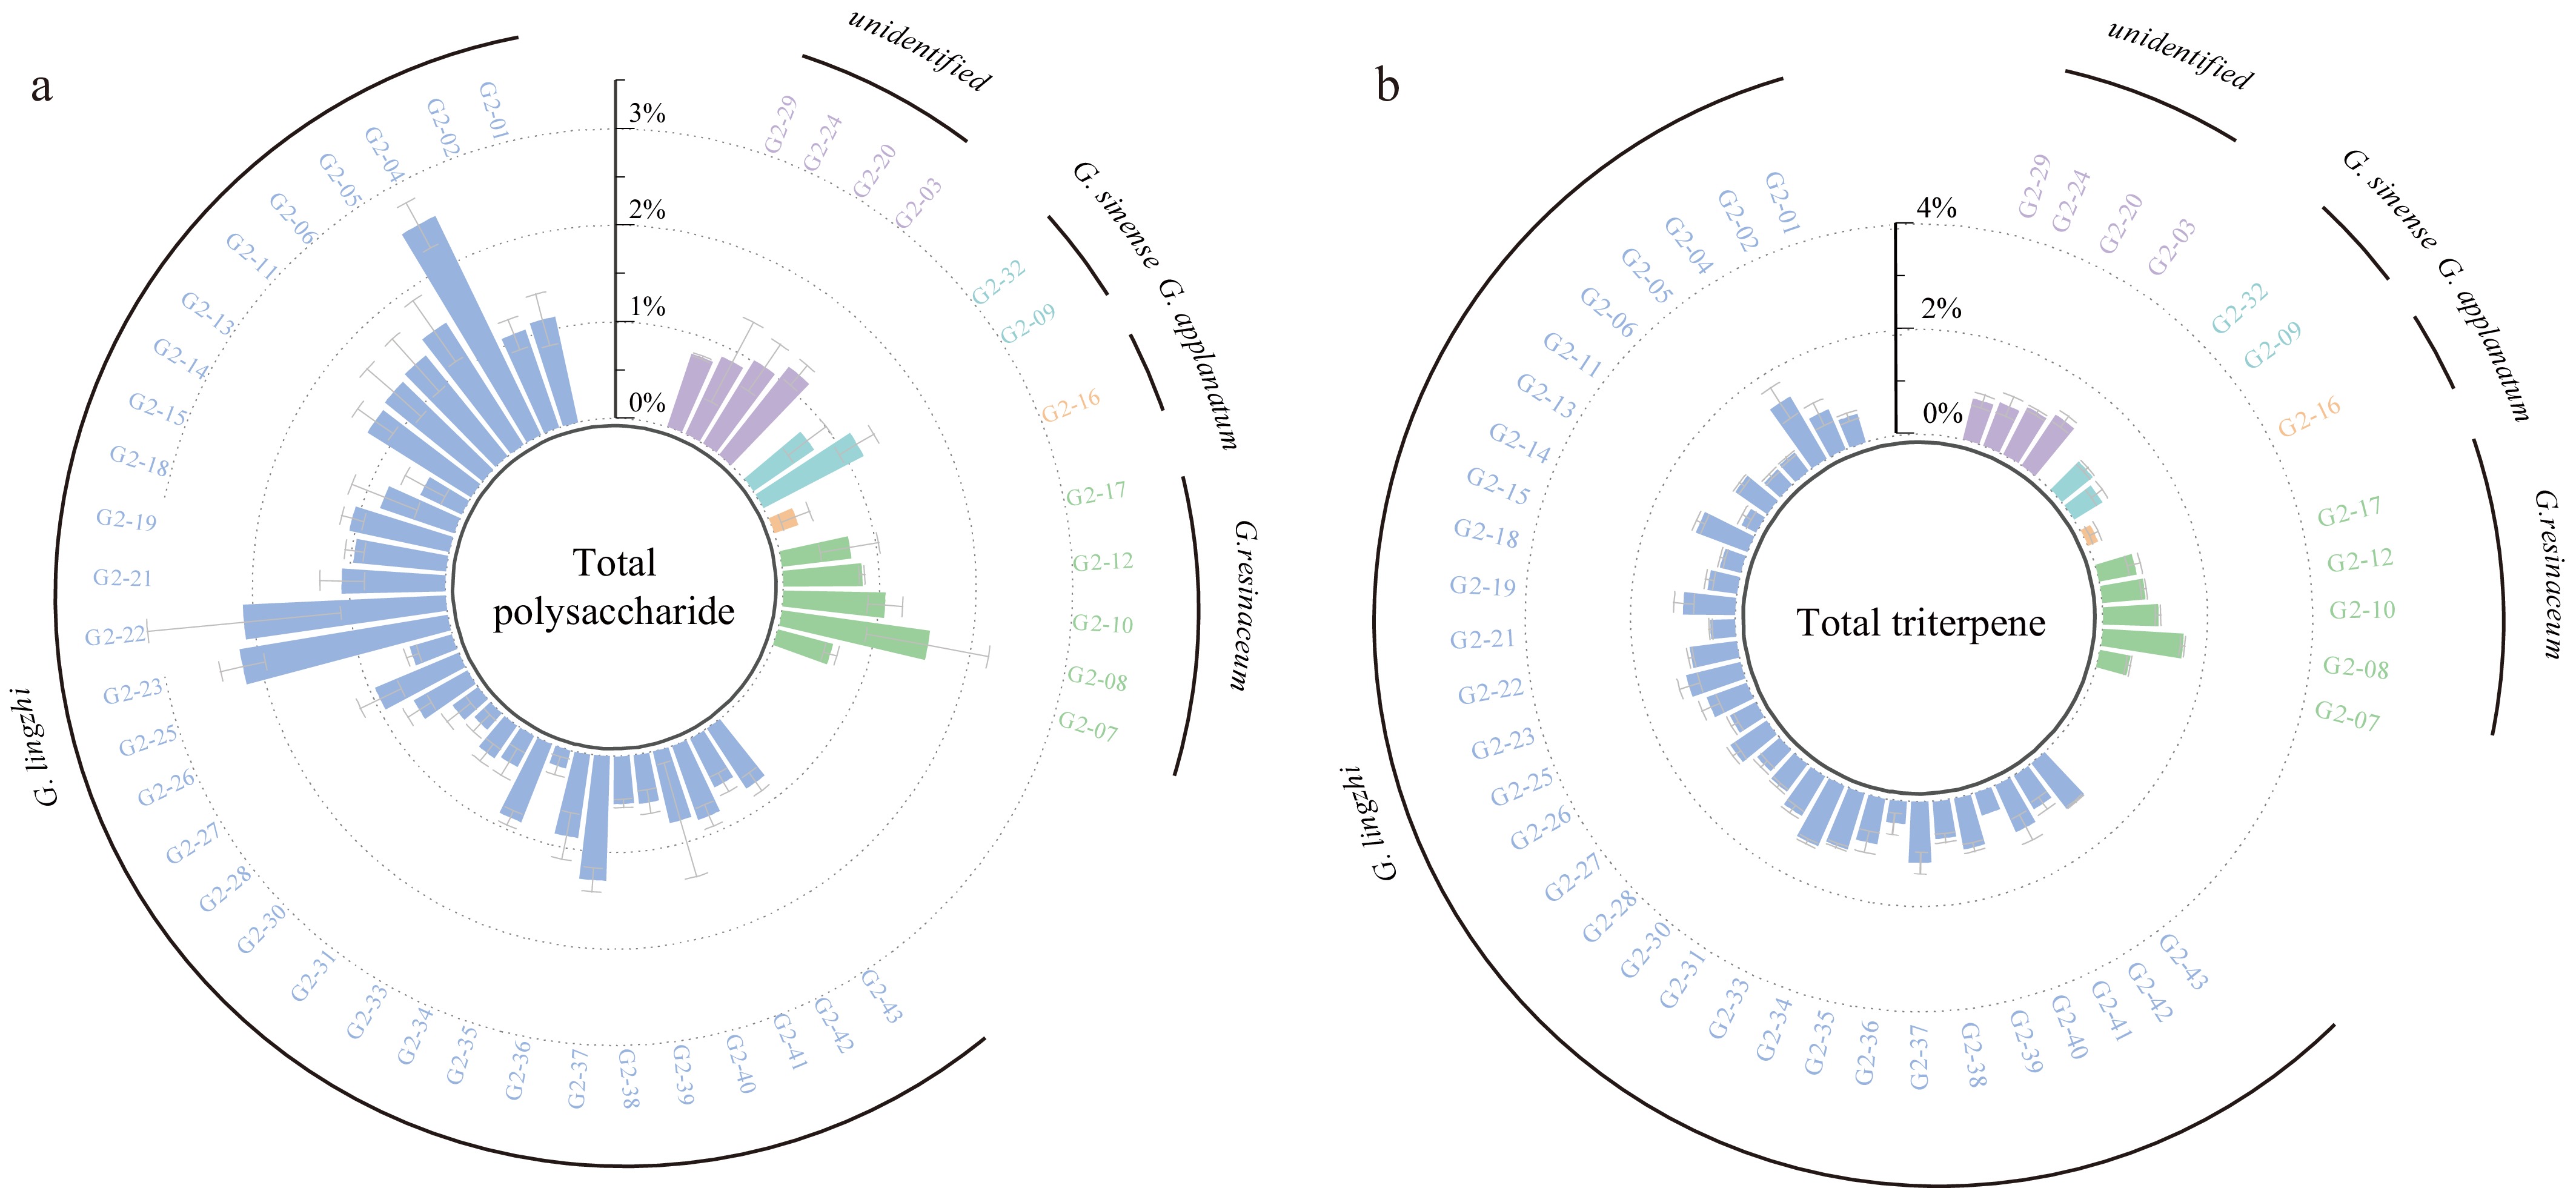
Figure 3.
Histogram of (a) total polysaccharide and, (b) total triterpene content of Ganoderma fruiting bodies.
-
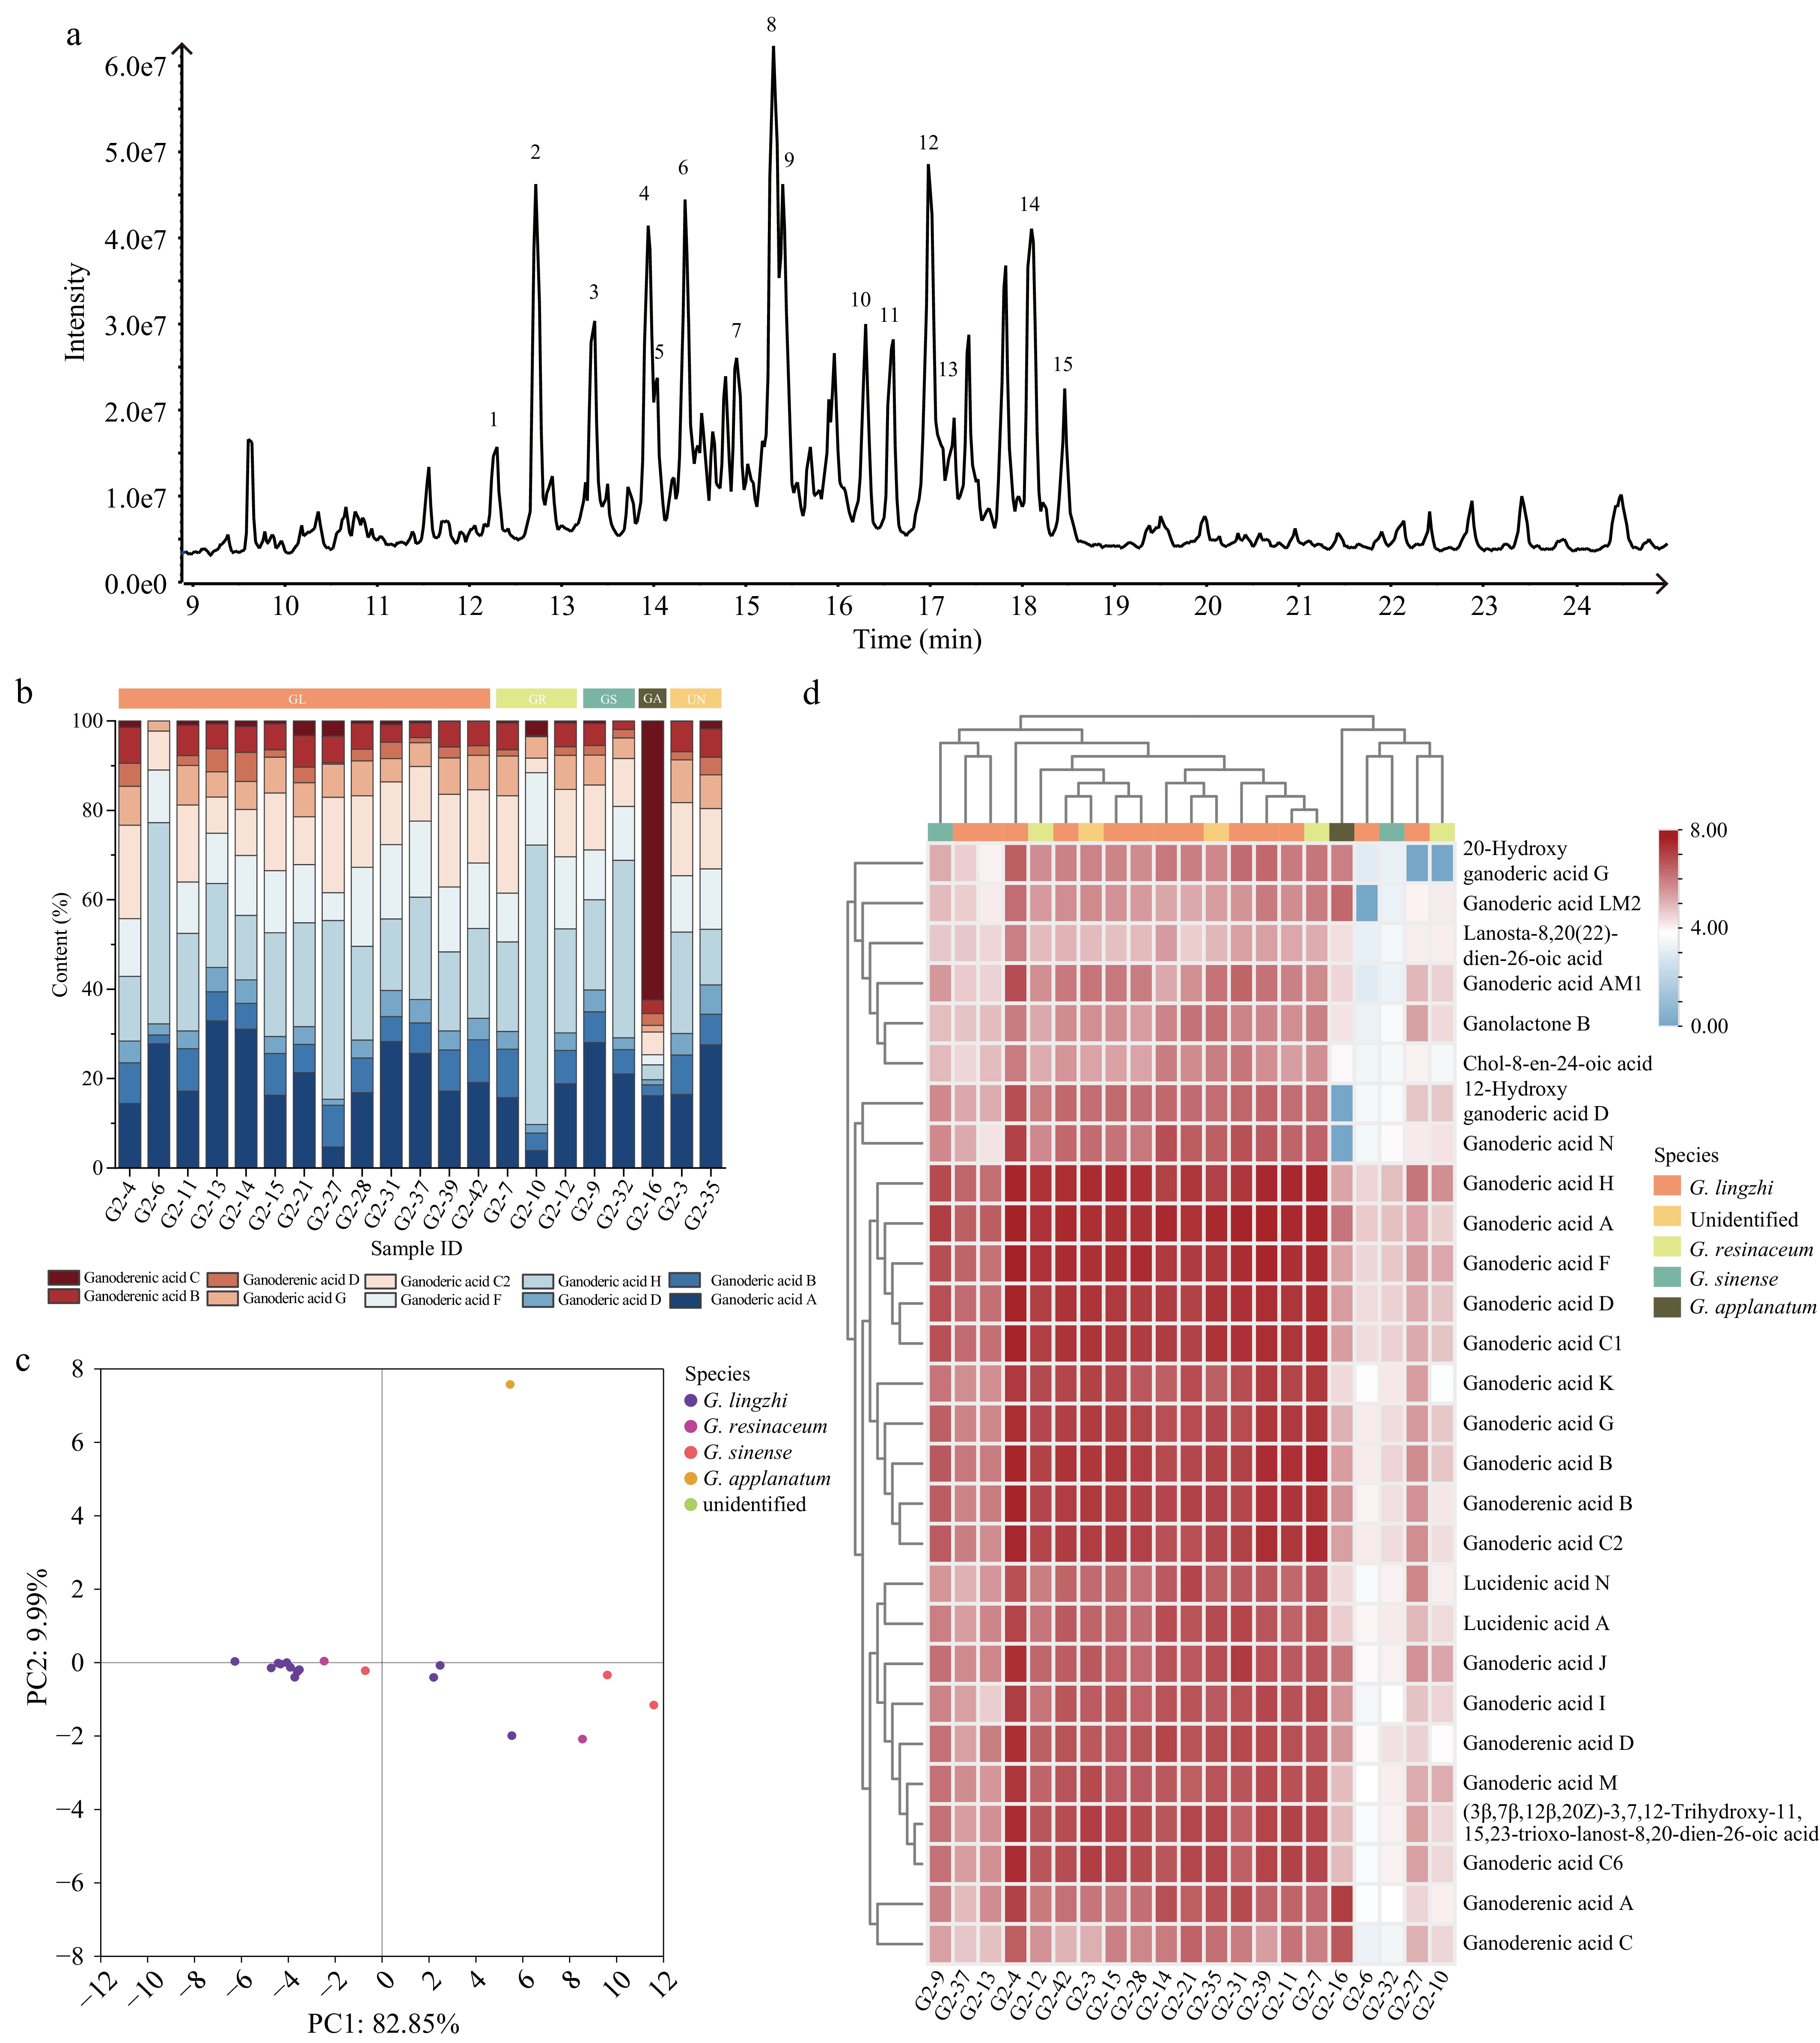
Figure 4.
Chemical profiling analysis of Ganoderma fruiting bodies. (a) ESI-MS total ion chromatogram profiles of the Ganoderma fruiting bodies. Peaks 1-15 correspond to the following compounds: Ganoderenic acid C; Ganoderic acid C2, C6, and G; Ganoderenic acid B; Ganoderic acid B; Ganoderenic acid A; Ganoderic acid A and H; Lucidenic acid A; Ganoderenic acid D; Ganoderic acid D, C1, F, and J. (b) Stacking diagram of ten ganoderic acid contents in Ganoderma fruiting bodies. (c) HCA of Ganoderma fruiting bodies samples. (d) PCA of Ganoderma fruiting bodies samples.
-
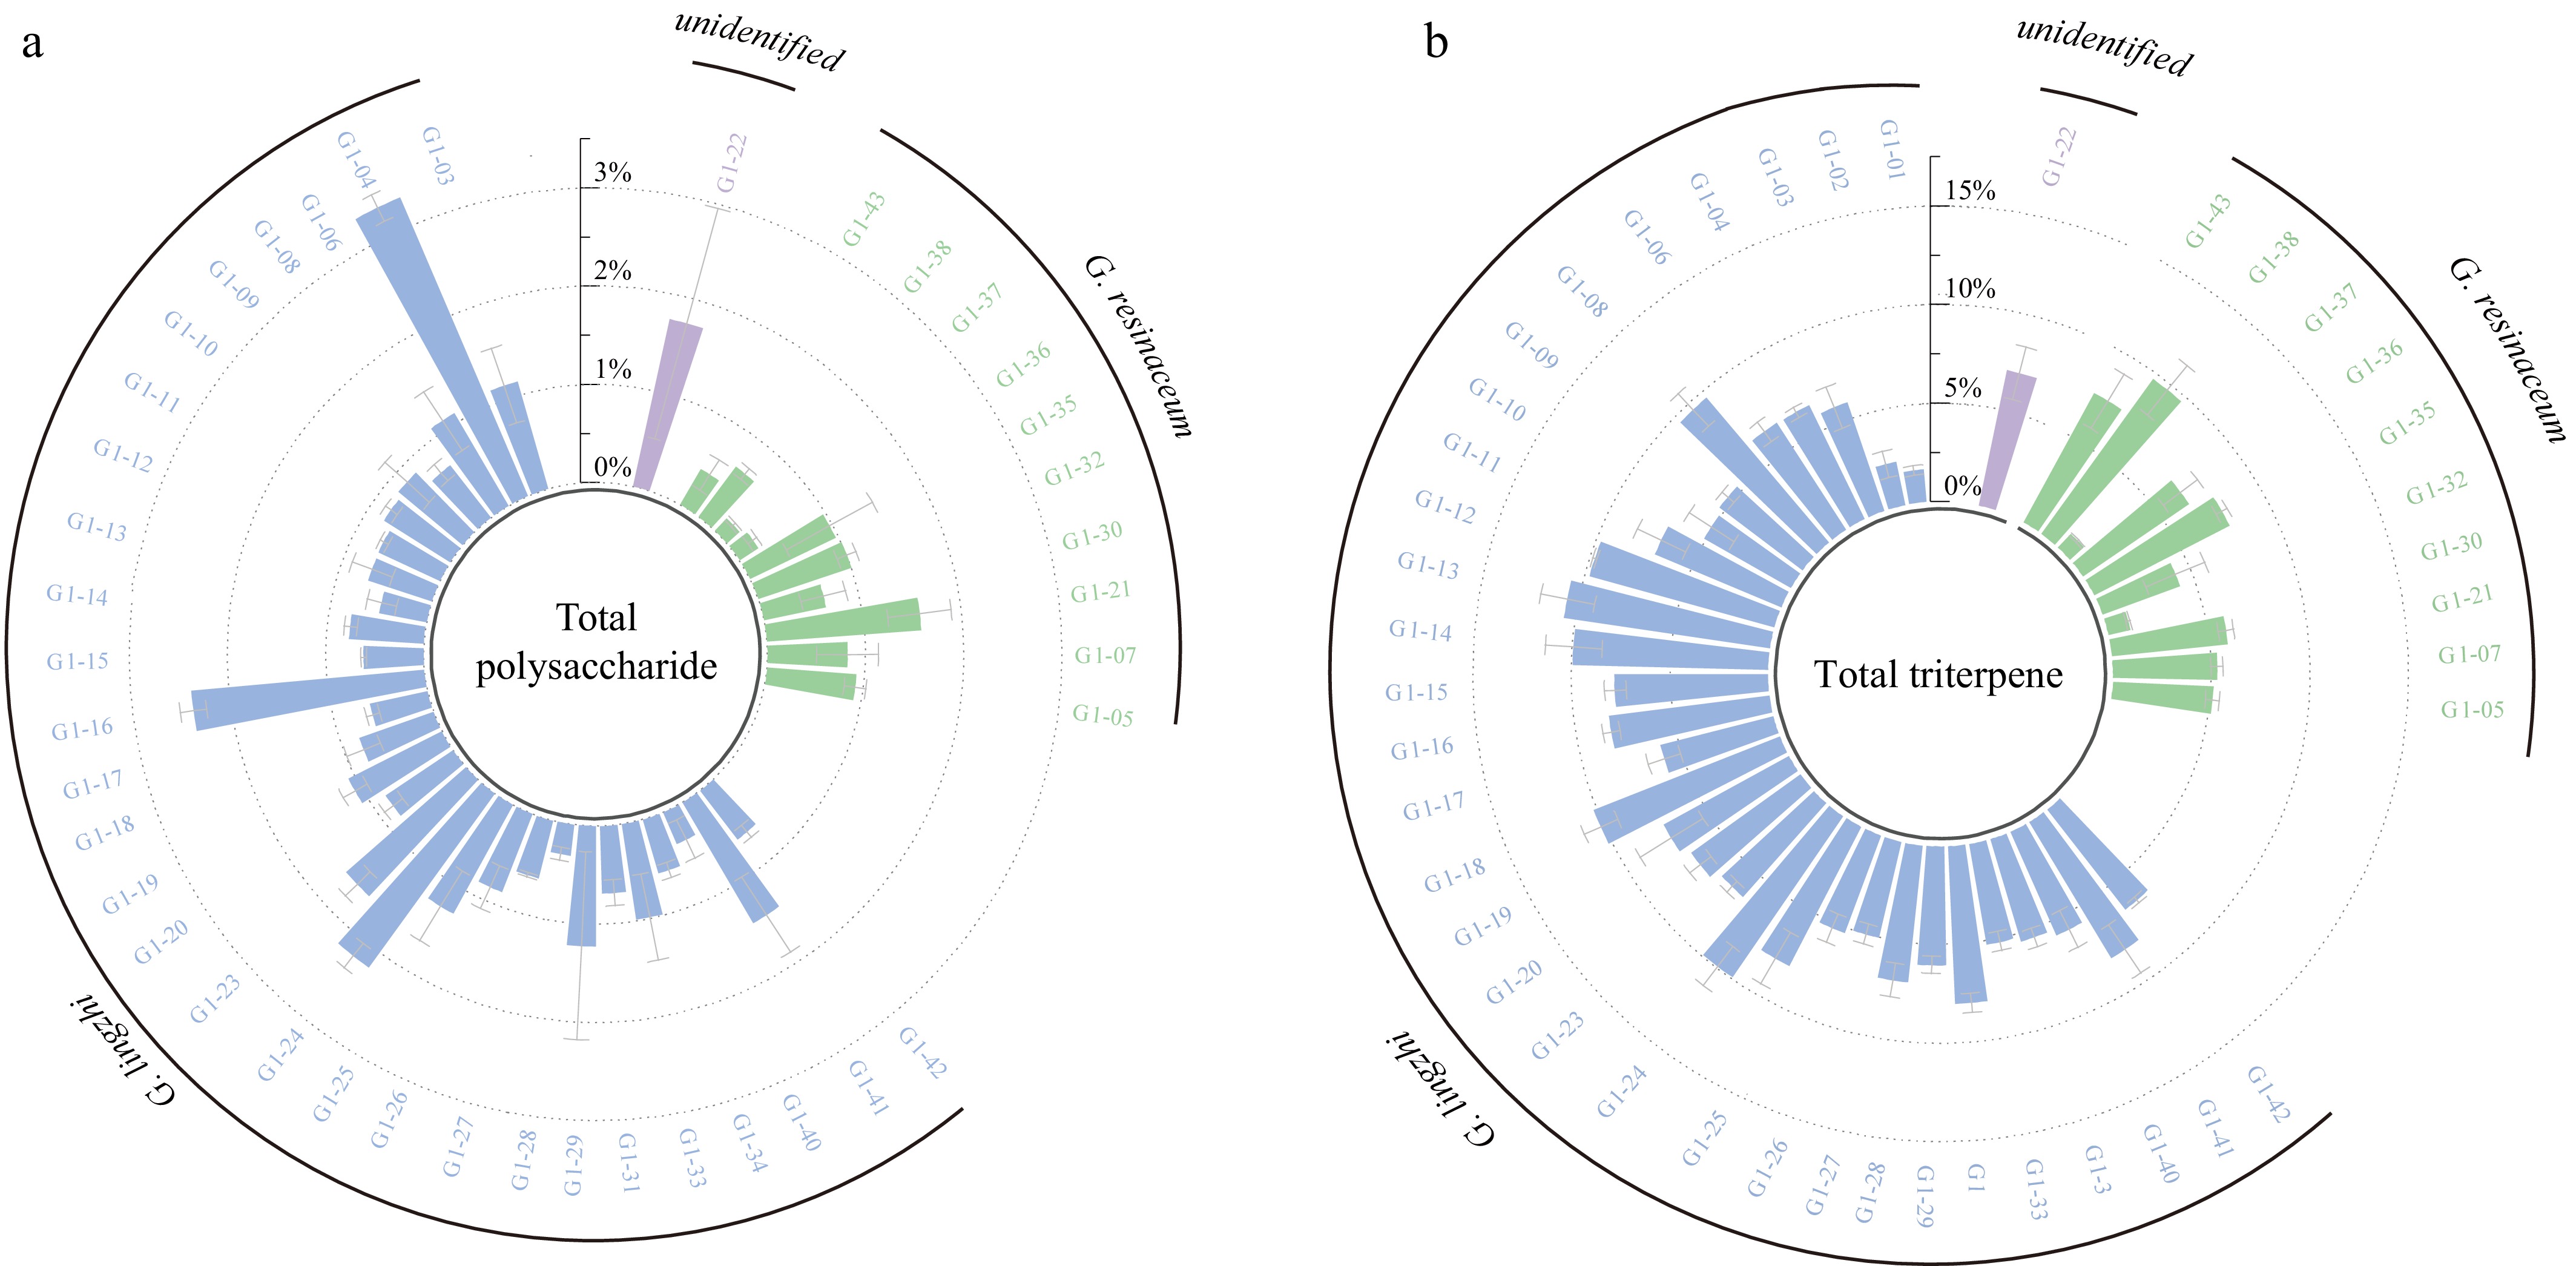
Figure 5.
Histogram of (a) total polysaccharide, and (b) total triterpene content of Ganoderma spores.
-
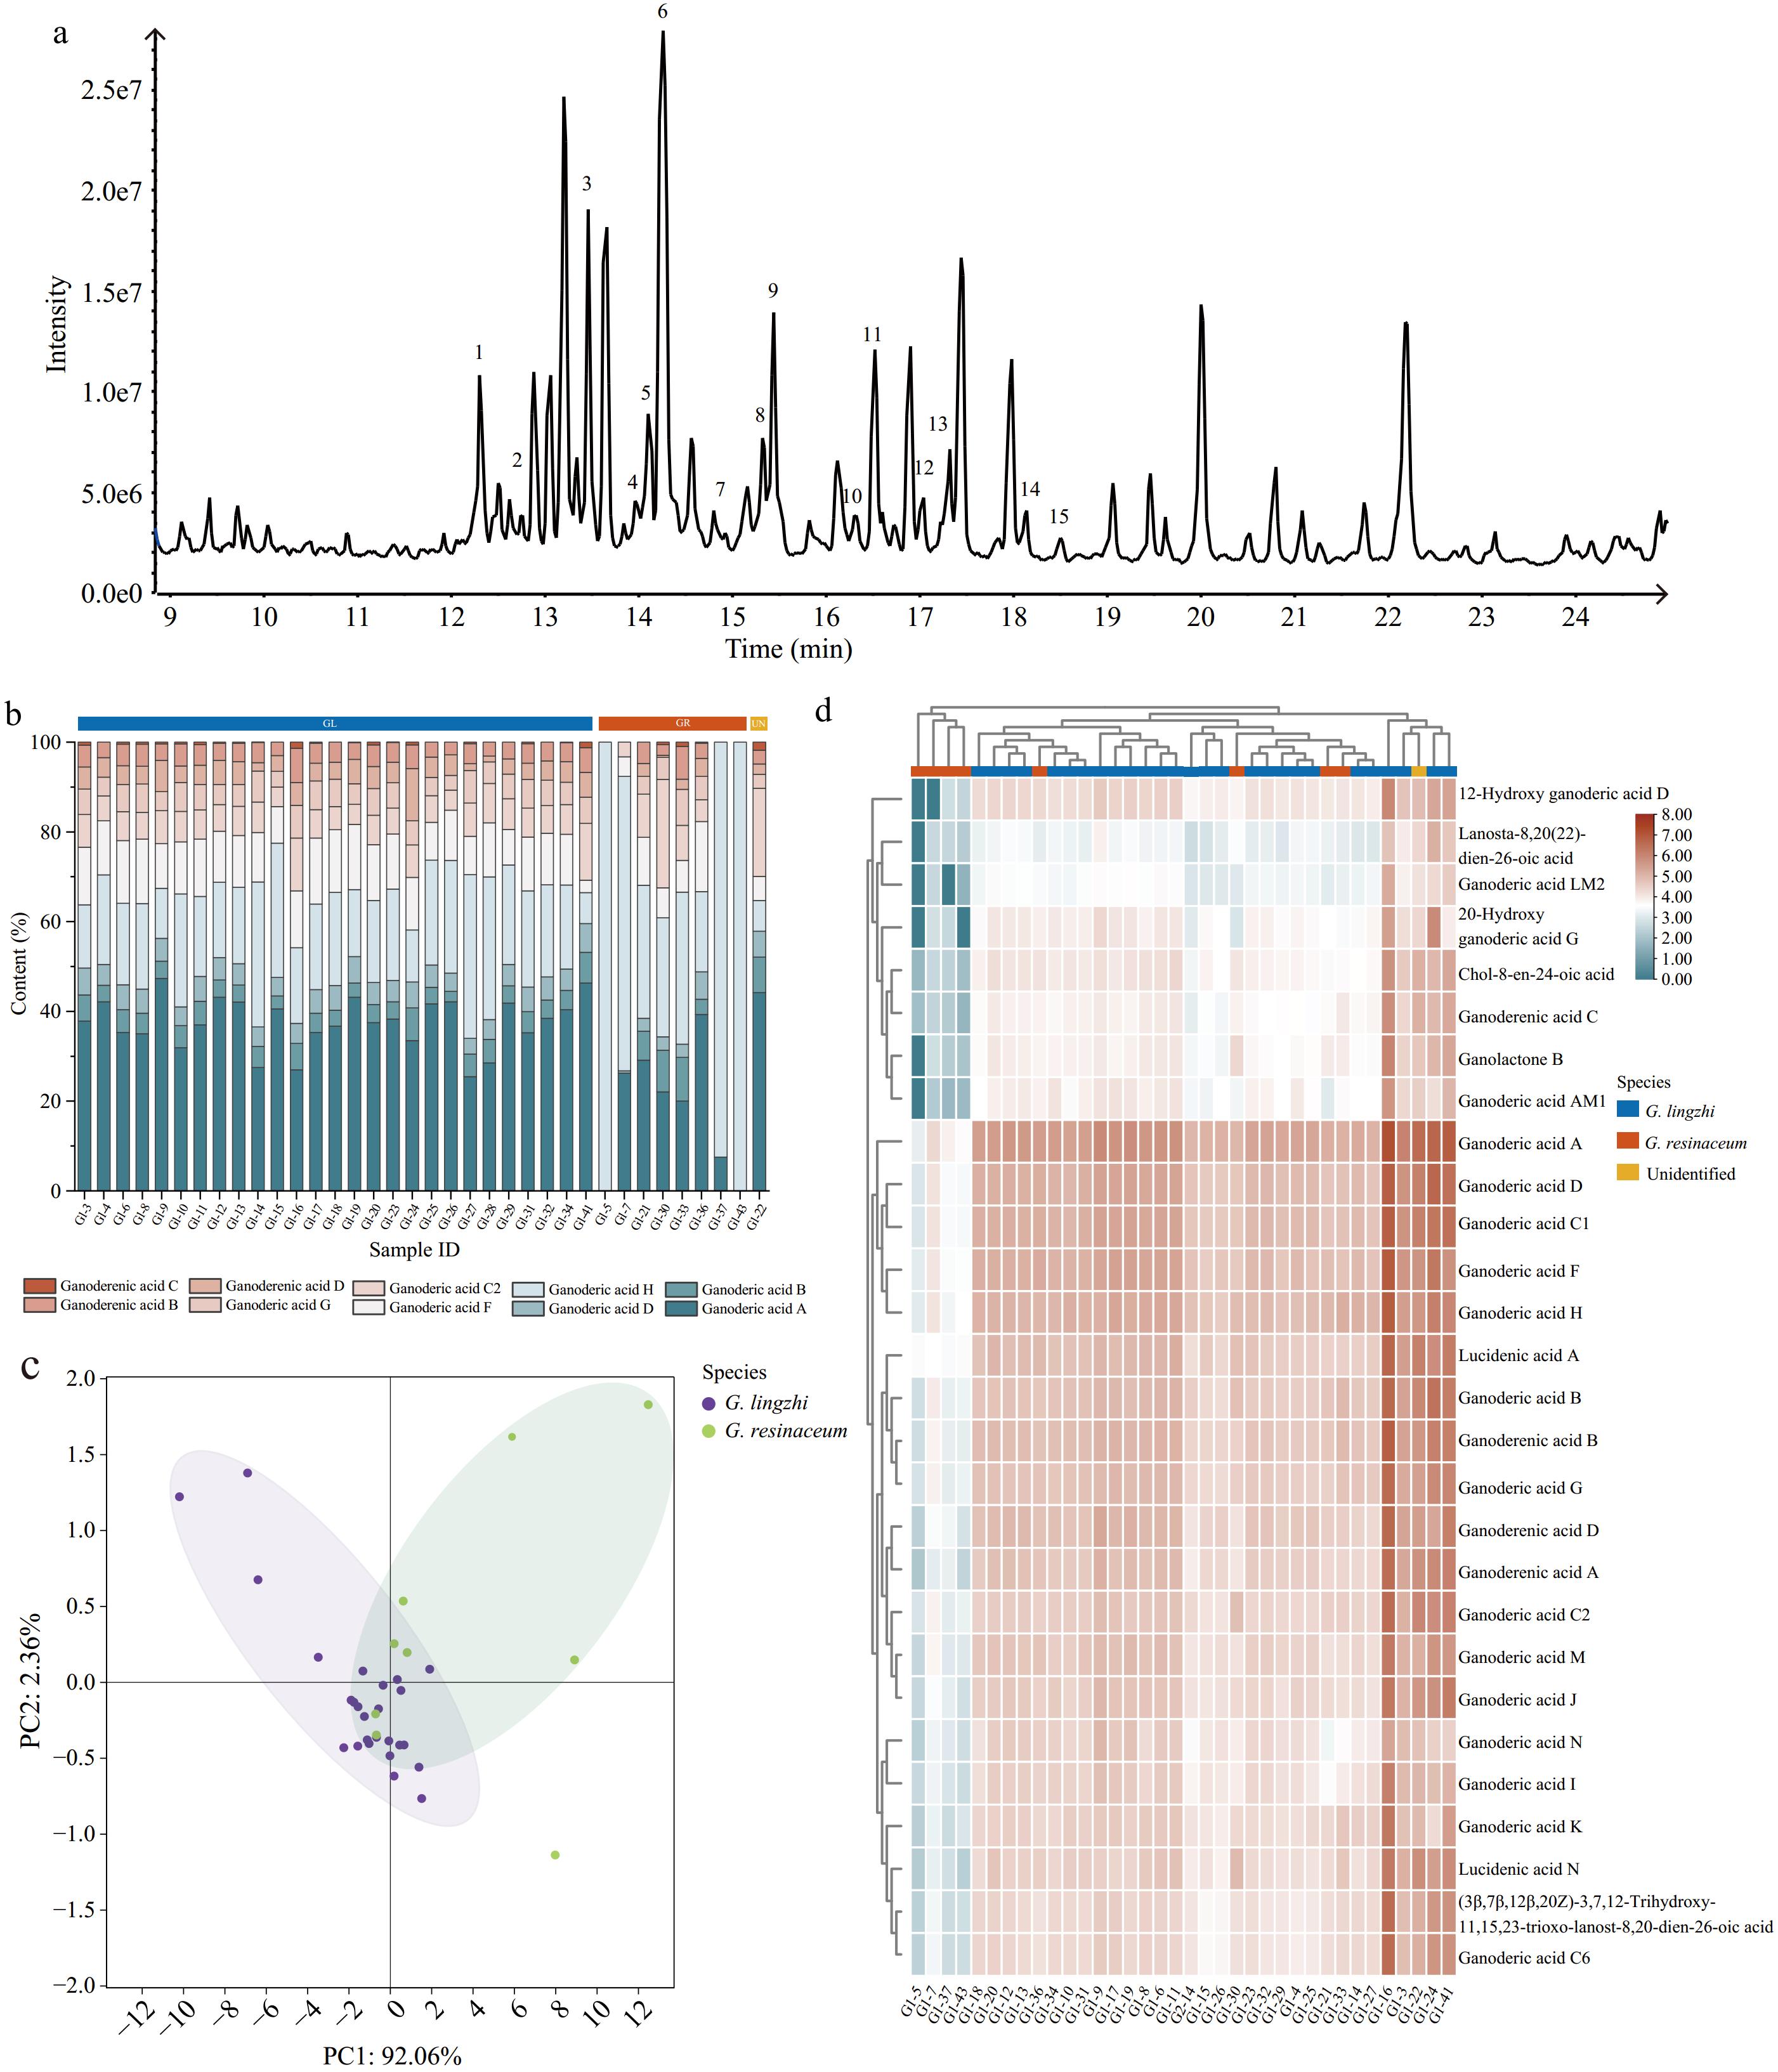
Figure 6.
Chemical profiling analysis of Ganoderma spore samples. (a) ESI-MS total ion chromatogram profiles of the Ganoderma spores. Peaks 1−15 correspond to the following compounds: Ganoderenic acid C; Ganoderic acid C2, C6, and G; Ganoderenic acid B; Ganoderic acid B; Ganoderenic acid A; Ganoderic acid A and H; Lucidenic acid A; Ganoderenic acid D; Ganoderic acid D, C1, F, and J. (b) Stacking diagram of ten ganoderic acid contents in Ganoderma spores. (c) HCA of Ganoderma spore samples. (d) PCA of Ganoderma spore samples.
-
ID Origin Sample type ID Origin Sample type G1-1 / Spores G2-1 Yunnan Fruiting body G1-2 / Spores G2-2 Anhui Fruiting body G1-3 Anhui Spores G2-3 Jilin Fruiting body G1-4 Jilin Spores G2-4 / Fruiting body G1-5 Jilin Spores G2-5 Fujian Fruiting body G1-6 Jilin Spores G2-6 Fujian Fruiting body G1-7 Jilin Spores G2-7 Jilin Fruiting body G1-8 / Spores G2-8 / Fruiting body G1-9 Zhejiang Spores G2-9 / Fruiting body G1-10 Jiangsu Spores G2-10 / Fruiting body G1-11 Anhui Spores G2-11 Sichuan Fruiting body G1-12 Shandong Spores G2-12 Jilin Fruiting body G1-13 Shandong Spores G2-13 Zhejiang Fruiting body G1-14 Fujian Spores G2-14 Zhejiang Fruiting body G1-15 Jiangsu Spores G2-15 Jilin Fruiting body G1-16 / Spores G2-16 Heilongjiang Fruiting body G1-17 Zhejiang Spores G2-17 / Fruiting body G1-18 / Spores G2-18 / Fruiting body G1-19 Anhui Spores G2-19 Jilin Fruiting body G1-20 Zhejiang Spores G2-20 Sichuan Fruiting body G1-21 / Spores G2-21 Fujian Fruiting body G1-22 Shanghai Spores G2-22 Jilin Fruiting body G1-23 Shandong Spores G2-23 Jilin Fruiting body G1-24 Zhejiang Spores G2-24 Jiangsu Fruiting body G1-25 / Spores G2-25 Shandong Fruiting body G1-26 Shandong Spores G2-26 Zhejiang Fruiting body G1-27 Fujian Spores G2-27 / Fruiting body G1-28 Yunnan Spores G2-28 / Fruiting body G1-29 Jilin Spores G2-29 / Fruiting body G1-30 Guizhou Spores G2-30 / Fruiting body G1-31 / Spores G2-31 Fujian Fruiting body G1-32 Shandong Spores G2-32 Anhui Fruiting body G1-33 Zhejiang Spores G2-33 Anhui Fruiting body G1-34 Anhui Spores G2-34 / Fruiting body G1-35 Zhejiang Spores G2-35 / Fruiting body G1-36 Anhui Spores G2-36 Fujian Fruiting body G1-37 Anhui Spores G2-37 Guangxi Fruiting body G1-38 Shandong Spores G2-38 / Fruiting body G1-39 / Spores G2-39 Shandong Fruiting body G1-40 Anhui Spores G2-40 Shandong Fruiting body G1-41 Guangdong Spores G2-41 Fujian Fruiting body G1-42 Jilin Spores G2-42 Anhui Fruiting body G1-43 Shandong Spores G2-43 Jiangxi Fruiting body Table 1.
Detailed information on commercial Ganoderma.
-
Peak Compound Molecular formula Molecular weight (g/mol) Time (min) Oberserved mass (m/z) Adduction Fragment ion 1 Ganoderenic acid C C30H44O7 516.3087 12.123 515.2 [M-H]− 441.1907; 249.1095; 73.0196 2 Ganoderic acid C2 C30H46O7 518.3244 12.733 517.3 [M-H]− 499.2824; 287.1859; 302.1629 3 Ganoderic acid C6 C30H42O8 530.2880 13.378 529.2 [M-H]− 467.2006; 437.1587; 481.1406 4 Ganoderic acid G C30H44O8 532.3036 13.997 531.2 [M-H]− 265.1016; 513.1977; 301.1314 5 Ganoderenic acid B C30H42O7 514.2931 14.035 513.2 [M-H]− 495.1907; 249.1094; 451.2085 6 Ganoderic acid B C30H44O7 516.3087 14.419 515.2 [M-H]− 497.2048; 249.1093; 303.1465 7 Ganoderenic acid A C30H42O7 514.2931 14.879 513.2 [M-H]− 79.0585; 193.0563; 301.1320 8 Ganoderic acid A C30H44O7 516.3087 15.333 515.2 [M-H]− 285.1044; 497.2075; 300.1244 9 Ganoderic acid H C32H44O9 572.2985 15.428 571.1 [M-H]− 467.1480; 437.1086; 511.1257 10 Lucidenic acid A C27H38O6 458.2668 16.314 457.2 [M-H]− 149.0372; 209.0844; 457.1824 11 Ganoderenic acid D C30H40O7 512.2774 16.663 511.2 [M-H]− 493.1752; 149.0374; 285.1388 12 Ganoderic acid D C30H42O7 514.2931 17.005 513.2 [M-H]− 149.0378; 301.1316; 495.1914 13 Ganoderic acid C1 C30H42O7 514.2931 17.310 513.2 [M-H]− 149.0377; 301.2091; 495.3171 14 Ganoderic acid F C32H42O9 570.2829 18.172 569.2 [M-H]− 465.1849; 435.1430; 509.1673 15 Ganoderic acid J C30H42O7 514.2931 18.48 513.3 [M-H]− 421.2132; 301.1556; 451.2606 Table 2.
Mass spectral information on representative ganoderic acid compounds.
Figures
(6)
Tables
(2)