-
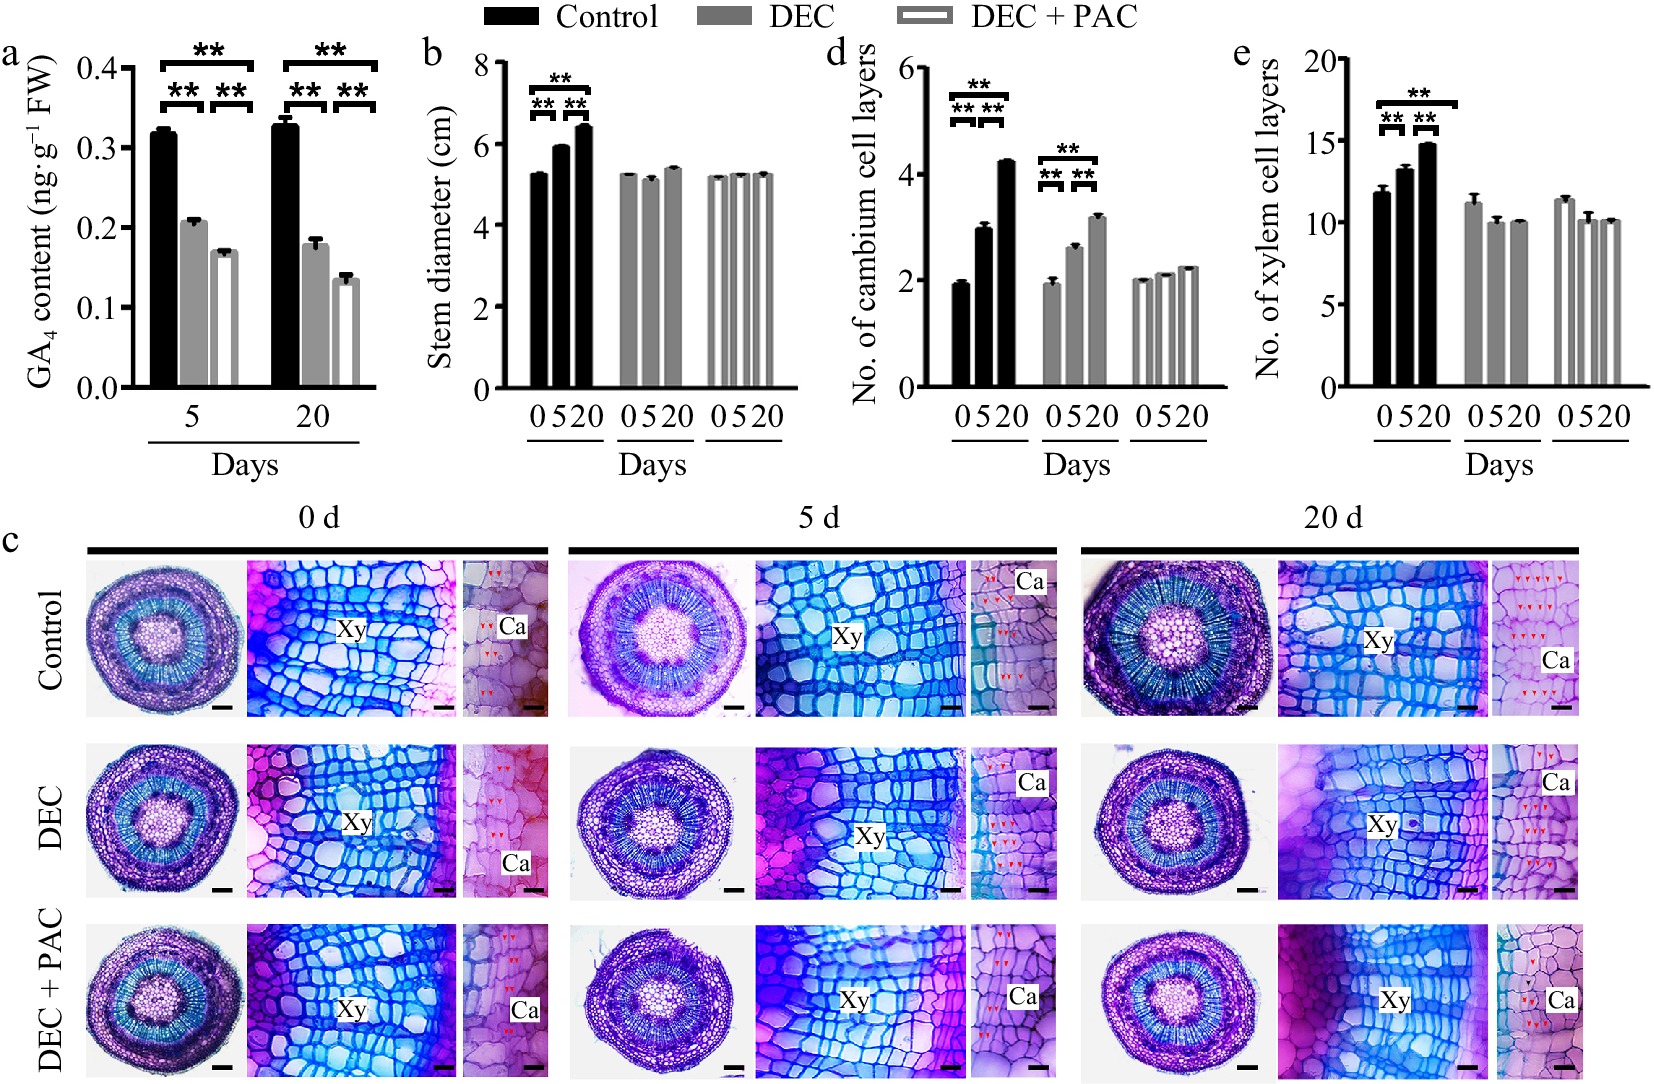
Figure 1.
Determination of local de novo synthesis of bioactive GAs in poplar stems. (a) GA4 levels in poplar stems were measured after 5 or 20 d of decapitation and/or paclobutrazol (PAC) treatments using GC-MS. Error bars represent ± standard deviation (SD). Asterisks denote statistically significant differences between control and decapitation and/or PAC treatments (one-way ANOVA followed by Tukey's test for pairwise comparisons; **, p < 0.01; n = 3). (b) Stem diameter was measured after 5 or 20 d of decapitation and/or PAC treatments. (c) Cross-sections of wild-type (WT) poplar plants subjected to decapitation and PAC treatments, grown in WPM medium for 5 and 20 d, respectively. Red arrows indicate cambium cells. Scale bars: left, 250 μm; middle and right, 50 μm. (d), (e) Quantification of cambium and xylem cell layers in poplar stems following decapitation and/or PAC treatments. Error bars represent ± SD. Asterisks indicate significant differences in cambium and xylem cell layers between decapitation and PAC treatments (one-way ANOVA followed by Tukey's test for pairwise comparisons; **, p < 0.01; n = 4). DEC, decapitation; PAC, 10 μM paclobutrazol.
-
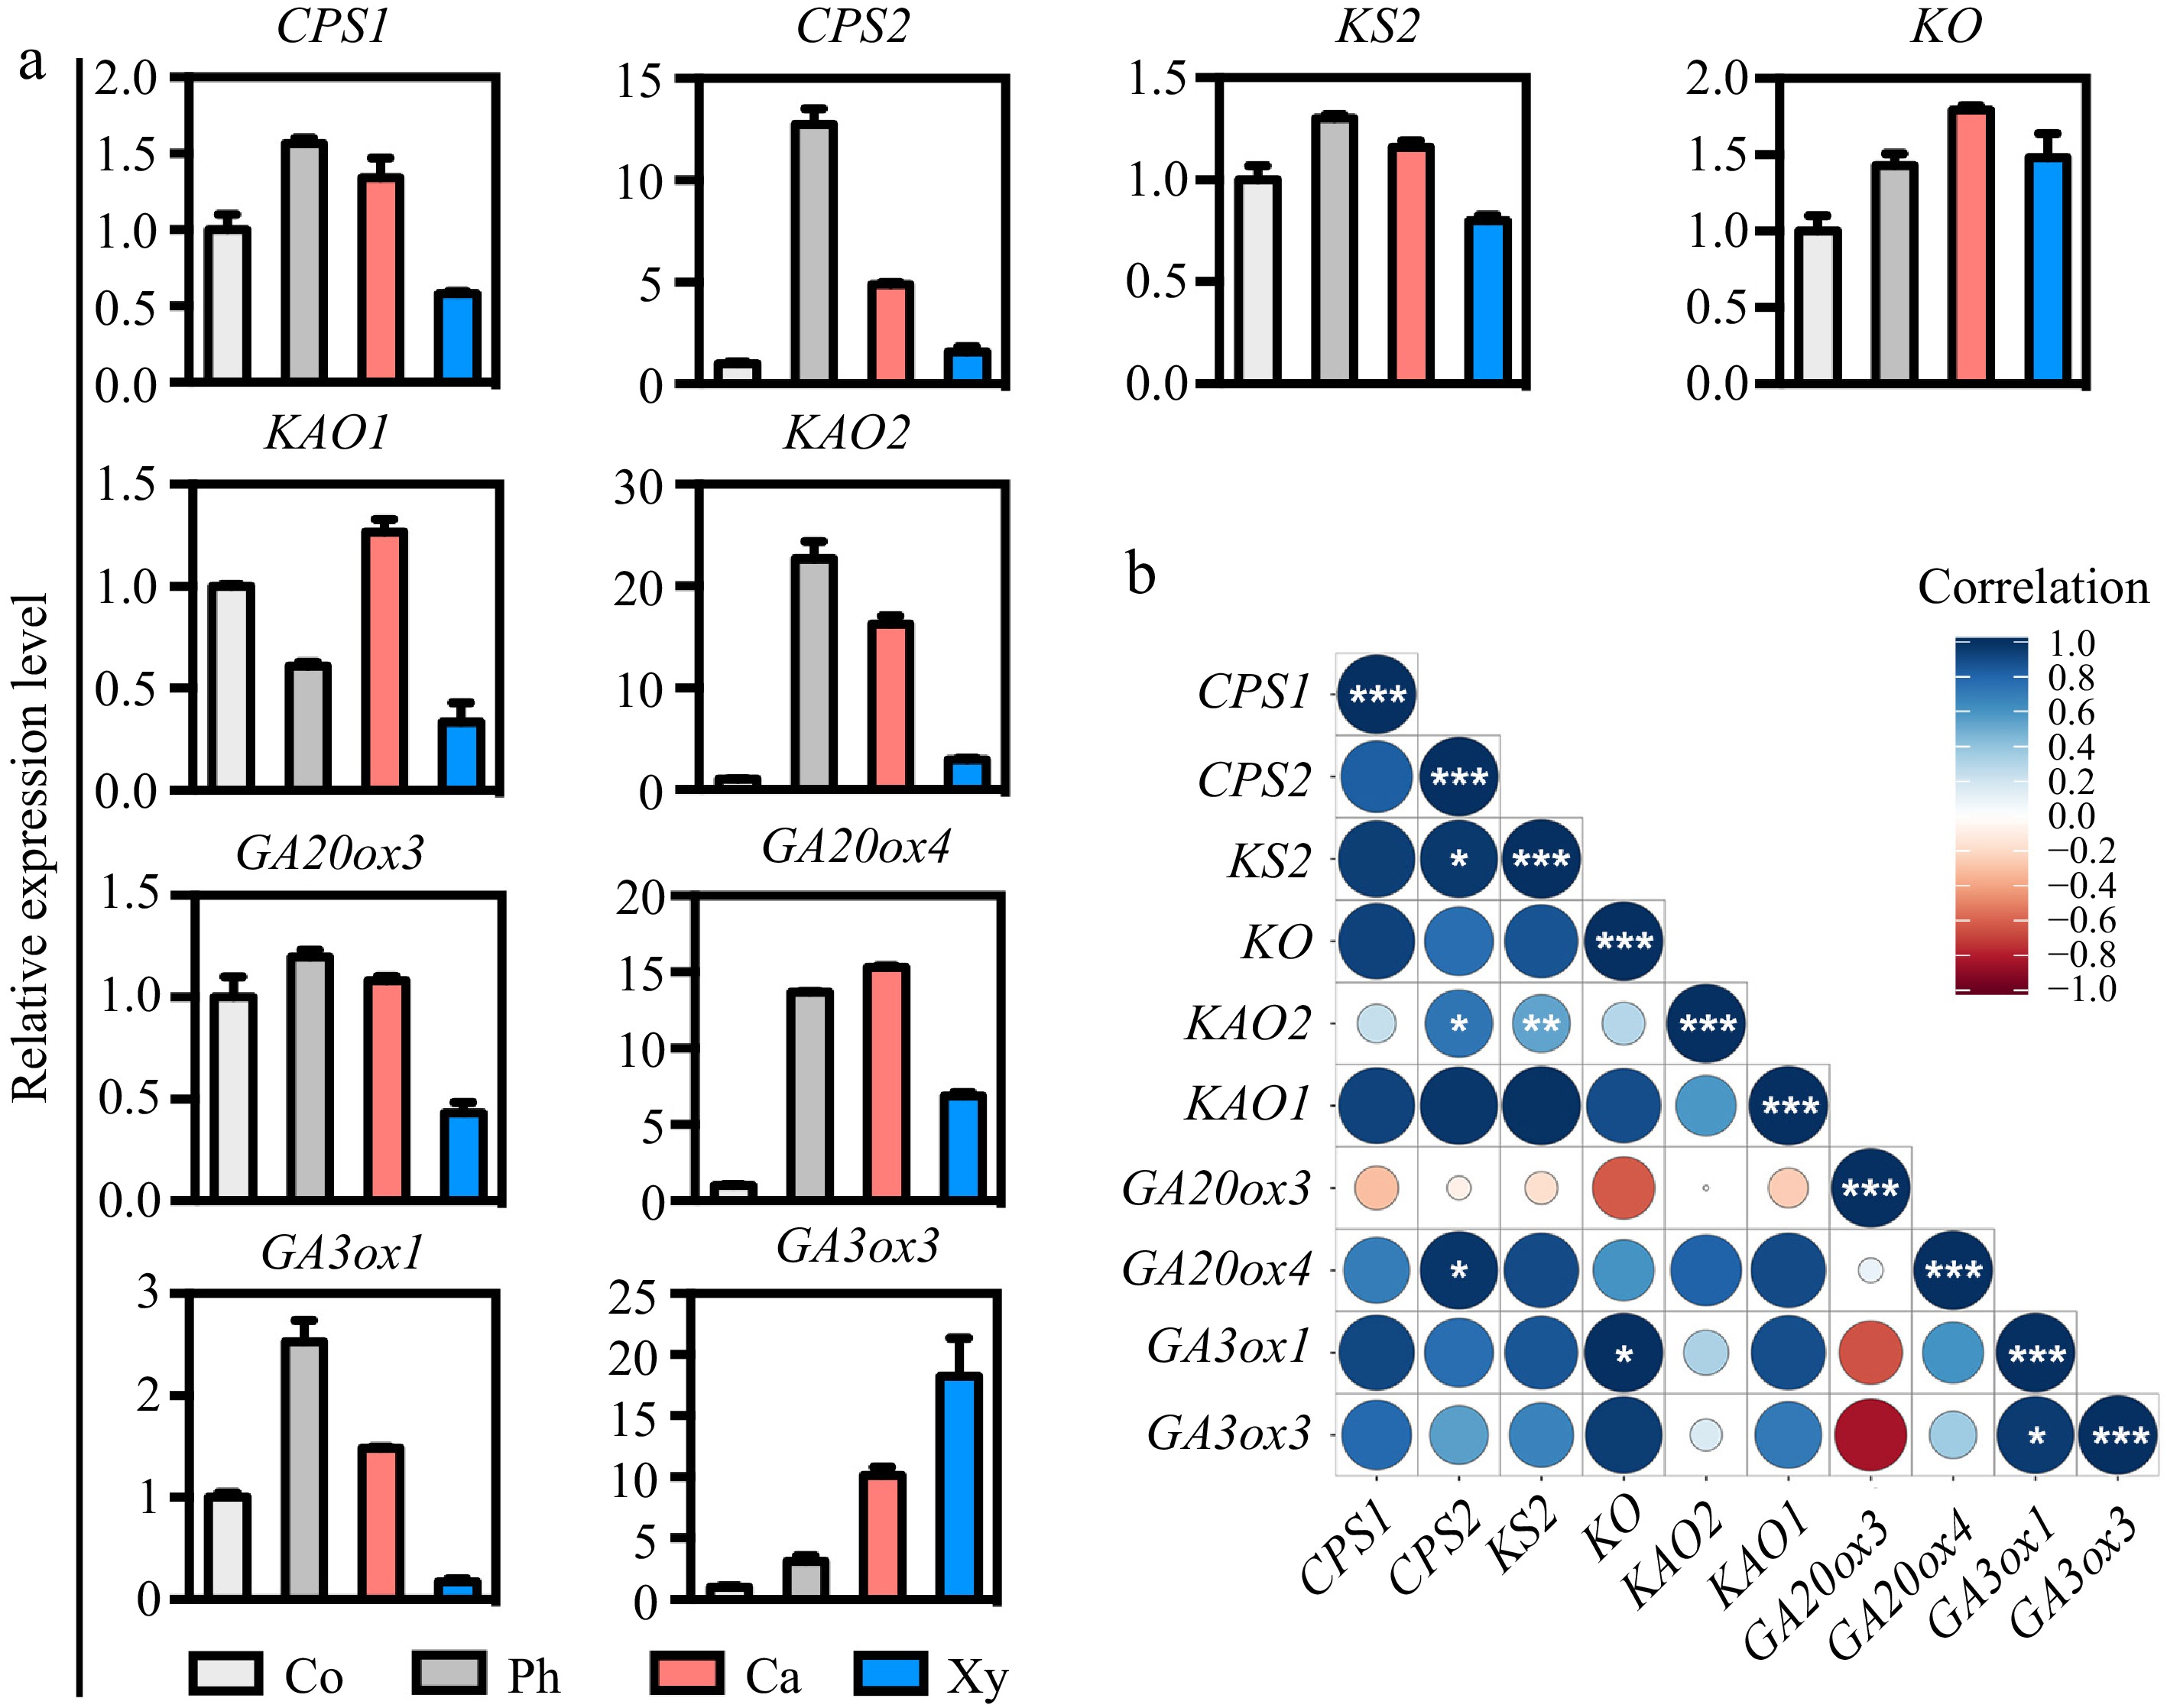
Figure 2.
Expression patterns and correlation analysis of GA biosynthetic genes across wood-forming tissues in poplar stem. (a) The expression patterns of GA biosynthetic genes, including CPS1/2, KS2, KO, KAO1/2, GA20ox3/4, and GA3ox1/3, in various tissues of the poplar stem were assessed using micro-sections obtained through freezing microtome. The relative expression levels of each gene in the stem tissues were normalized to 1. Co = cortex; Ph = phloem; Ca = cambium; Xy = xylem. (b) Correlation analyses of the expression levels of GA biosynthetic genes in stem tissues were performed. Correlations were calculated based on a Student's t-distribution (degrees of freedom = n − 2, two-tailed test). Statistical significance is indicated as follows: *, p < 0.05; **, p < 0.01; ***, p < 0.001. Heatmaps were generated using RStudio software (R package: ggplot2). Positive correlations are represented by blue, while negative correlations are represented by red. The size of the circle corresponds to the strength of the co-expression correlation.
-
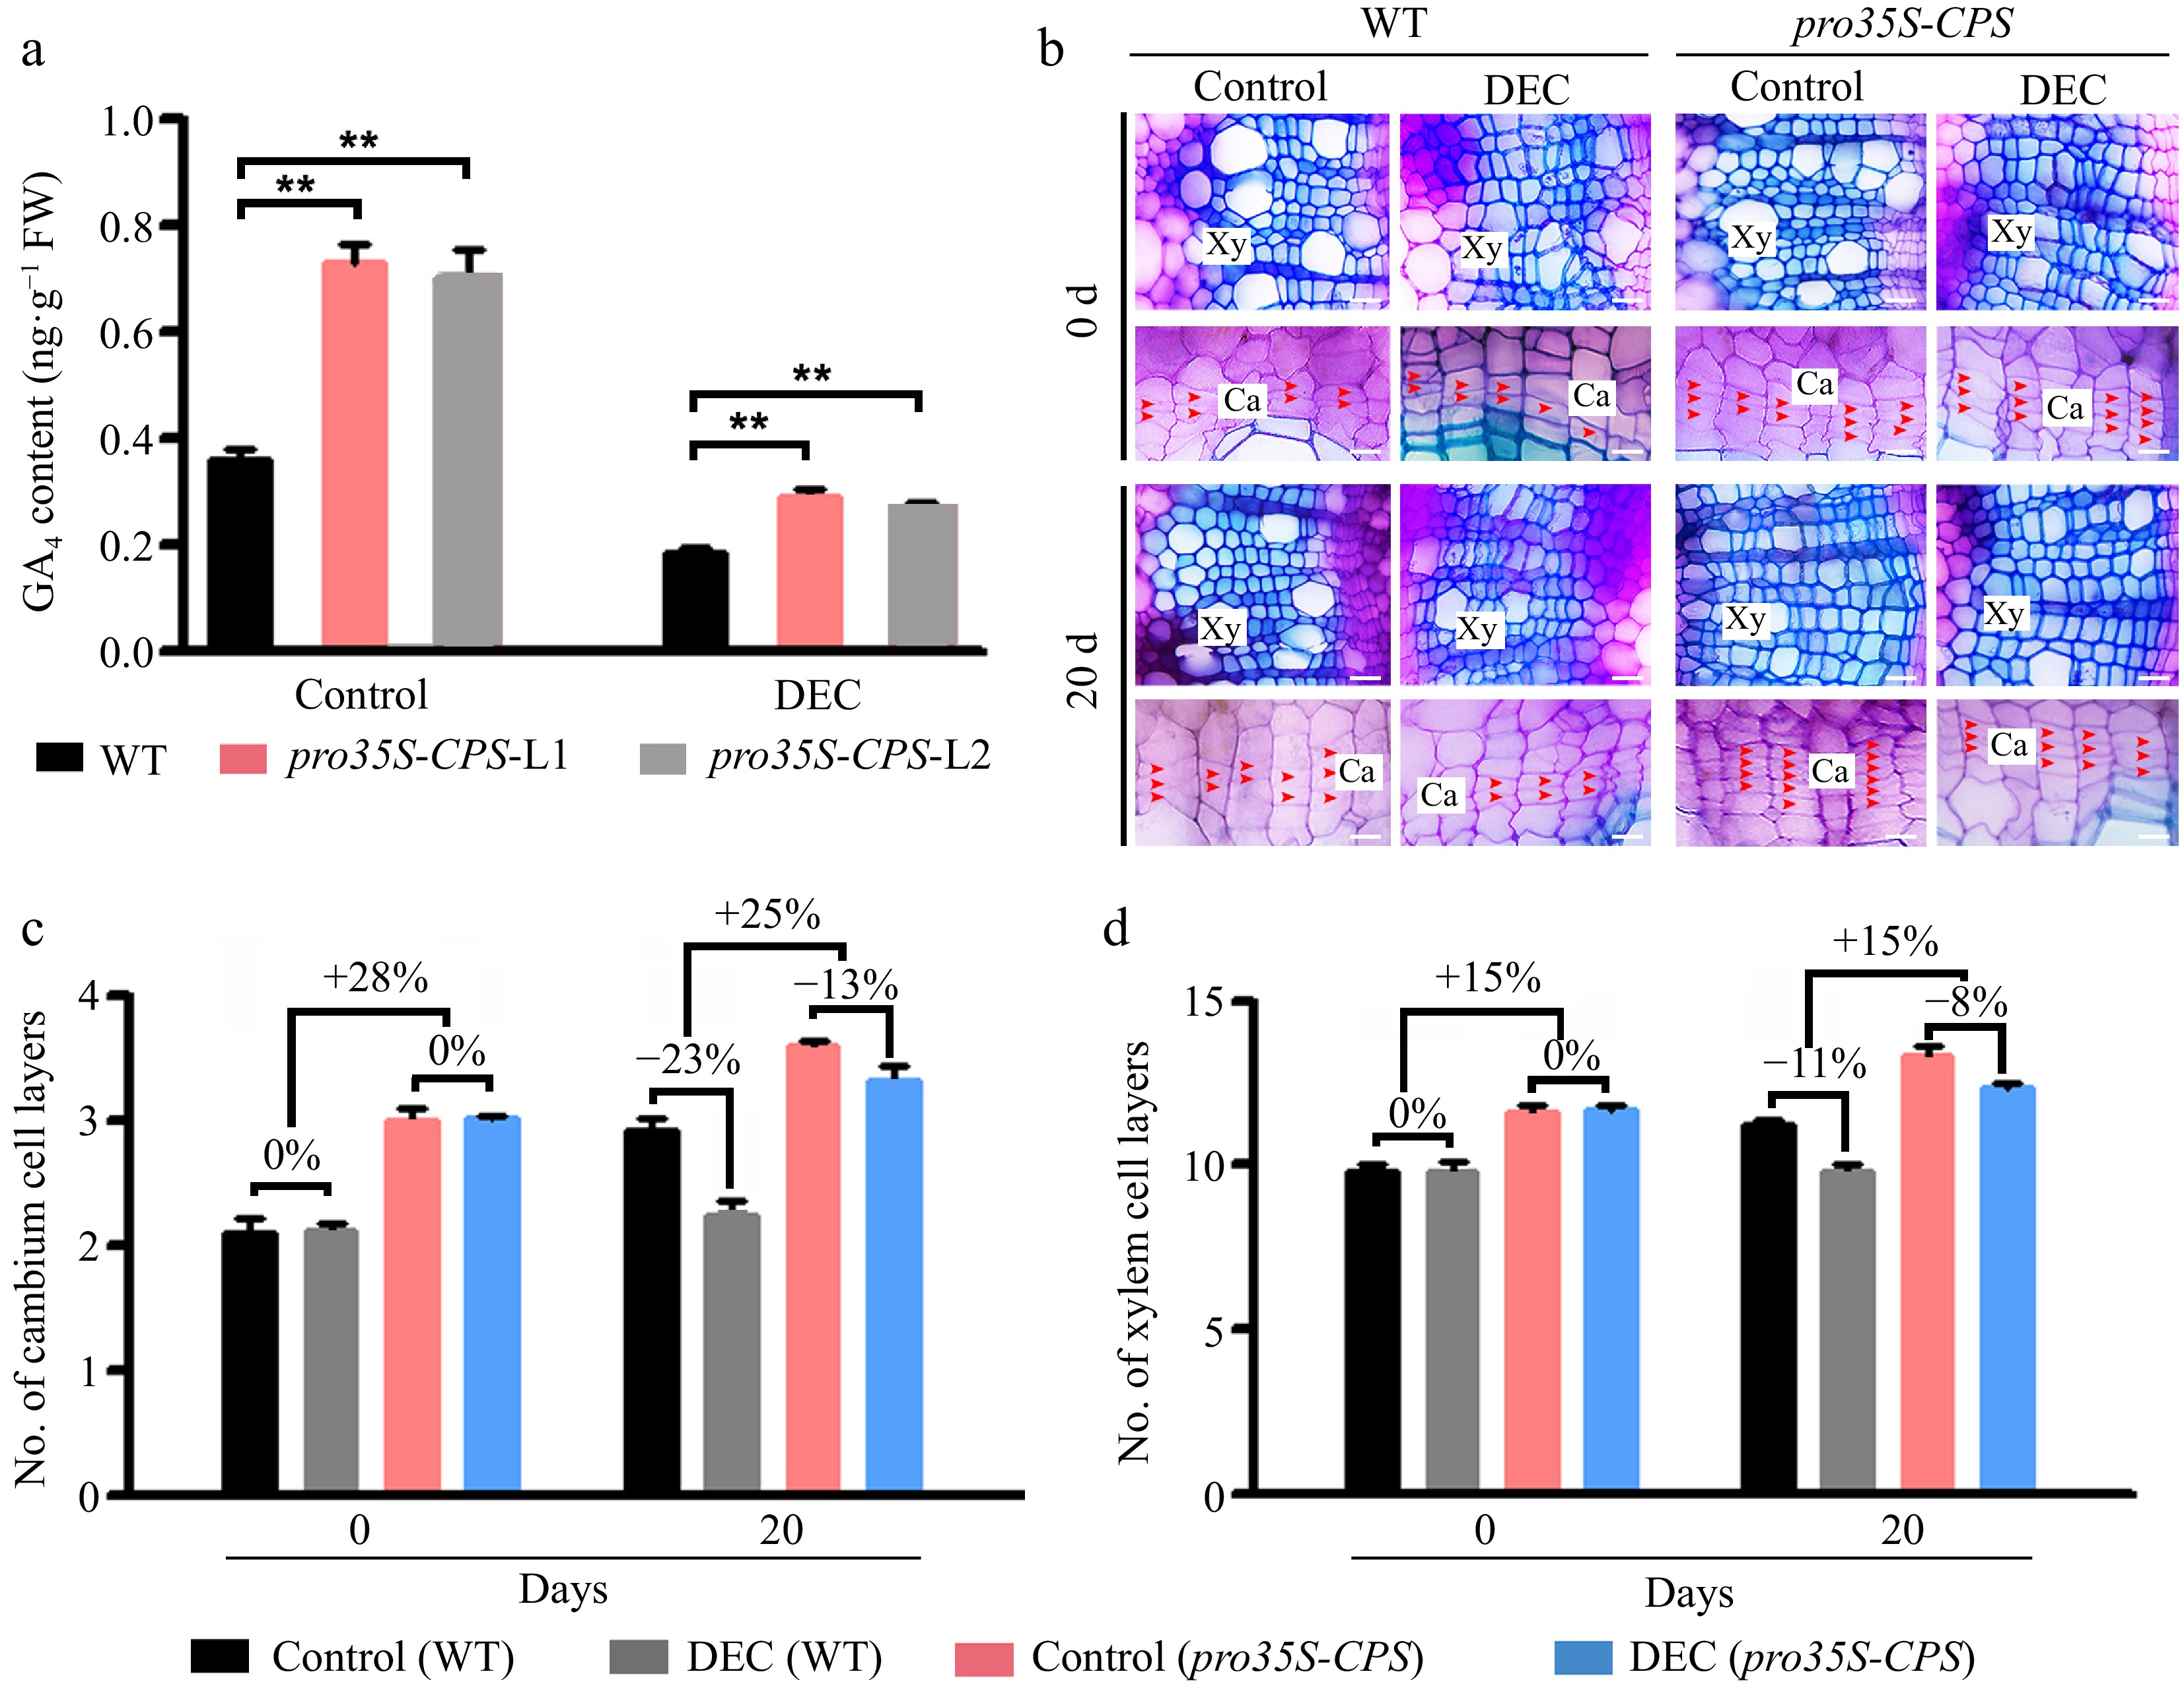
Figure 3.
Overexpression of the CPS gene led to an increase of GA content in the stems of transgenic plants and the improvement of wood formation. (a) The GA4 content was measured in wild-type (WT) and two transgenic pro35S-CPS poplar lines using gas chromatography-mass spectrometry (GC-MS). Error bars represent ± standard deviation (SD). Asterisks indicate statistically significant differences between the control and decapitation treatment, as determined by one-way ANOVA followed by Dunnett's test for pairwise comparisons (**, p < 0.01; n = 3). (b) Cross-sections of WT and transgenic pro35S-CPS plants were analyzed 20 d after decapitation treatment. Red arrows indicate cambium cells. Scale bars = 50 μm. Ca, cambium; Xy, xylem; DEC, decapitation. (c) and (d) Quantification of cambium and xylem cell layers in poplar stems subjected to decapitation treatment. Error bars represent ± SD (n = 3).
-
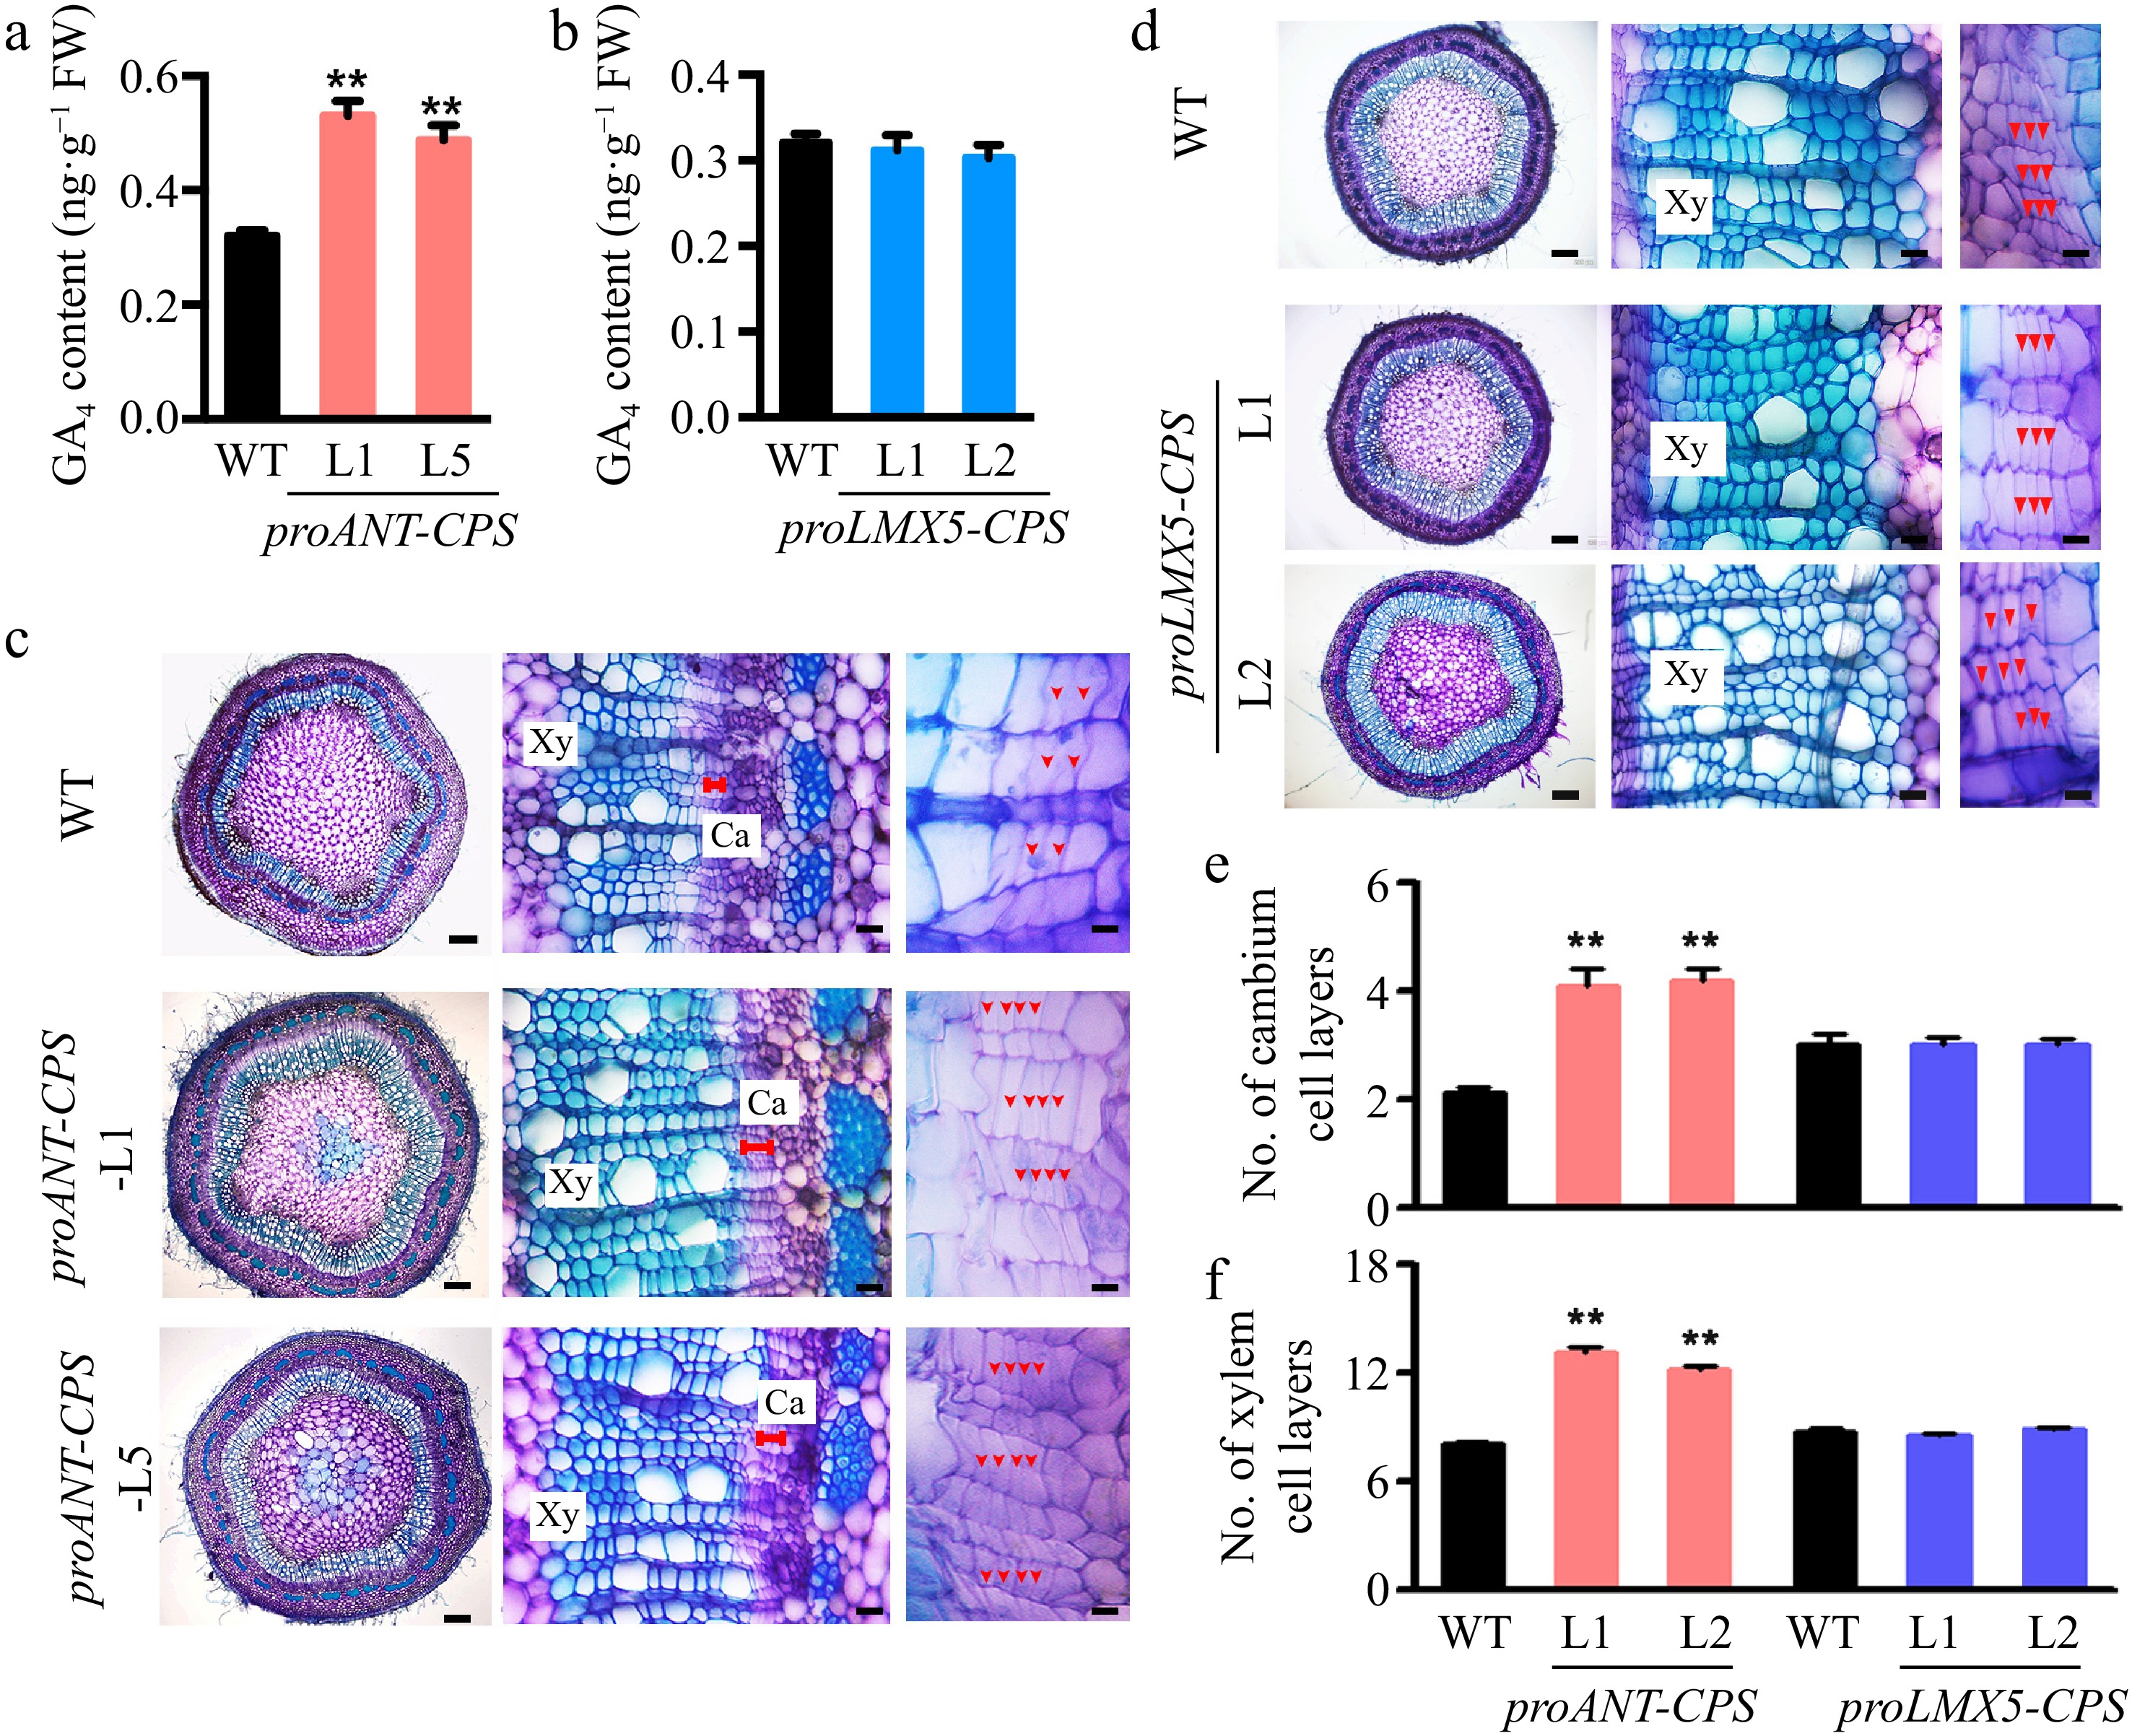
Figure 4.
Cambium-specific expression of the CPS gene improved local GA synthesis in the stem of transgenic poplar plants and enhanced wood development. (a) Measurement of GA4 content in two transgenic proANT-CPS poplar lines by GC-MS. Error bars represent the ± standard deviation (SD). Asterisks denote statistically significant differences between the control and decapitation treatments (one-way ANOVA followed by Dunnett's test for pairwise comparisons; **, p < 0.01; n = 3). (b) Measurement of GA4 content in two transgenic proLXM5-CPS poplar lines by GC-MS. Error bars represent ± SD (n = 3). (c), (d) Cross-sections of WT, transgenic proANT-CPS, and proLXM5-CPS stems. Red arrows indicate cambium cells. Scale bars: left, 250 μm; middle and right, 50 μm. Ca: cambium; Xy: xylem. (e), (f) Quantification of cambium and xylem cell layers in poplar stems. Error bars represent ± SD. Asterisks indicate statistically significant differences between the control and decapitation treatments (one-way ANOVA followed by Dunnett's test for pairwise comparisons; **, p < 0.01; n = 3).
-
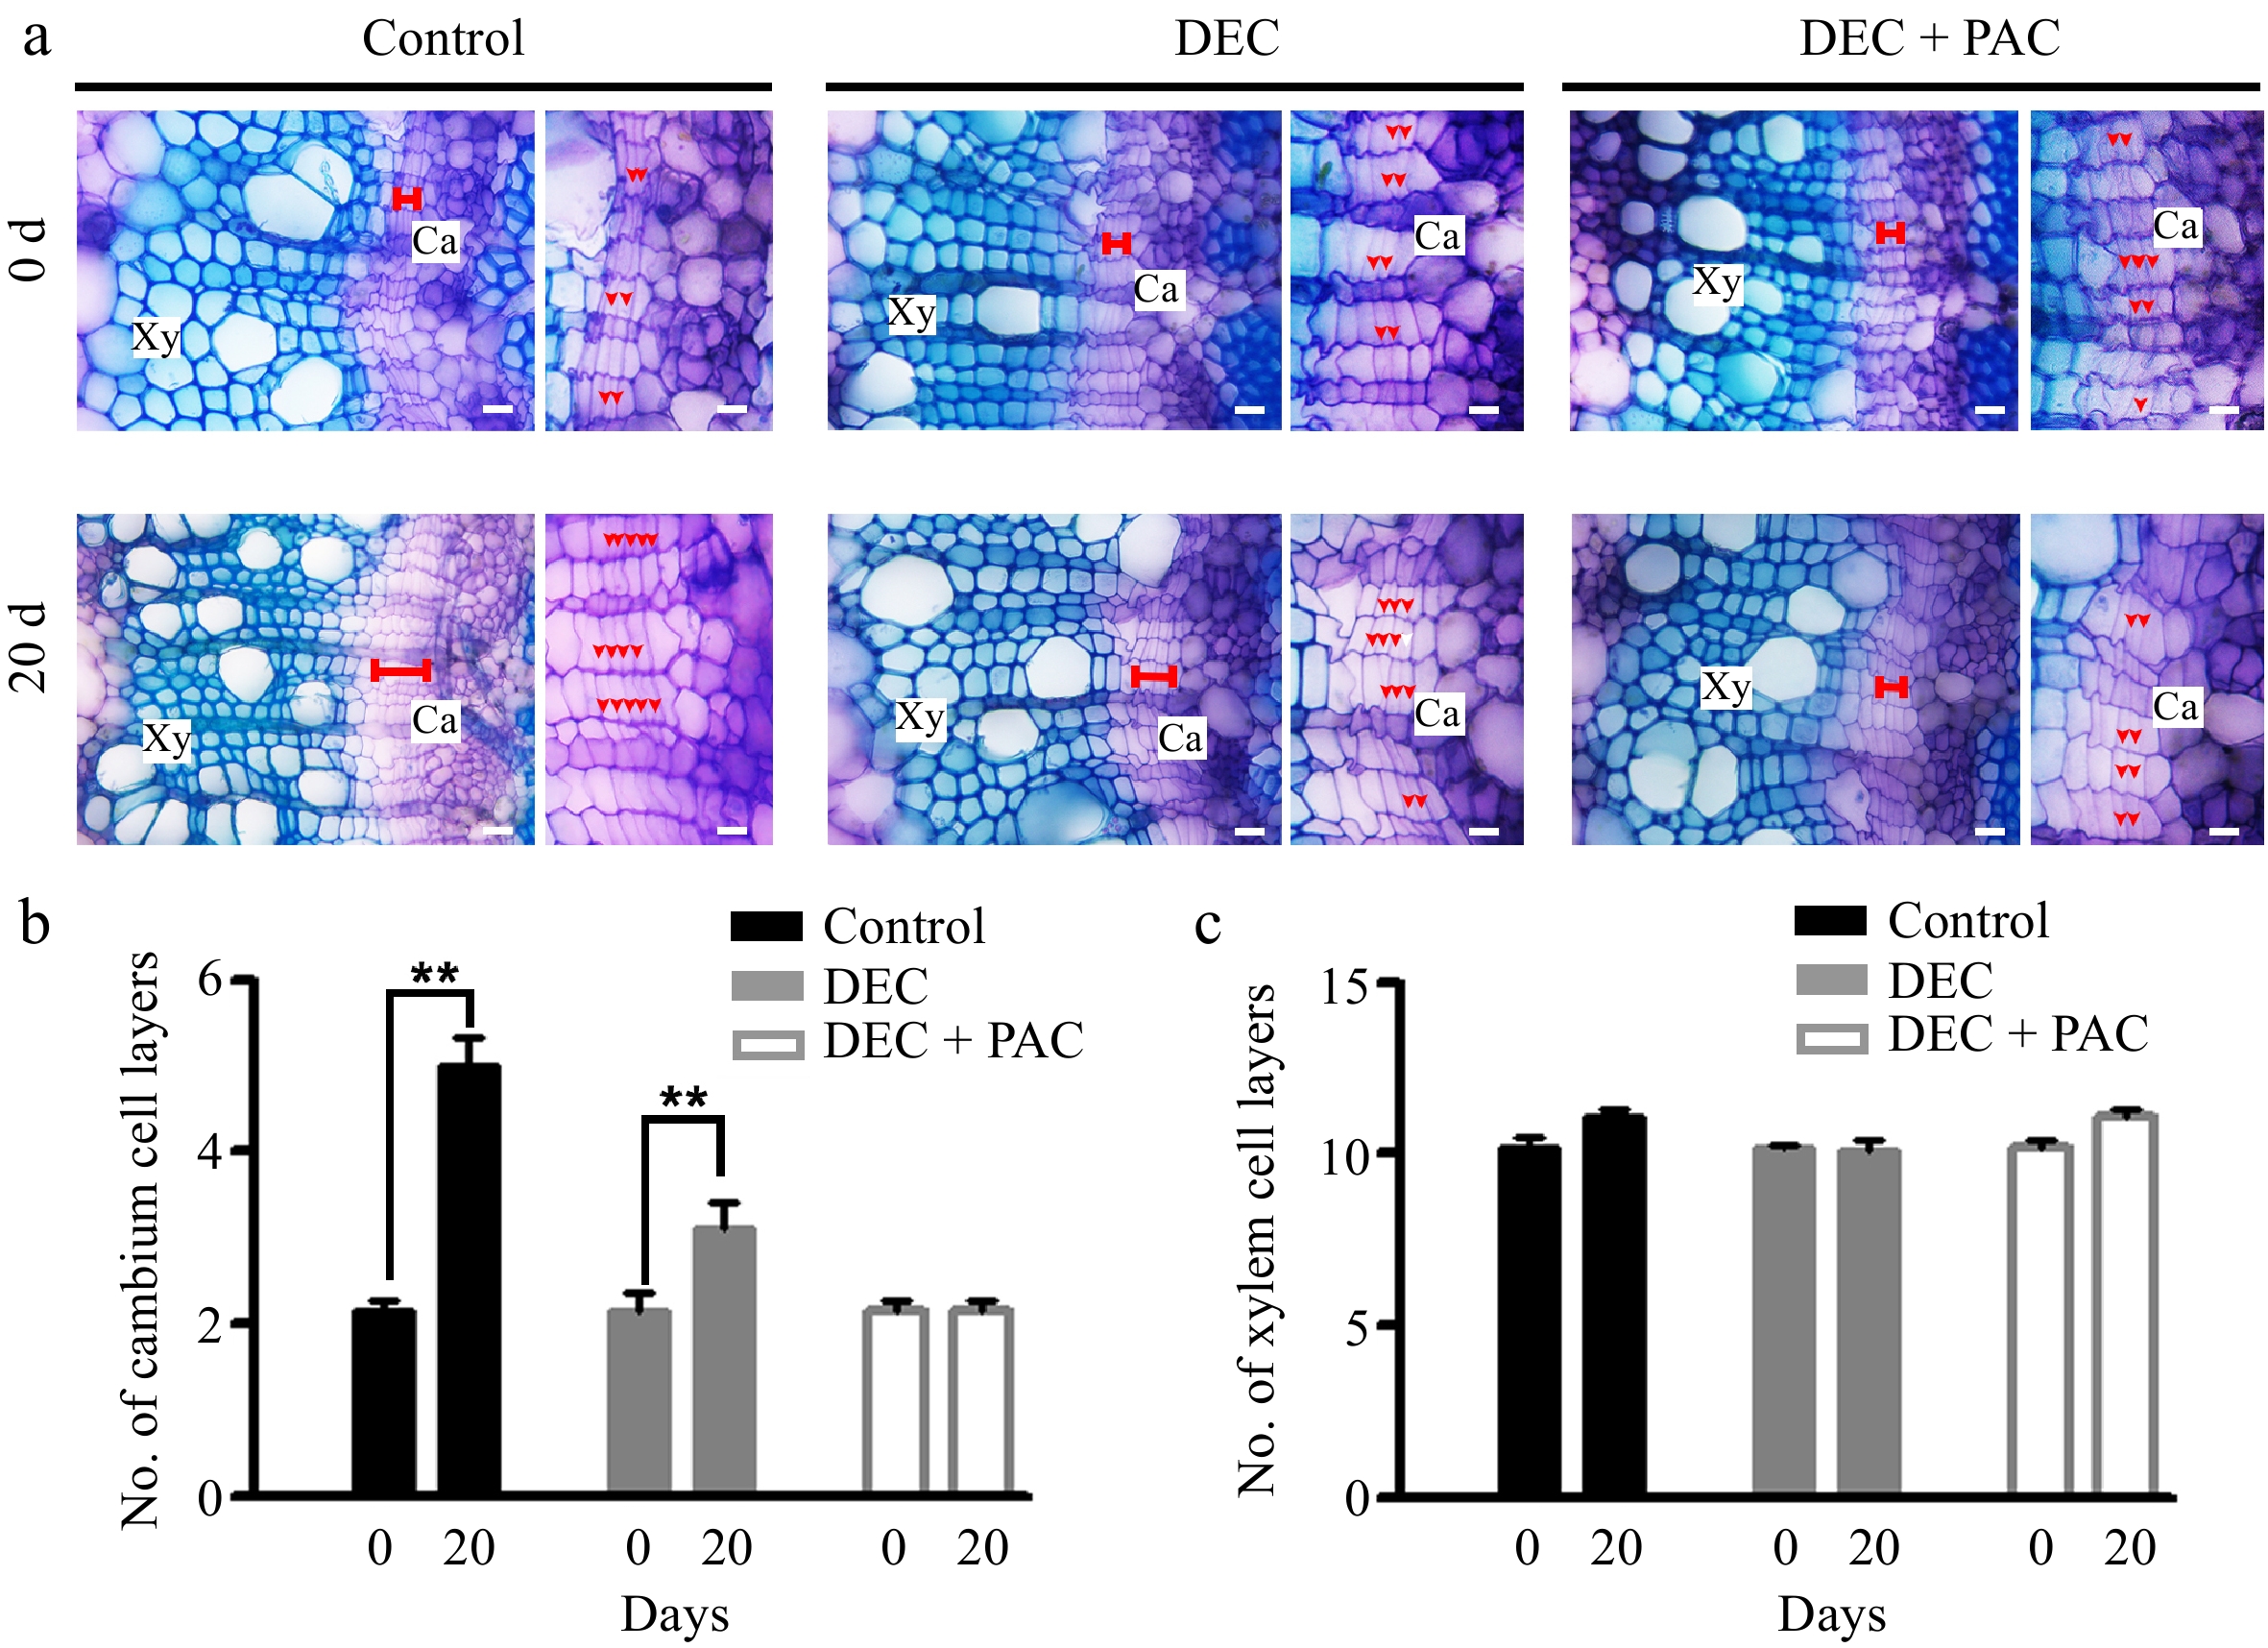
Figure 5.
Locally biosynthesized GAs positively regulated cambial division in proANT-CPS transgenic poplar. (a) Cross-sectional images and toluidine blue staining of 4-week-old proANT-CPS transgenic lines subjected to decapitation and/or paclobutrazol (PAC) treatments. Transgenic plants were grown in WPM medium for 5 and 20 d under decapitation and 10 μM PAC treatments, respectively. Red dots indicate cambium cell layers. Scale bars = 50 μm. (b) Quantification of cambium cell layers in the stems of proANT-CPS transgenic lines after decapitation and/or PAC treatments. (c) Quantification of xylem cell layers in the stems of proANT-CPS transgenic lines following decapitation and/or PAC treatments. DEC, decapitation; PAC, 10 μM paclobutrazol. Error bars represent ± SD. Asterisks indicate significant differences in cambium cell layers after 20 d of decapitation treatment (Student's t-test; **, p < 0.01; n = 3).
-
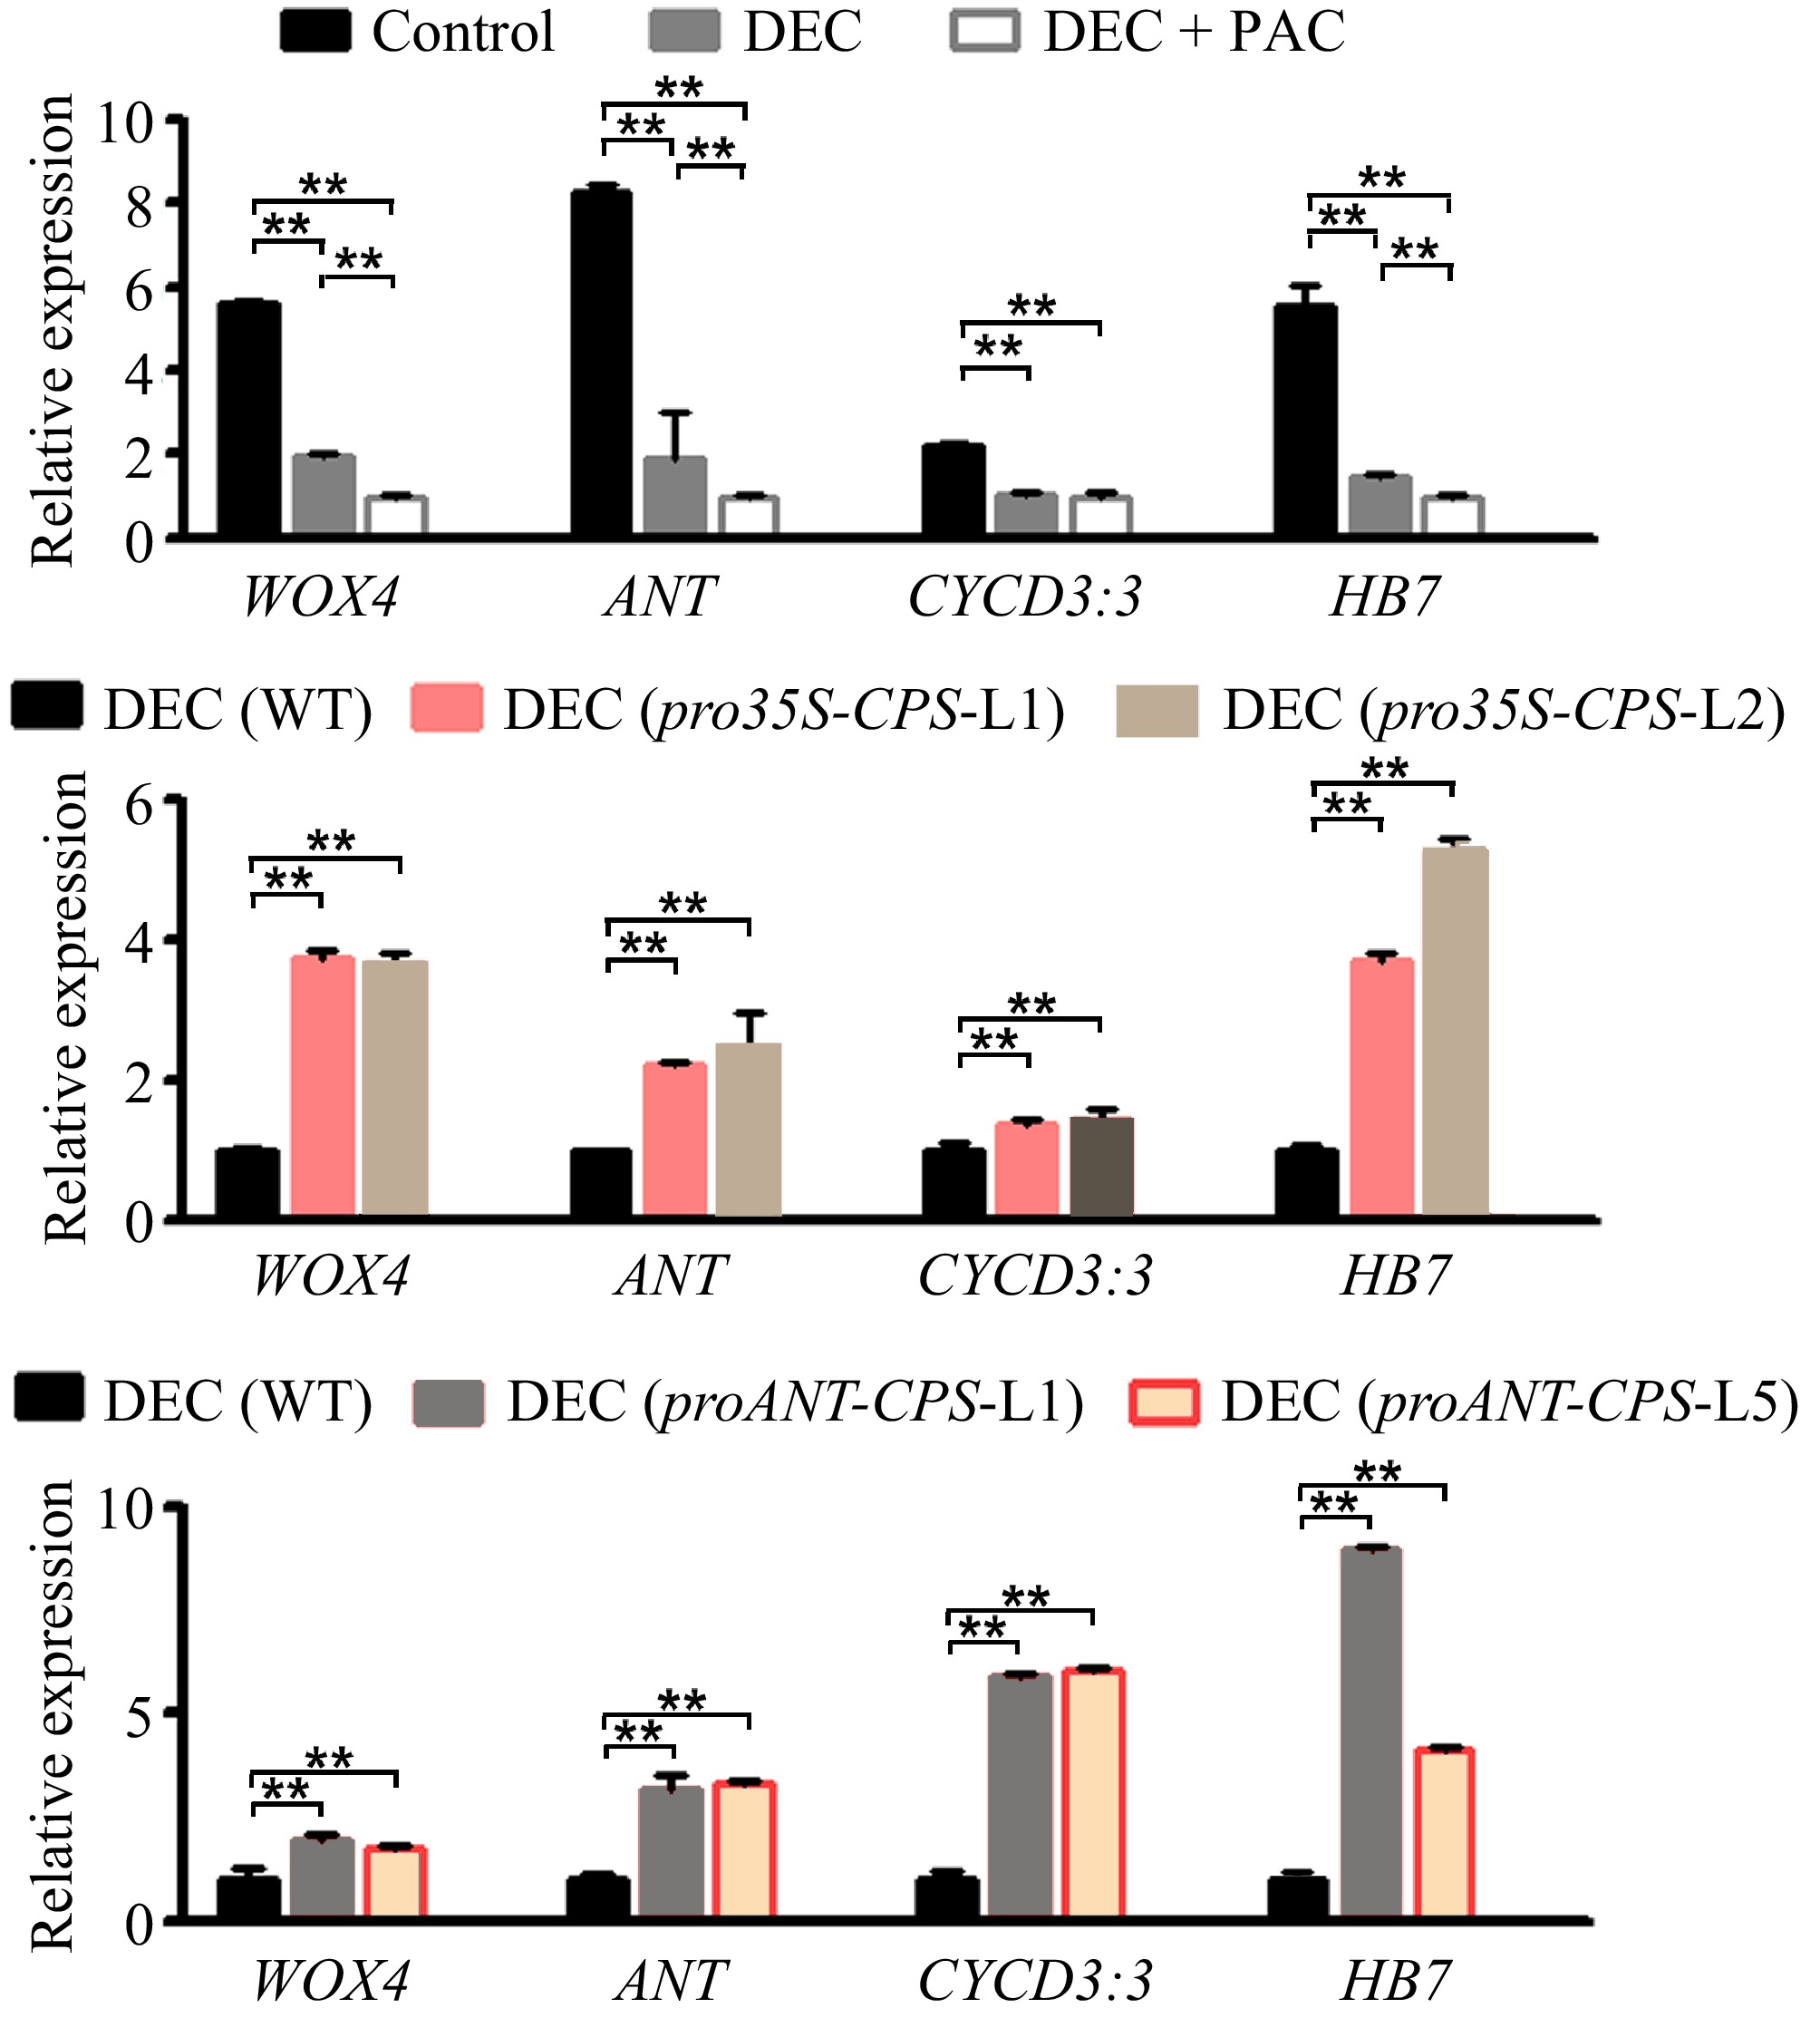
Figure 6.
Expression levels of cambium development-related genes responding to local GA biosynthesis in poplar. (a) Relative expression levels of WOX4, ANT, CYCD3:3, and HB7 in wild-type (WT) plants subjected to decapitation and/or PAC treatments. (b) Relative expression levels of WOX4, ANT, CYCD3:3, and HB7 in WT and pro35S:CPS transgenic lines (L1 and L2) following 20 d of decapitation treatment. (c) Relative expression levels of WOX4, ANT, CYCD3:3, and HB7 in WT and proANT:CPS transgenic lines after 20 d of decapitation treatment. Error bars represent the ± standard deviation (SD). Asterisks indicate statistically significant differences in gene expression levels between WT and each transgenic line, as determined by one-way ANOVA followed by Tukey's test for pairwise comparisons (**, p < 0.01; n = 3). DEC, decapitation; PAC, 10 μM paclobutrazol.
Figures
(6)
Tables
(0)