-
Figure 1.
The MuSCs sorting and the decrease in myogenic characteristics during passaging. (a) Representative contour plots of flow cytometry, showing gating strategies for cell type purification. (b) Immunofluorescence staining of PAX7 (red) in unsorted and newly sorted cells (left); DAPI-stained cell nuclei (blue); Scale bar = 100 μm; Positive cell percentage (right). (c) qPCR analysis of PAX7 expression in P1 and P5 porcine MuSCs. (d) Immunofluorescence staining of MYHC (red) after induced differentiation of P1 and P5 MuSCs; DAPI-stained cell nuclei (blue); Scale bar = 100 μm. (e) Myotube fusion rate. p-value: ** < 0.01, *** < 0.001.
-
Figure 2.
Probing porcine muscle tissue cells using flow cytometry and assessing specific markers. (a) Representative contour plots from flow cytometry, showcasing gating strategies for cell type purification. (b) Photomicrographs of the purified cell types under brightfield conditions. (c) Immunofluorescence staining for PDGFRα, Pax7, and CNN1 (in red) in the purified cell types, with DAPI-stained cell nuclei (in blue); scale bar = 100 μm. (d)−(f) The percentage of positive cells among the purified cell types. (g)−(i) qPCR analysis of PAX7, CNN1, and PDGFRA expression. (j), (k) Western blot analysis of PAX7, CNN1, and PDGFRA. The relative protein levels of PAX7, CNN1, and PDGFRA were normalized to GAPDH using ImageJ software. Error bars represent the standard deviation (SD). p-value: * < 0.05, ** < 0.01, *** < 0.001, **** < 0.0001.
-
Figure 3.
Transcriptome analysis of three types of cells. (a) PCA of RNA-seq using all gene read counts. N = 3 cell lines per group. (b) Heatmap of different cell type markers across the three populations. (c) Expression levels of ITGA5 and ITGA7 in the three cell types. (d) Gene Set Enrichment Analysis (GSEA) for the cell populations. (e) Venn diagram depicting the intersection of comparisons between Group A and Group B, Group A, and Group C. Fold change > 1, p-value < 0.05. (f) GO analysis of biological processes is based on (e). (g) Enrichment analysis of transcription factors based on (e). Error bars represent the standard deviation (SD). p-value: *** < 0.001, **** < 0.0001. Ns, no statistical significance (p > 0.05).
-
Figure 4.
Differentiation capacity of various cell types. (a) Bright-field images and MYHC immunofluorescence staining of the newly sorted cell populations induced to differentiate for 72 h. Scale bar, 250 μm. (b) Myotube fusion rate. (c) qPCR for MYHC indicating myogenic genes, N = 4. (d) Western blot detection of MYHC protein expression. (e) with quantitative results, N = 3. Error bars indicate the standard deviation (SD). p-value: * < 0.05, *** < 0.001, **** < 0.0001. Ns, no statistical significance (p > 0.05).
-
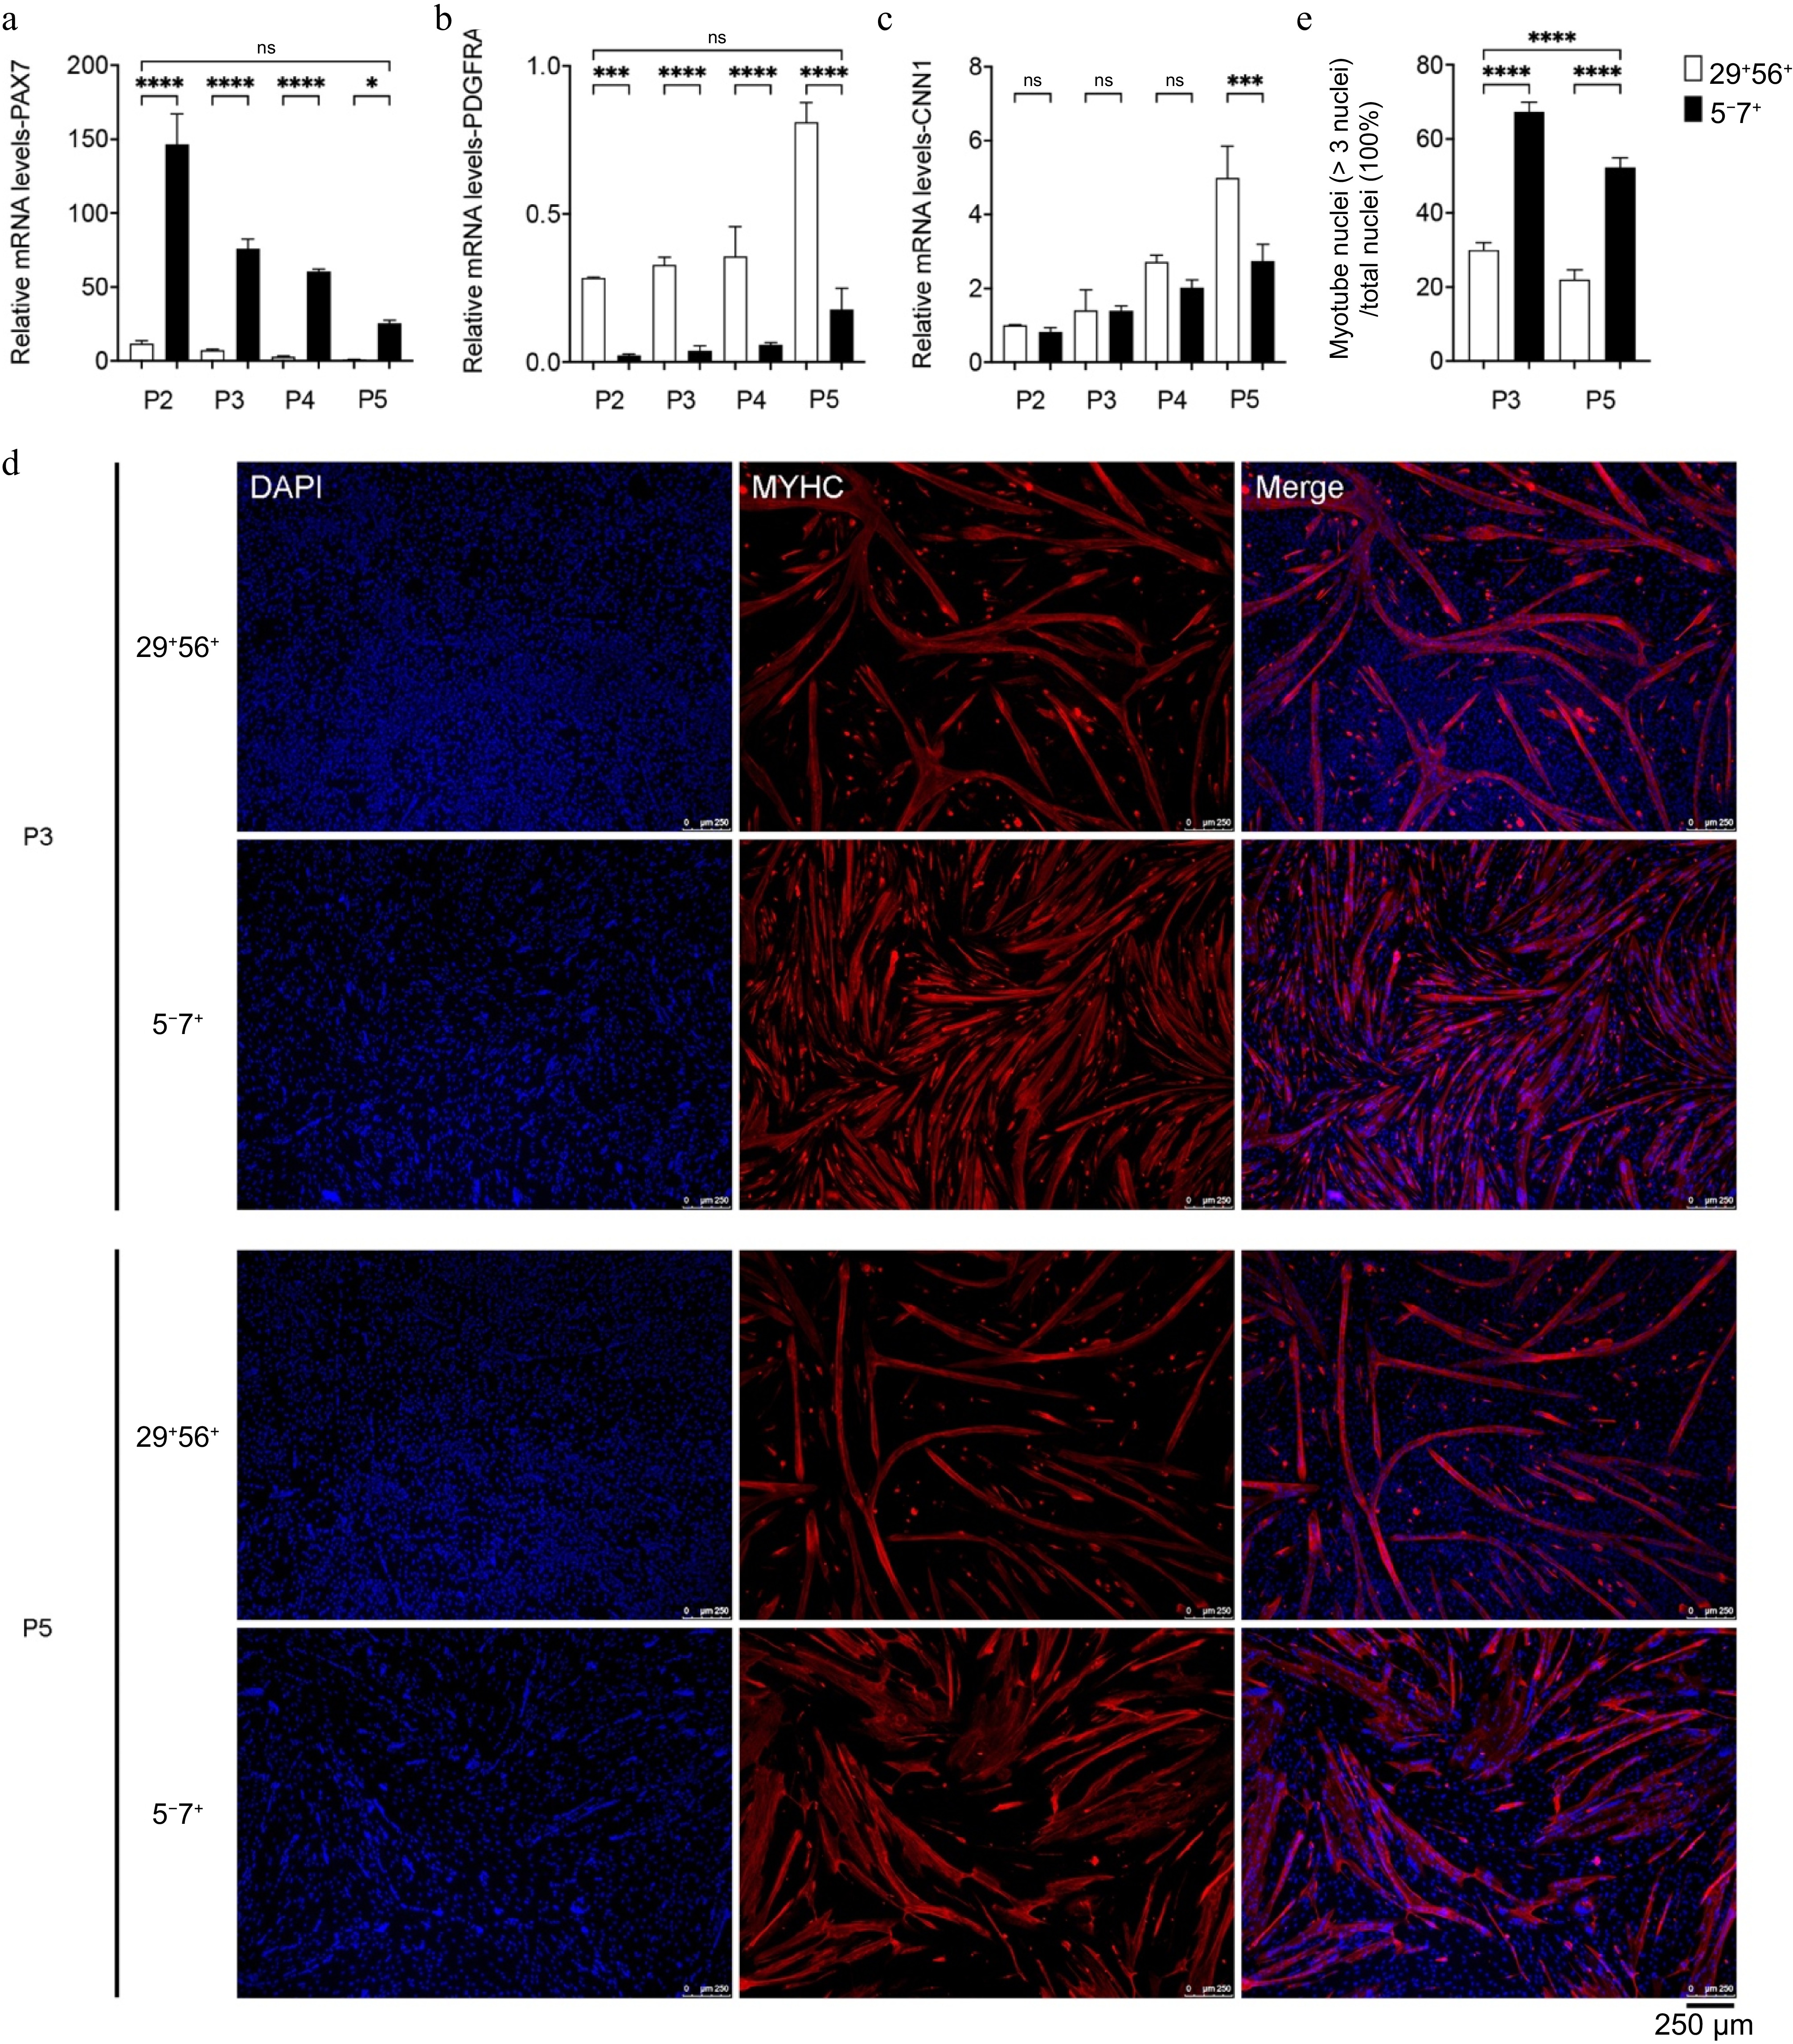
Figure 5.
The impact of passaging on cell purity and myogenic differentiation capacity. (a)−(c) qPCR analysis of the expression of PAX7, CNN1, and PDGFRA. (d) Immunofluorescence staining of MYHC (red) in MuSCs of P3 and P5 after induction of differentiation; DAPI-stained cell nuclei (blue); scale bar = 250 μm. (e) Myotube fusion rate (right). p-value: * < 0.05, *** < 0.001, **** < 0.0001. Ns, no statistical significance (p > 0.05).
-
Gene Primer sequence (5'-3') Accession no. PAX7 Forward GTGCCCTCAGTGAGTTCGATT XM_021095458.1 Reverse TCCAGACGGTTCCCTTTGTC CNN1 Forward CGTGCTATATAAGGGCCGGT XM_013987363.2 Reverse CGTCCATGAAGTTGTTGCCG PDGFRA Forward CCTACATCGGCGTCACCTAC NM_001315756.1 Reverse GGCAGAGGGATGATGTAGCC ITGA5 Forward CTTCAAACGCTCCCTCCCAT XM_001925252.7 Reverse AGCCTCCTCCCTGTCAGTAG ITGA7 Forward AGACGGCTTCCCAGACATTG XM_021091233.1 Reverse AATGGTTCCCATCCACGTCC MYOG Forward AACCCCACTTCTATGACGGG NM_001012406.1 Reverse TTATCTTCCAGGGGCACTCG MYHC Forward CCGTGCTCCGTCTTCTTTCC NM_001104951.2 Reverse CGCTCCTTCTCTGACTTGCG GAPDH Forward GTCGGAGTGAACGGATTTGGC NM_001206359.1 Reverse CTTGCCGTGGGTGGAATCAT Table 1.
Primers for qPCR analysis.
Figures
(5)
Tables
(1)