-
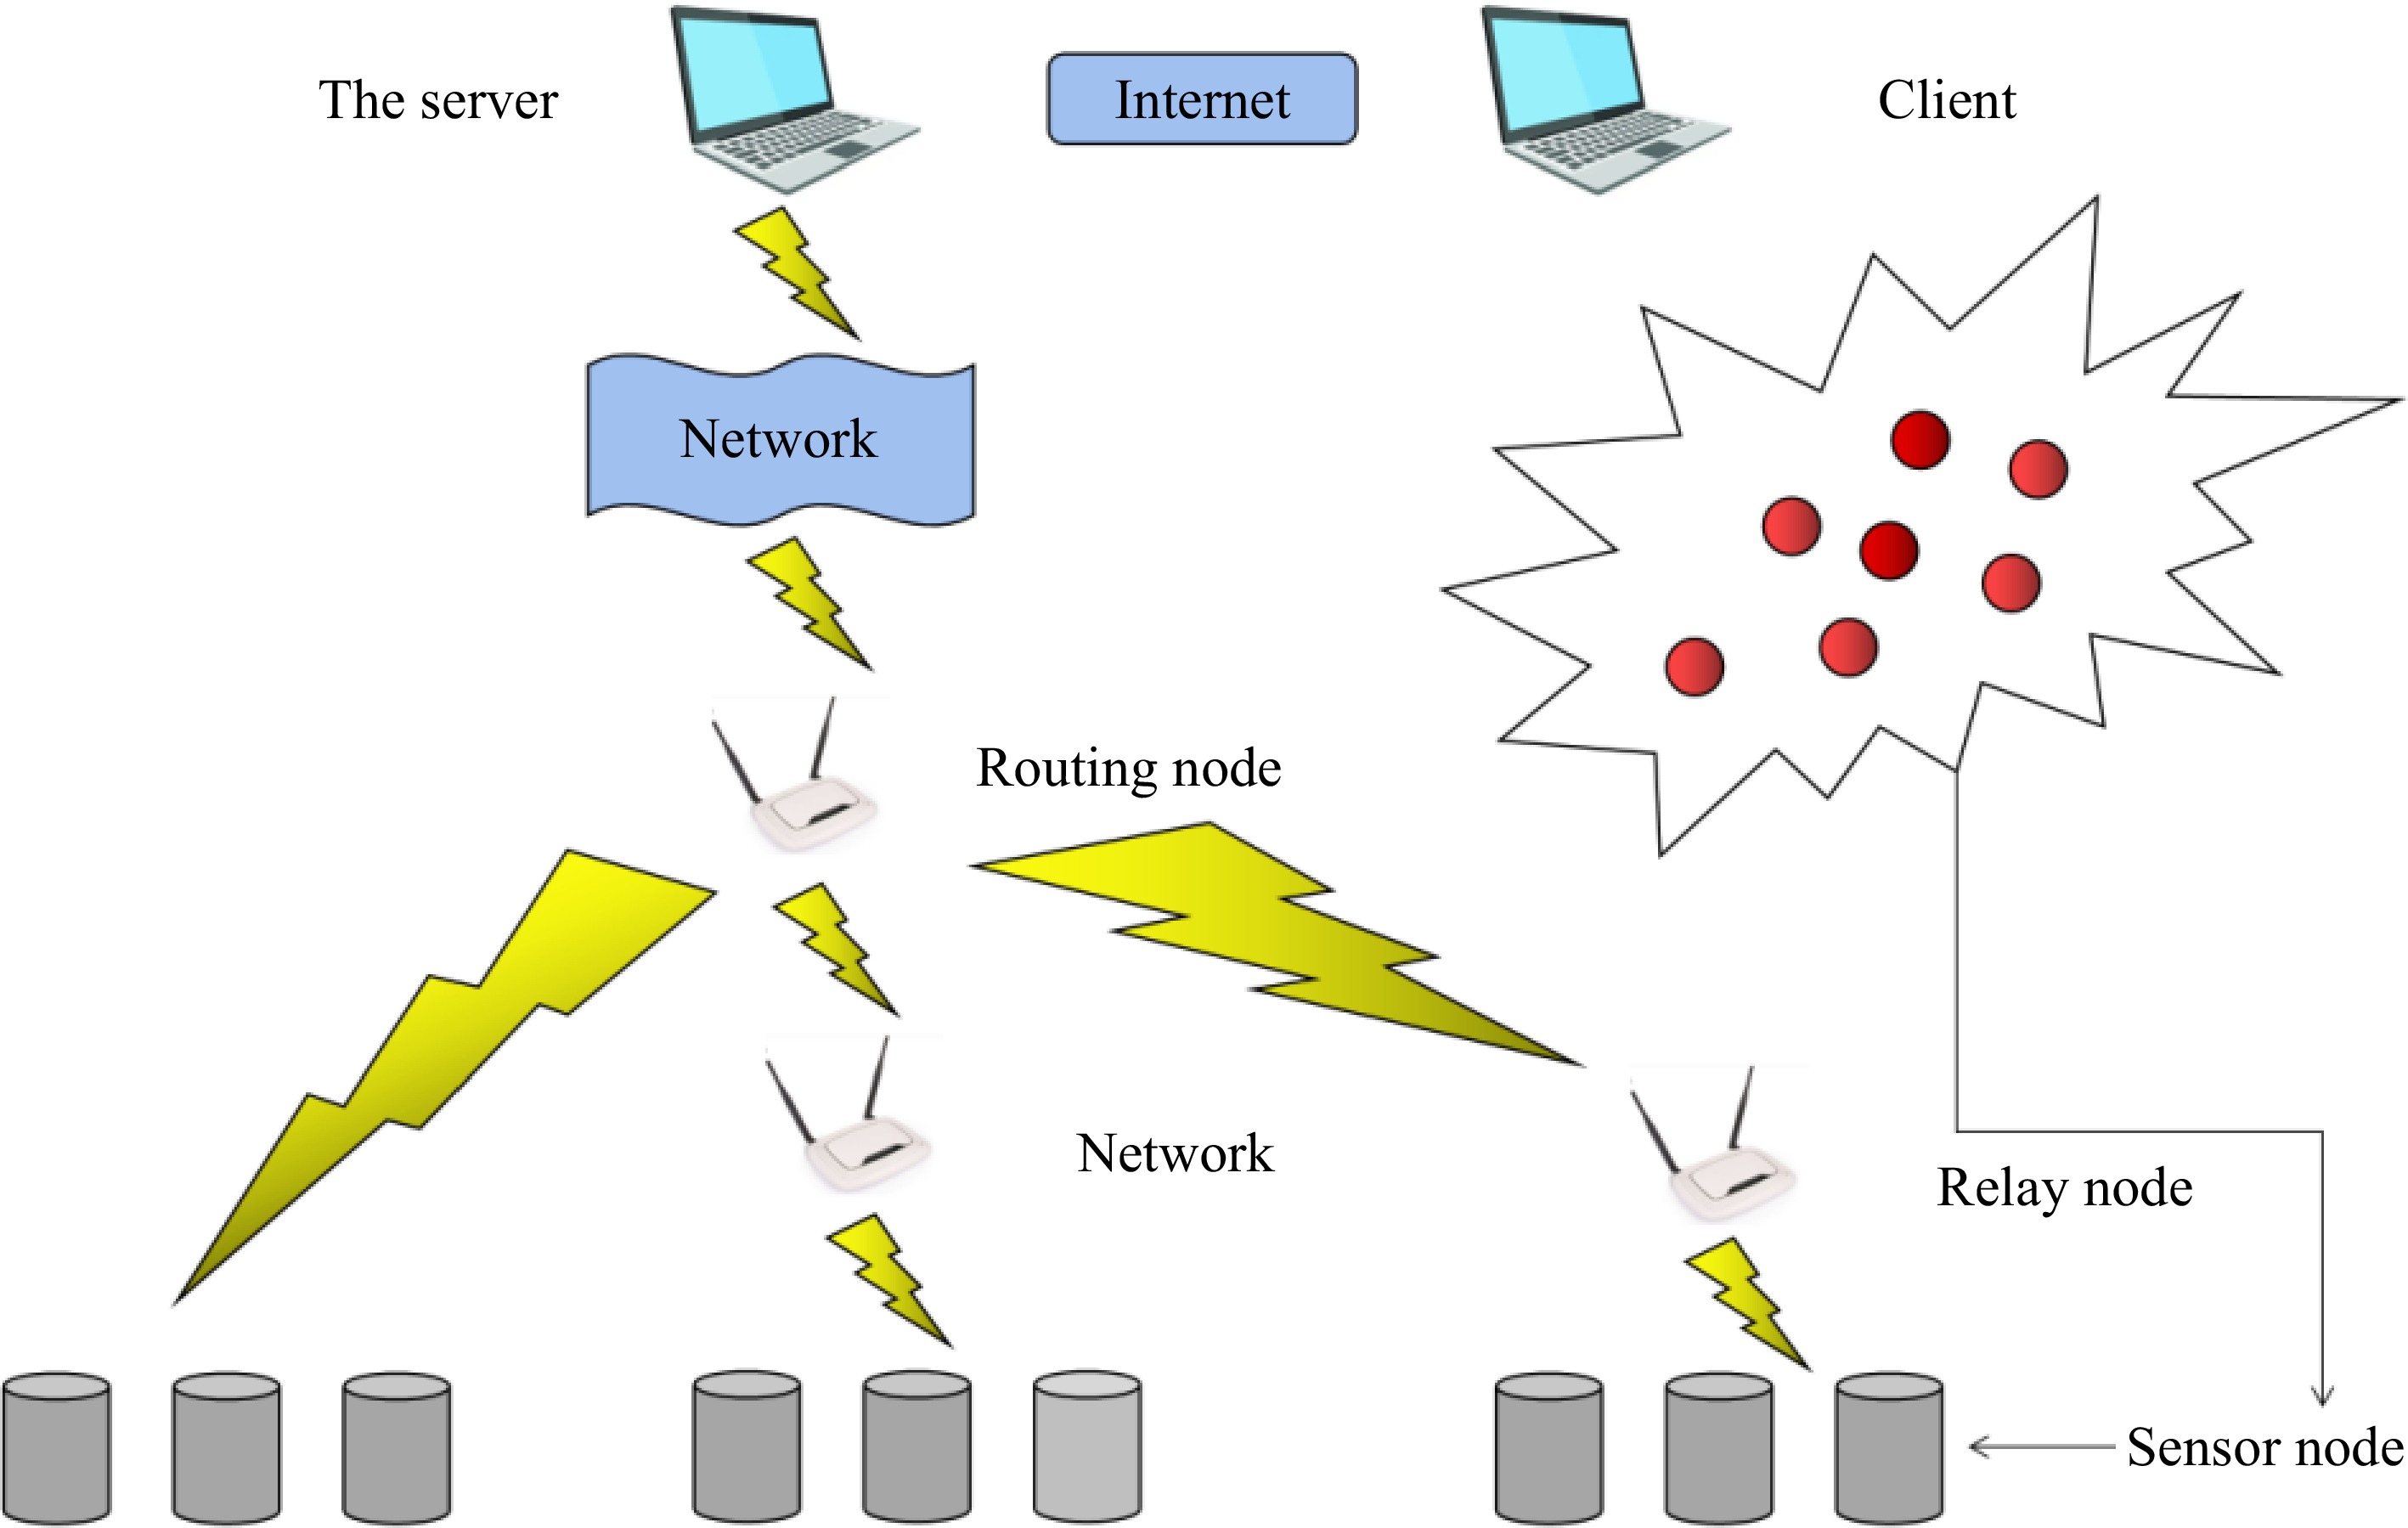
Figure 1.
Structure diagram of self-powered wireless sensor network monitoring system.
-
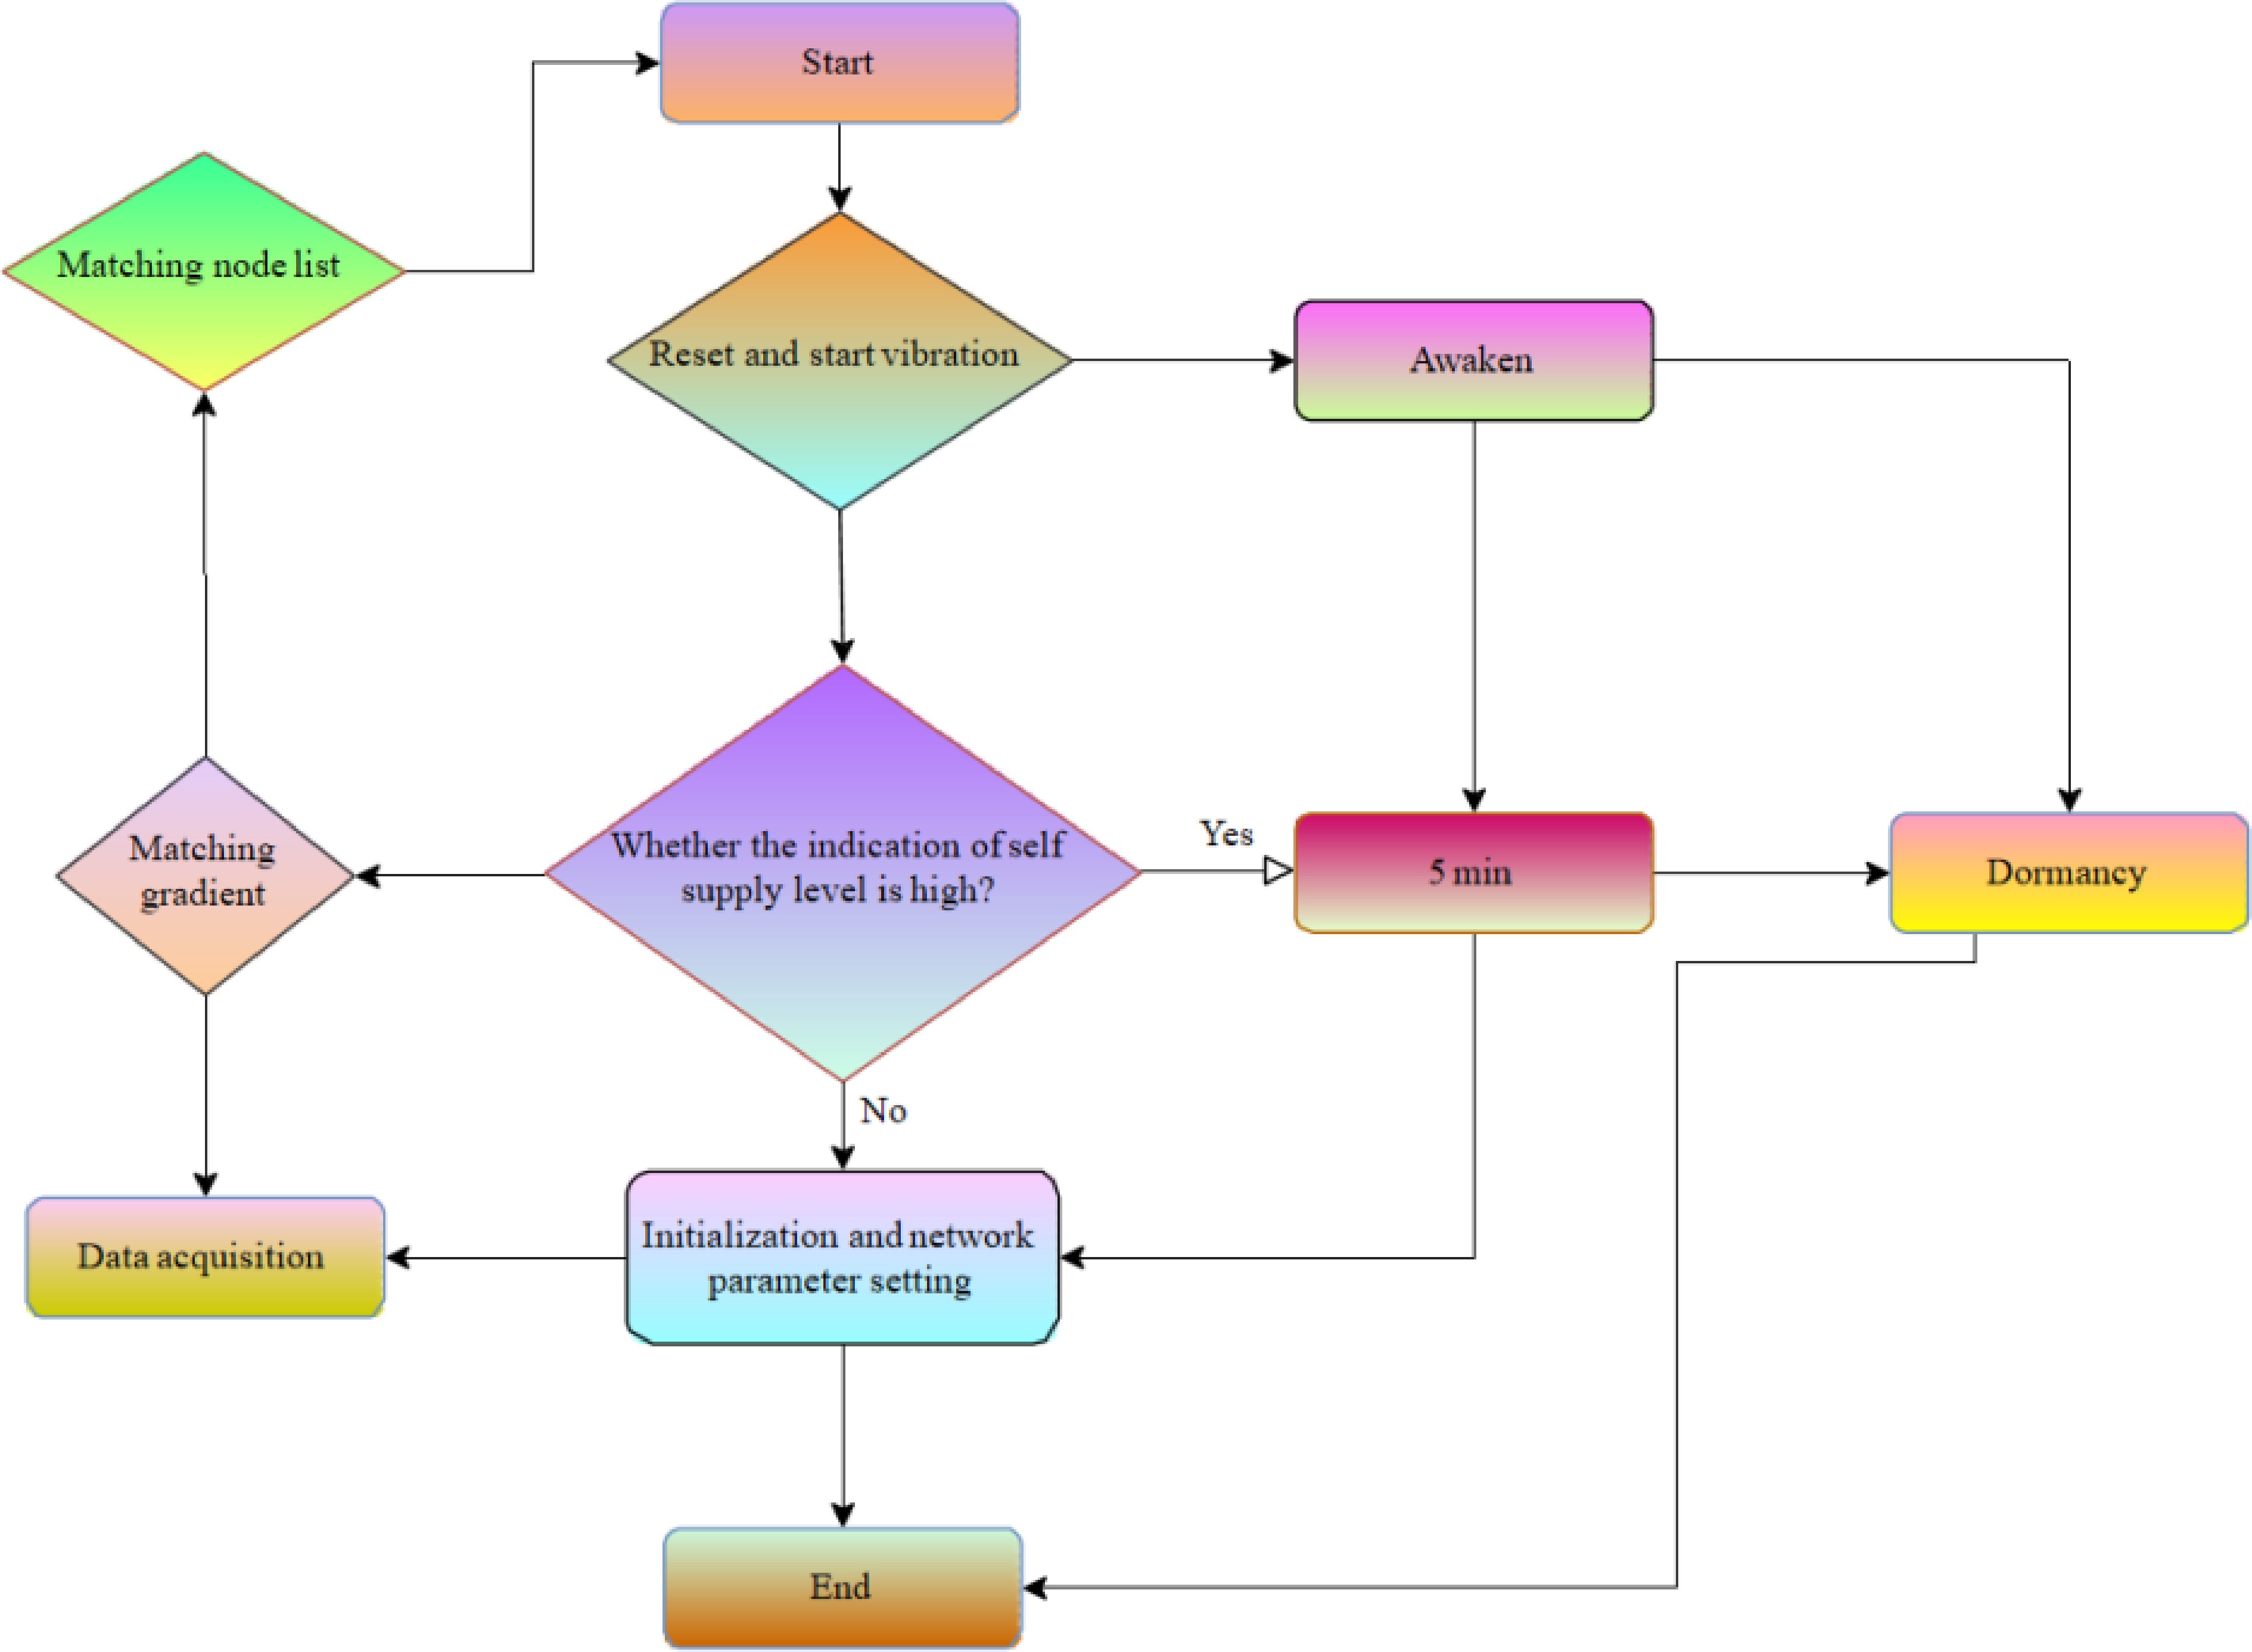
Figure 2.
Flow chart of the sensor node.
-
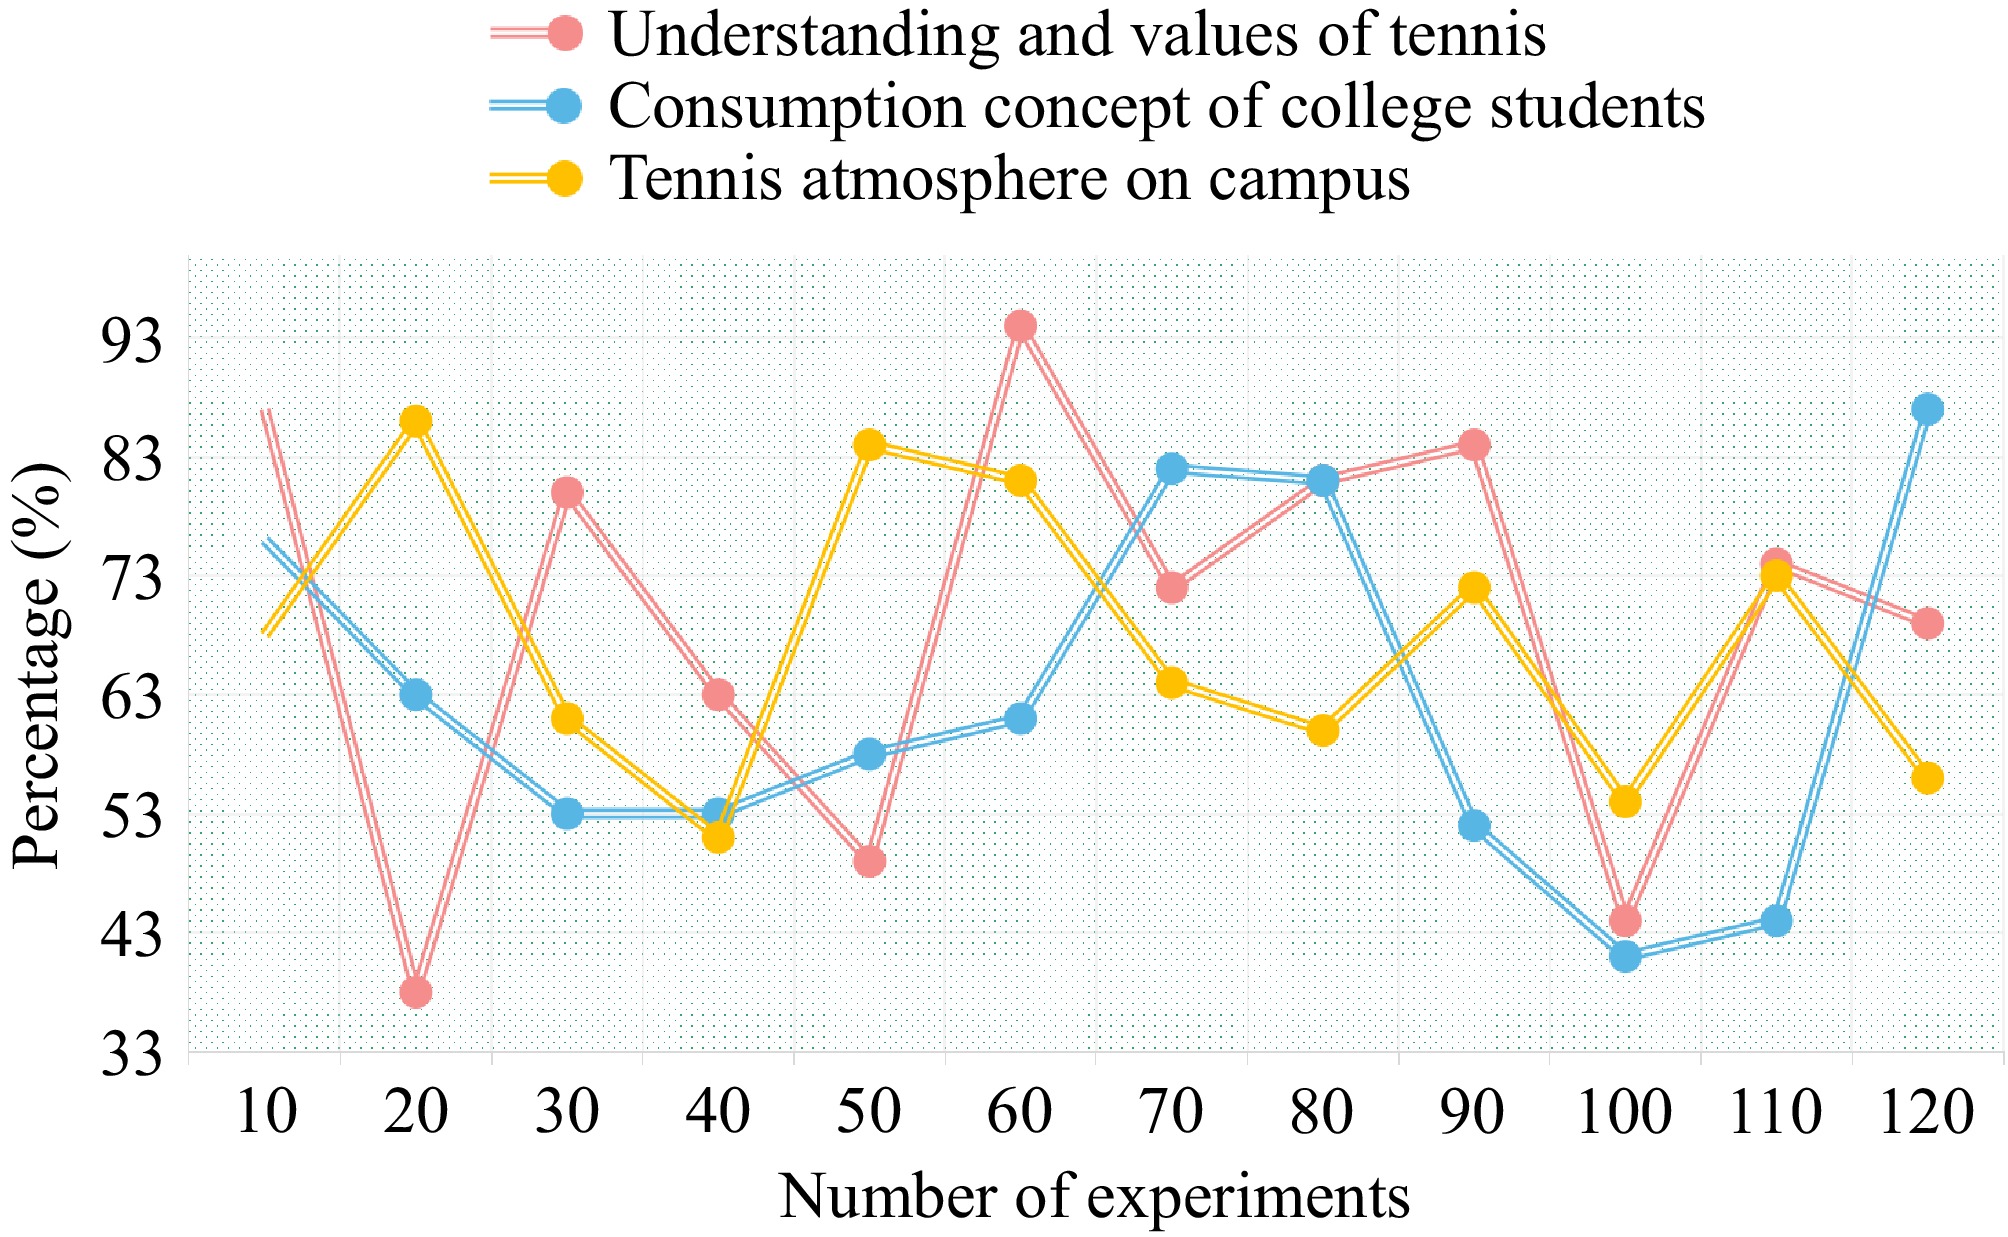
Figure 3.
Main factors affecting the development of tennis in colleges and universities.
-
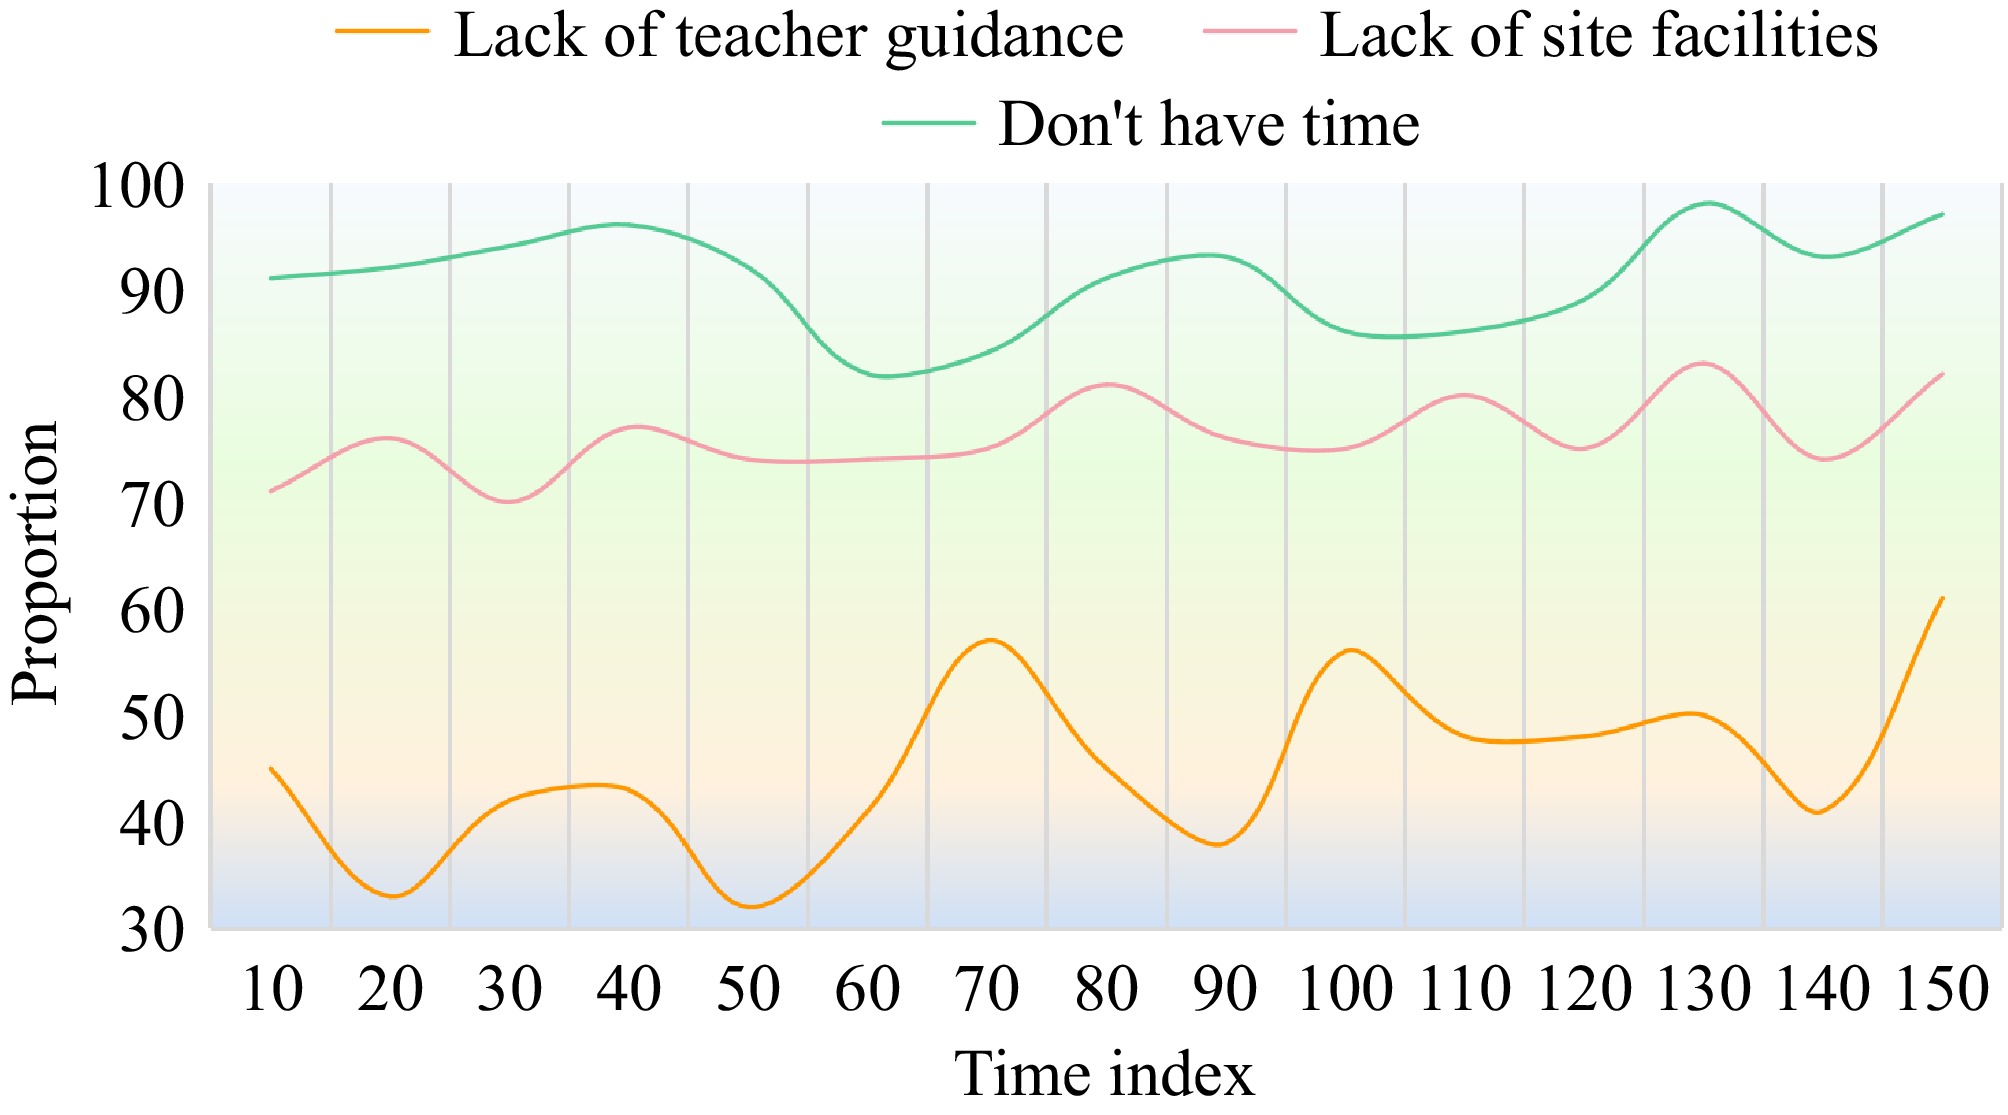
Figure 4.
Changes in the proportion of reasons for not playing tennis.
-
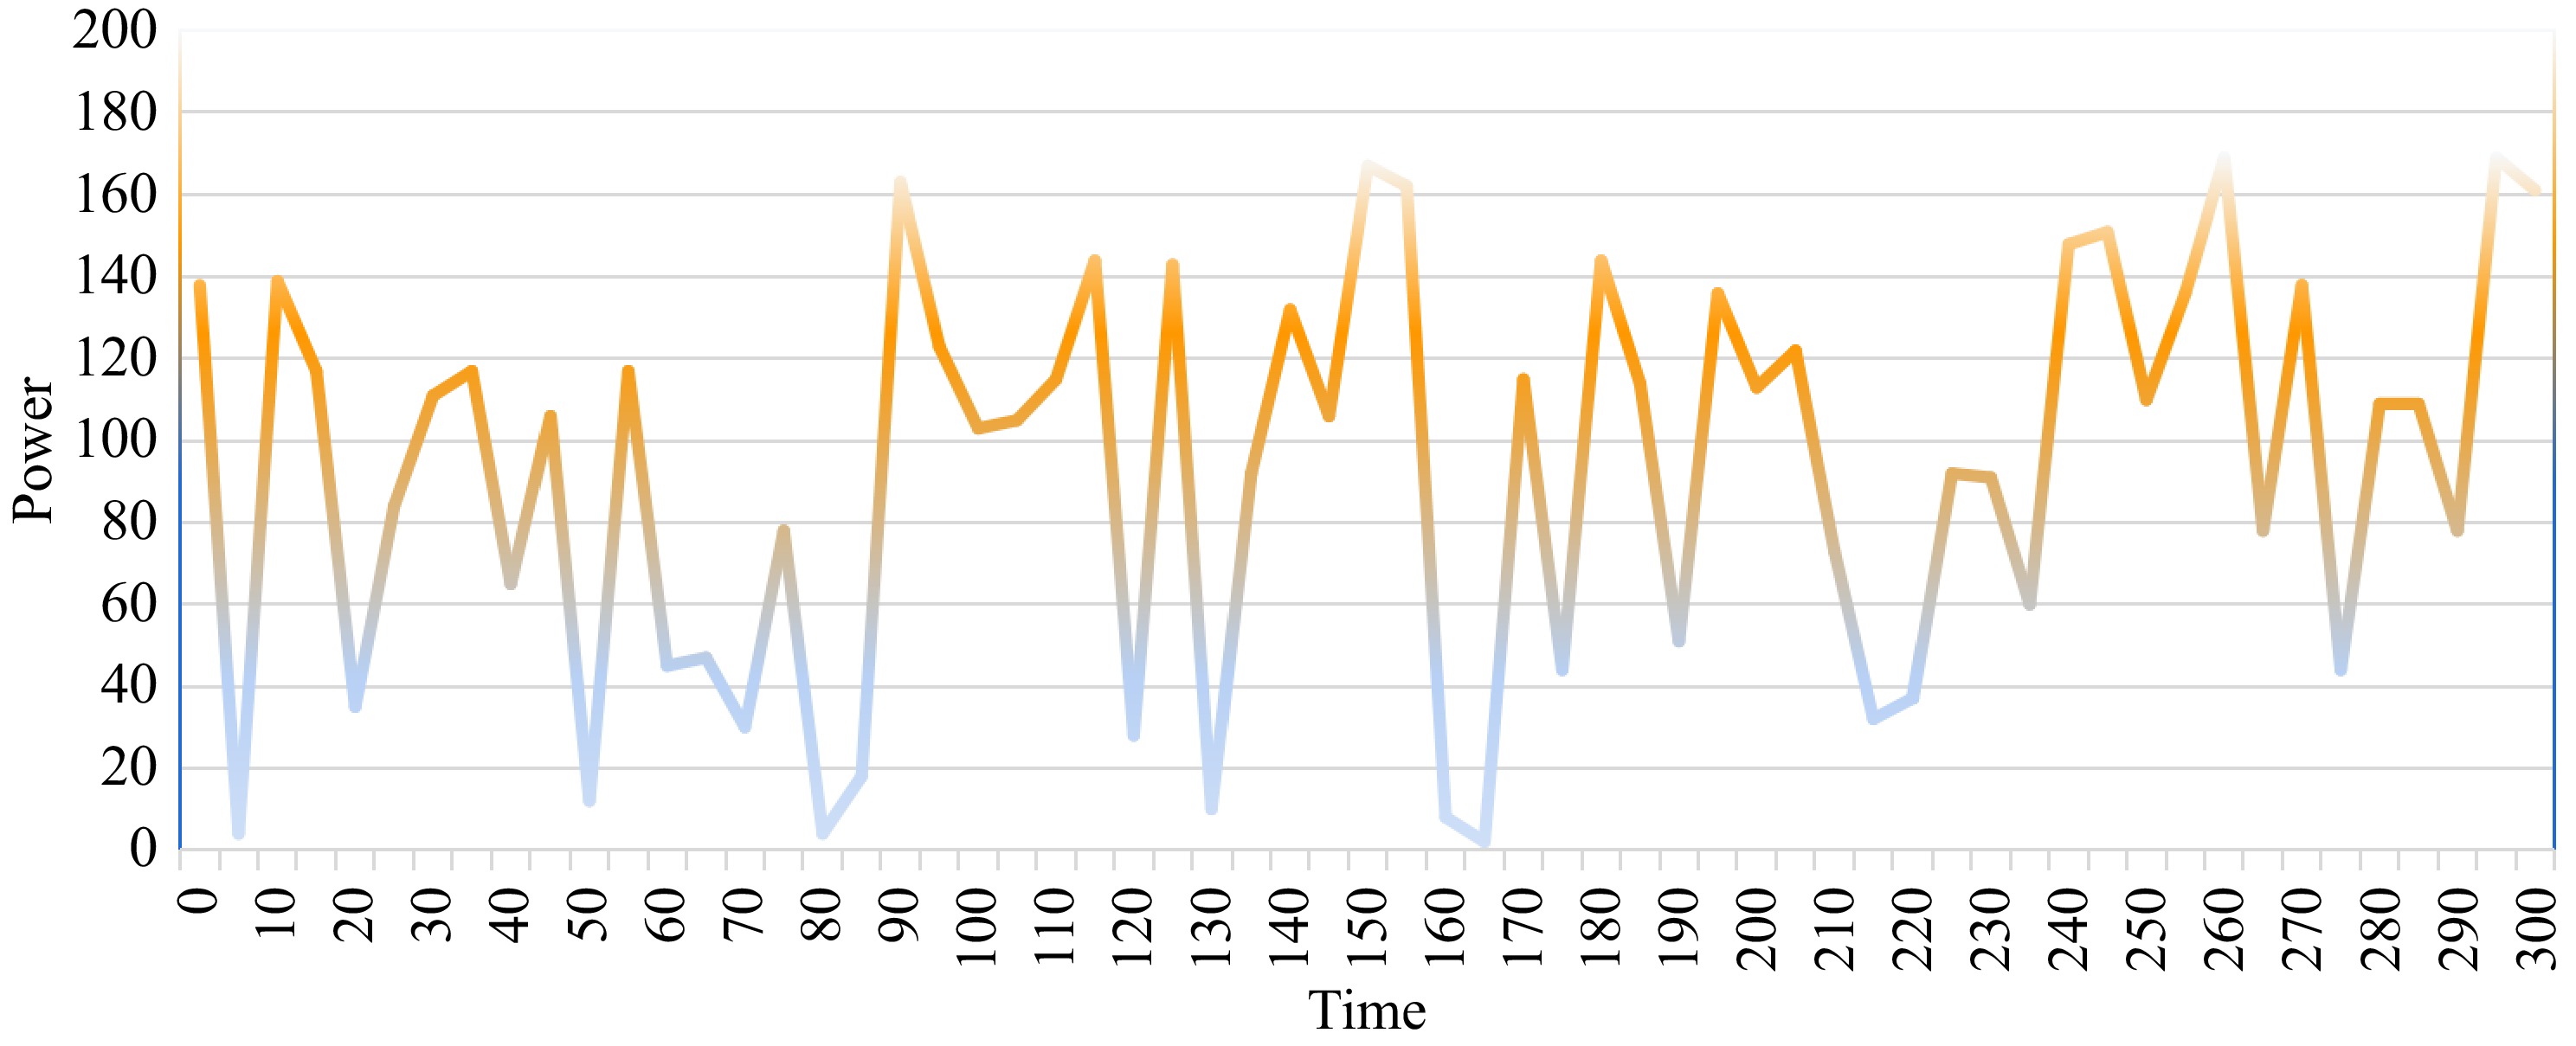
Figure 5.
Energy collection rate of solar nodes over time in one day.
-
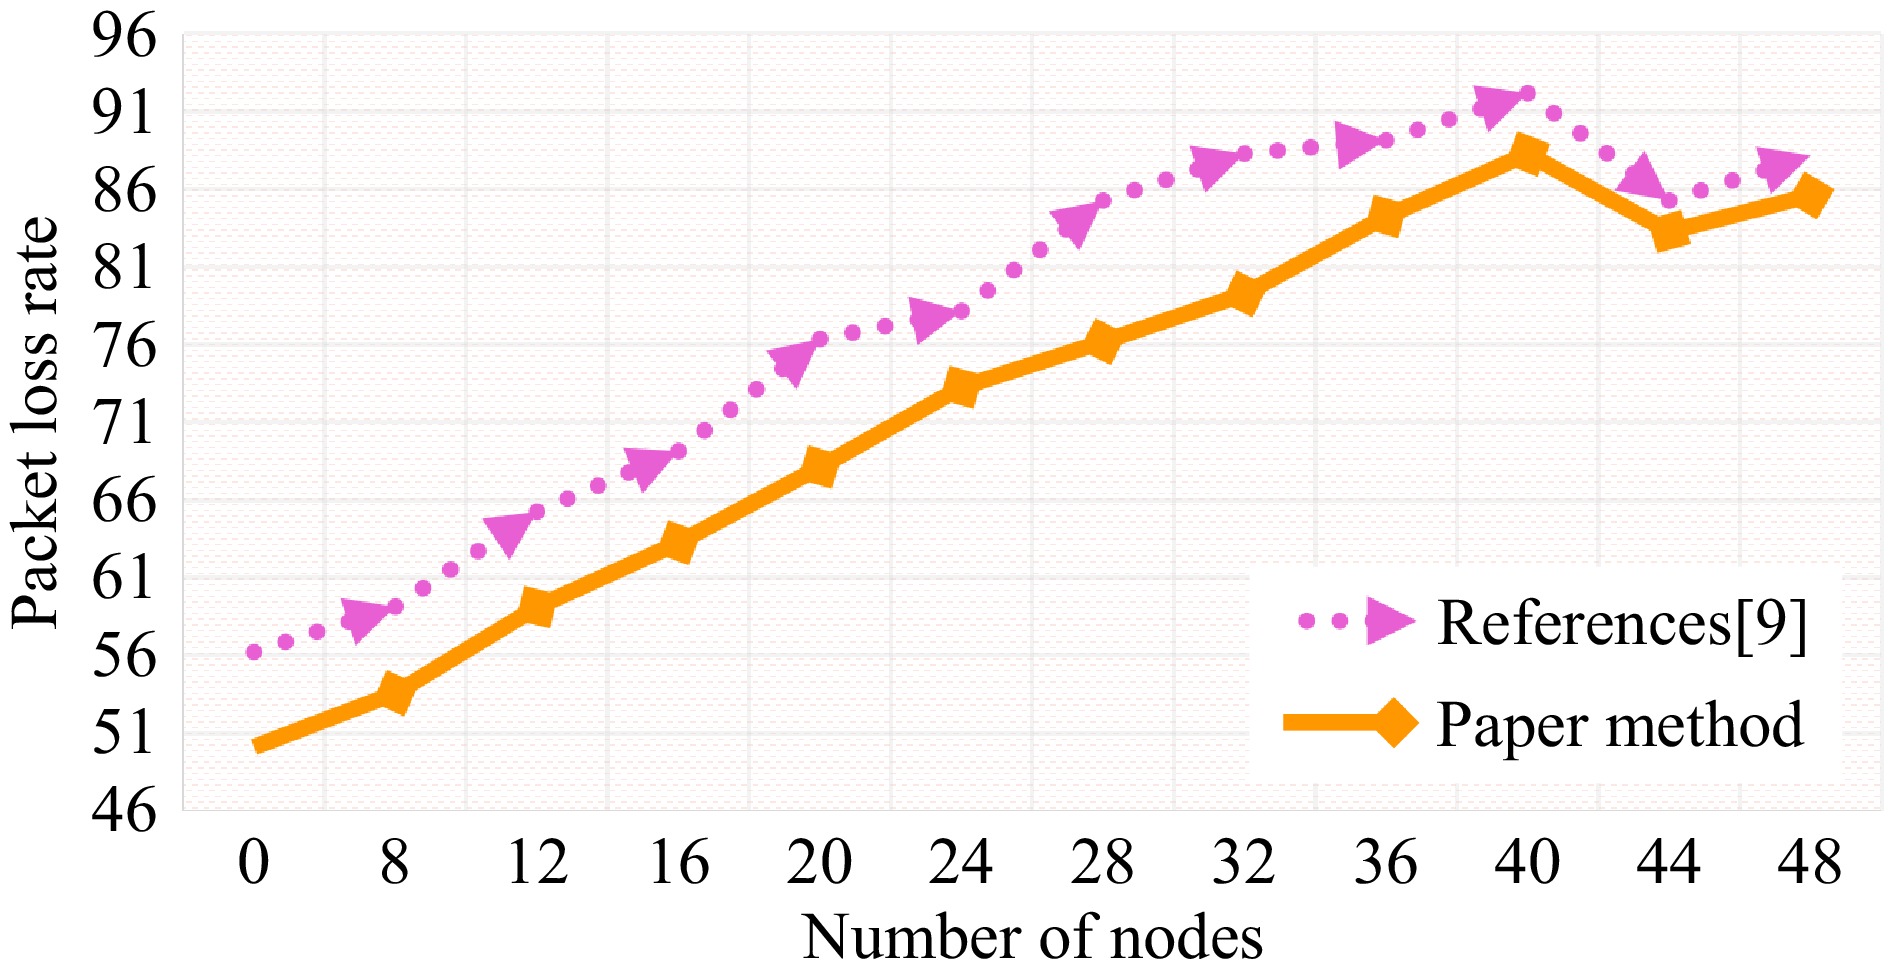
Figure 6.
Comparison of packet loss rate.
-
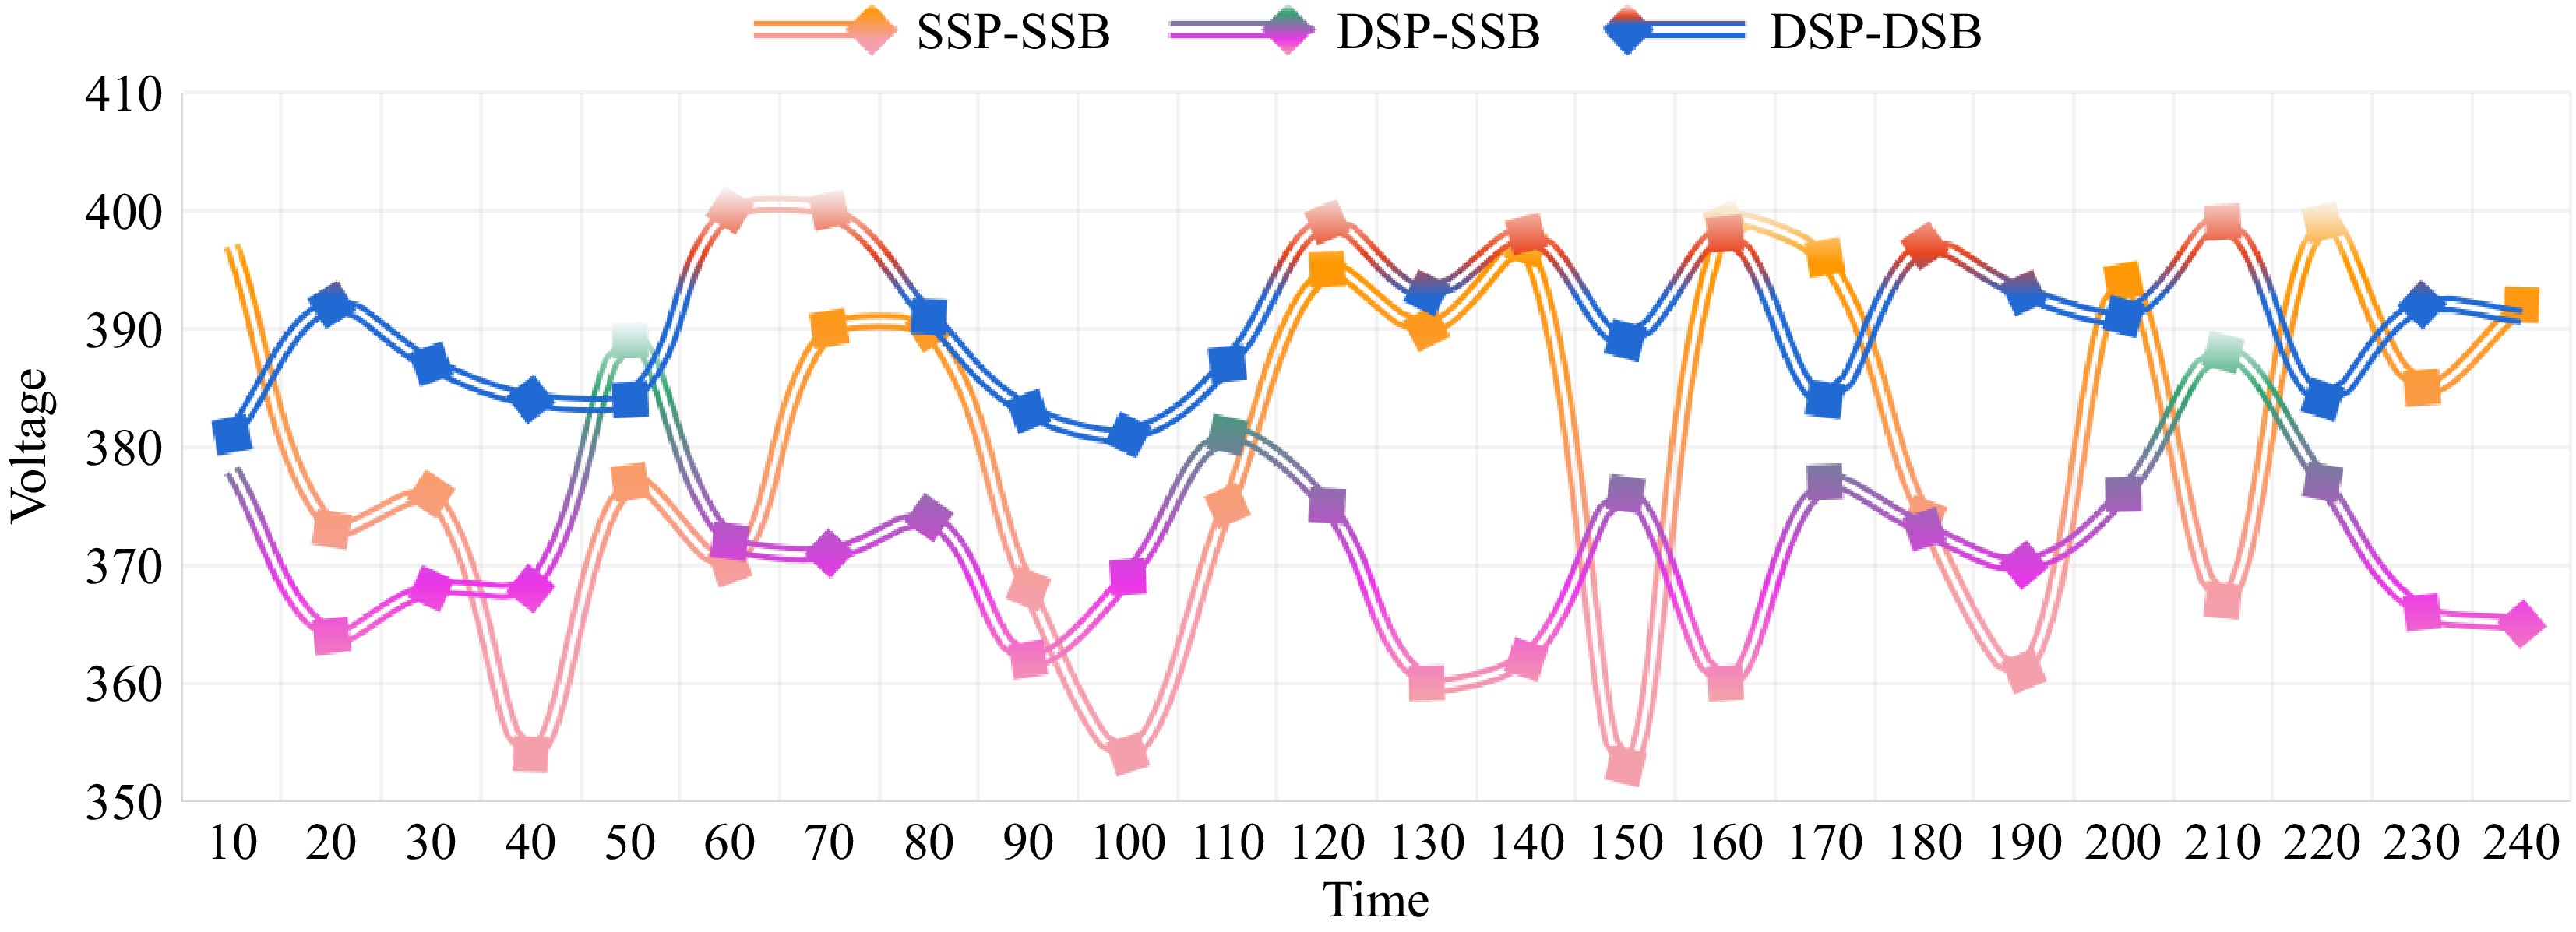
Figure 7.
Monitoring chart of charge and discharge of battery pack.
-
Serial number Information source Percentage 1 TV news 57% 2 Teachers and classmates 45% 3 Network 37% 4 Advertising 27% Table 1.
Information sources of tennis knowledge of college students.
-
Serial number Influencing factor Percentage 1 Site facilities 76.2% 2 Campus tennis culture atmosphere 51.3% 3 Tennis organization and management 38.4% 4 College students' sports consumption consciousness 28.2% Table 2.
Influencing factors of college students' participation in tennis.
-
Number of tennis courts Percentage of colleges and universities > 8 21.5% 4−8 51.3% < 4 27.3% Table 3.
Tennis courts owned by a school.
-
Hourly charge (CNY) Percentage < 10 10.7% 10−20 46.4% 20−40 28.7% > 40 13.8% Table 4.
Tennis court charges of a school.
Figures
(7)
Tables
(4)