-
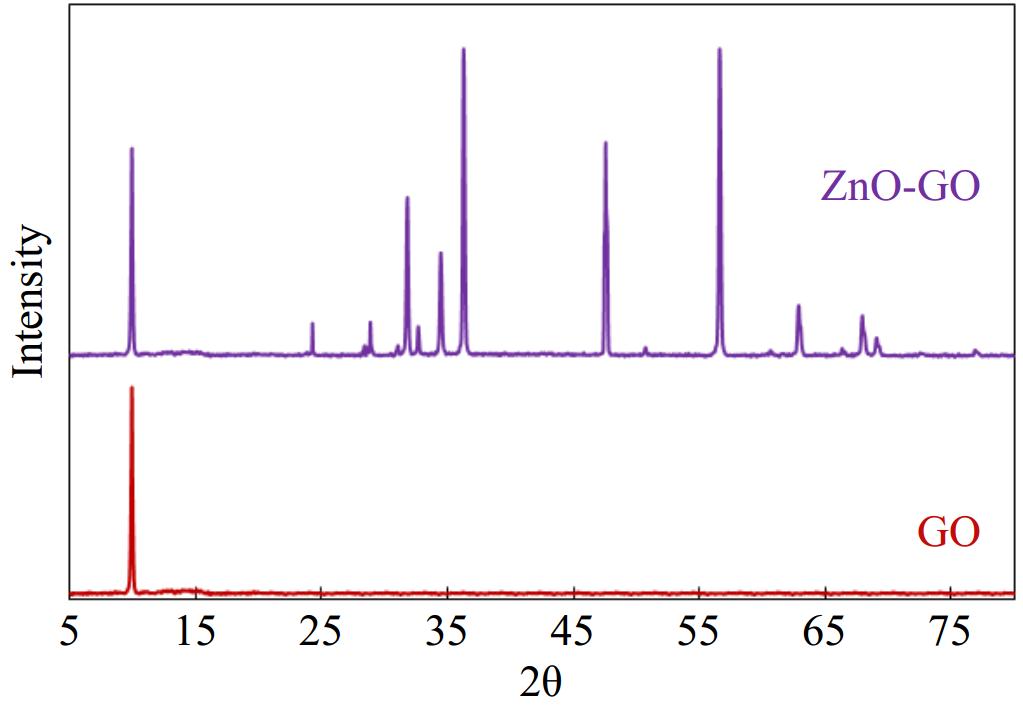
Figure 1.
XRD analysis.
-
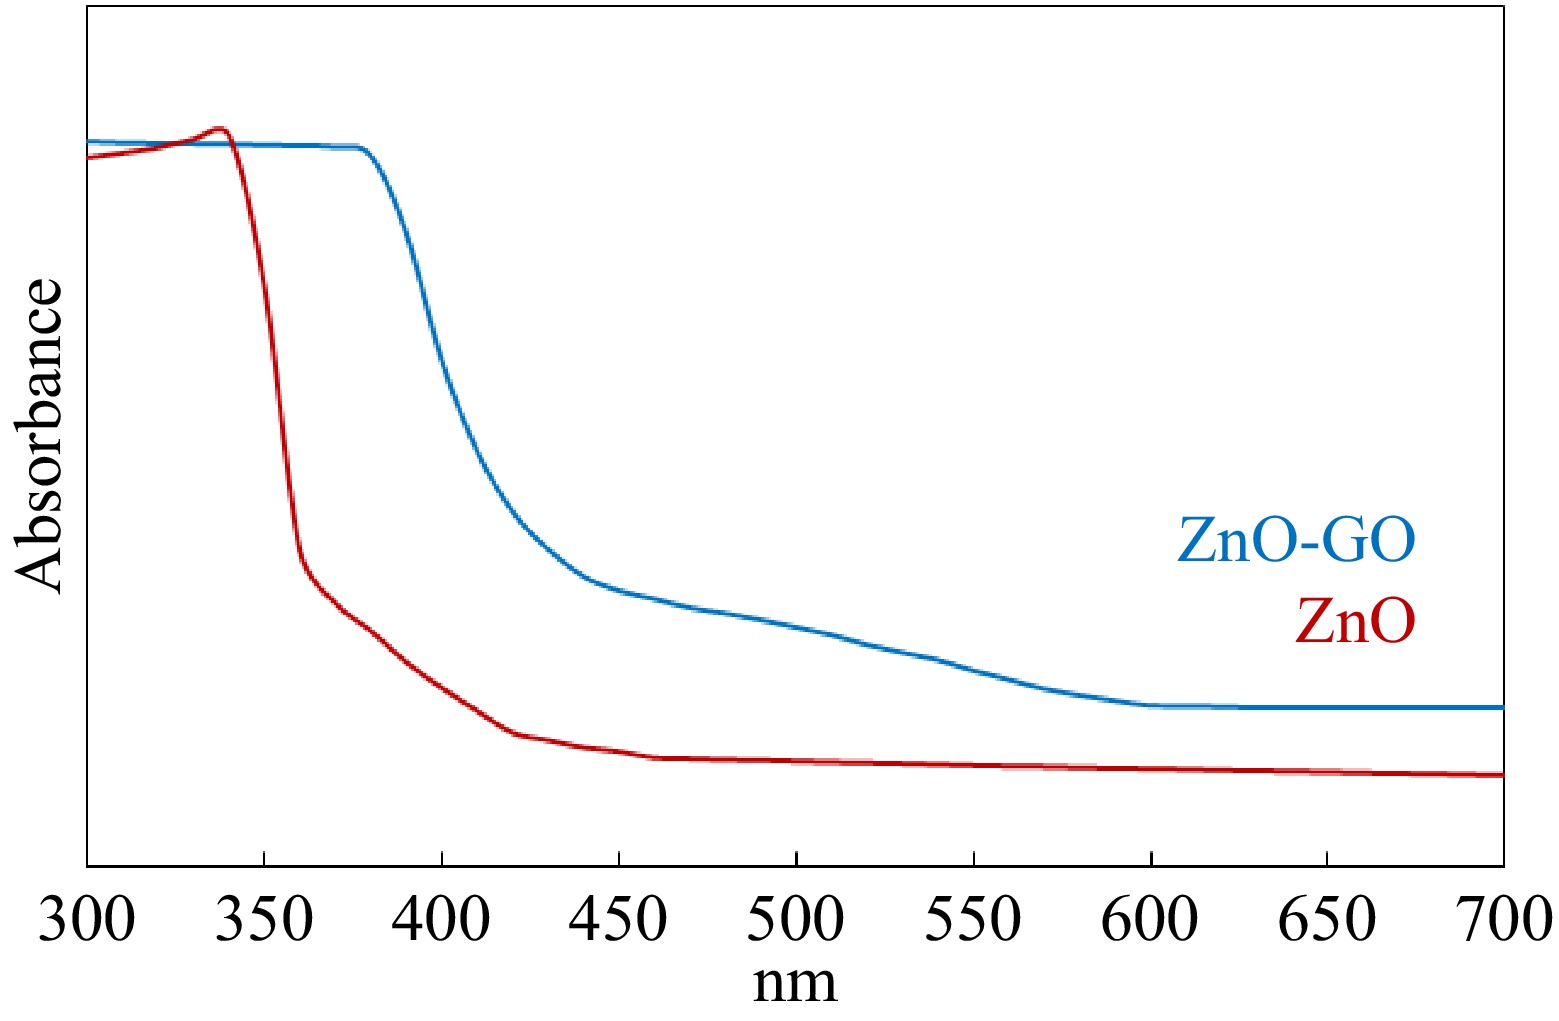
Figure 2.
DR-UV visible spectra of ZnO and ZnO-GO.
-
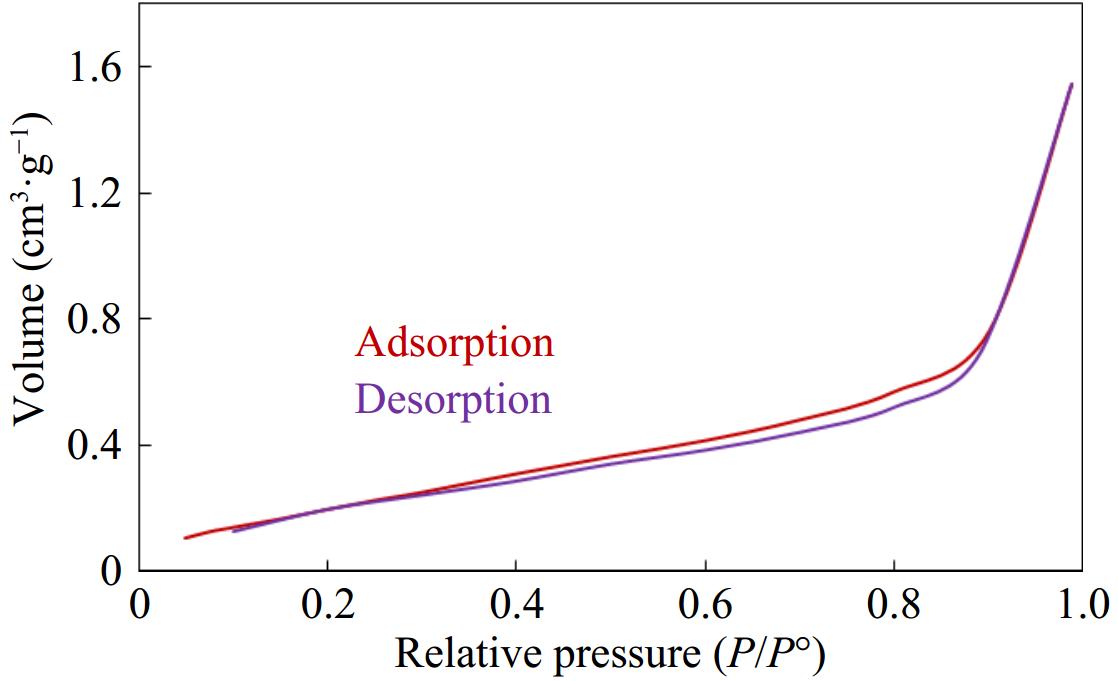
Figure 3.
Nitrogen adsorption-desorption analysis on ZnO-GO.
-
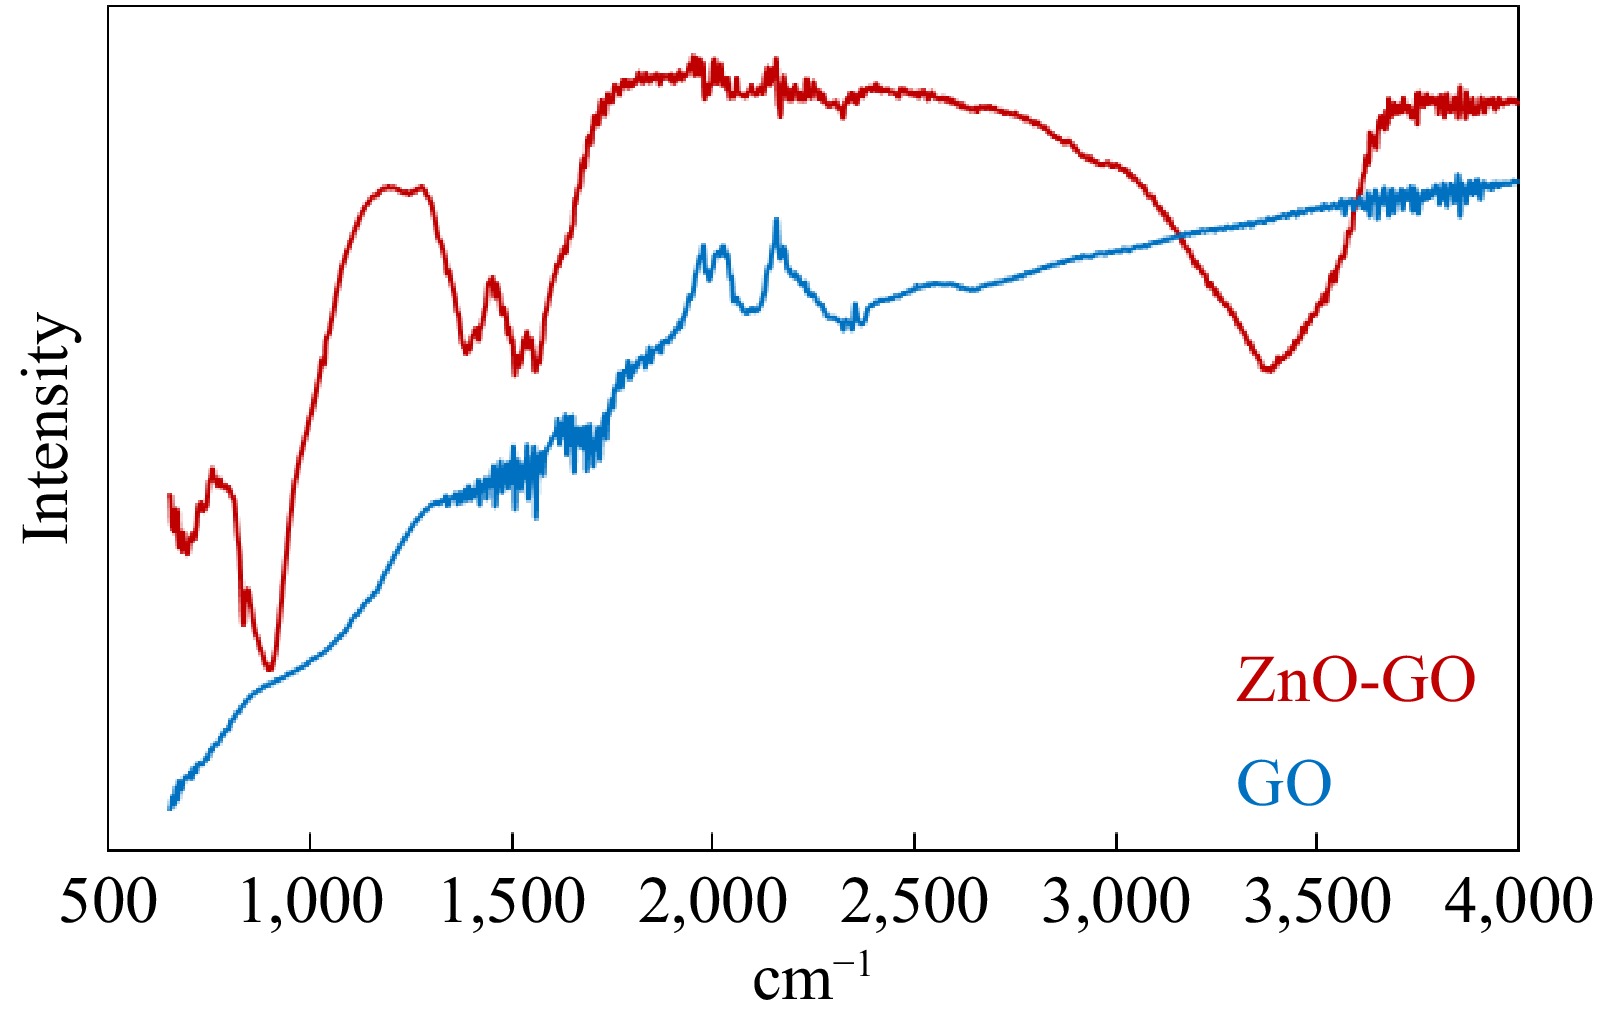
Figure 4.
FTIR analysis.
-
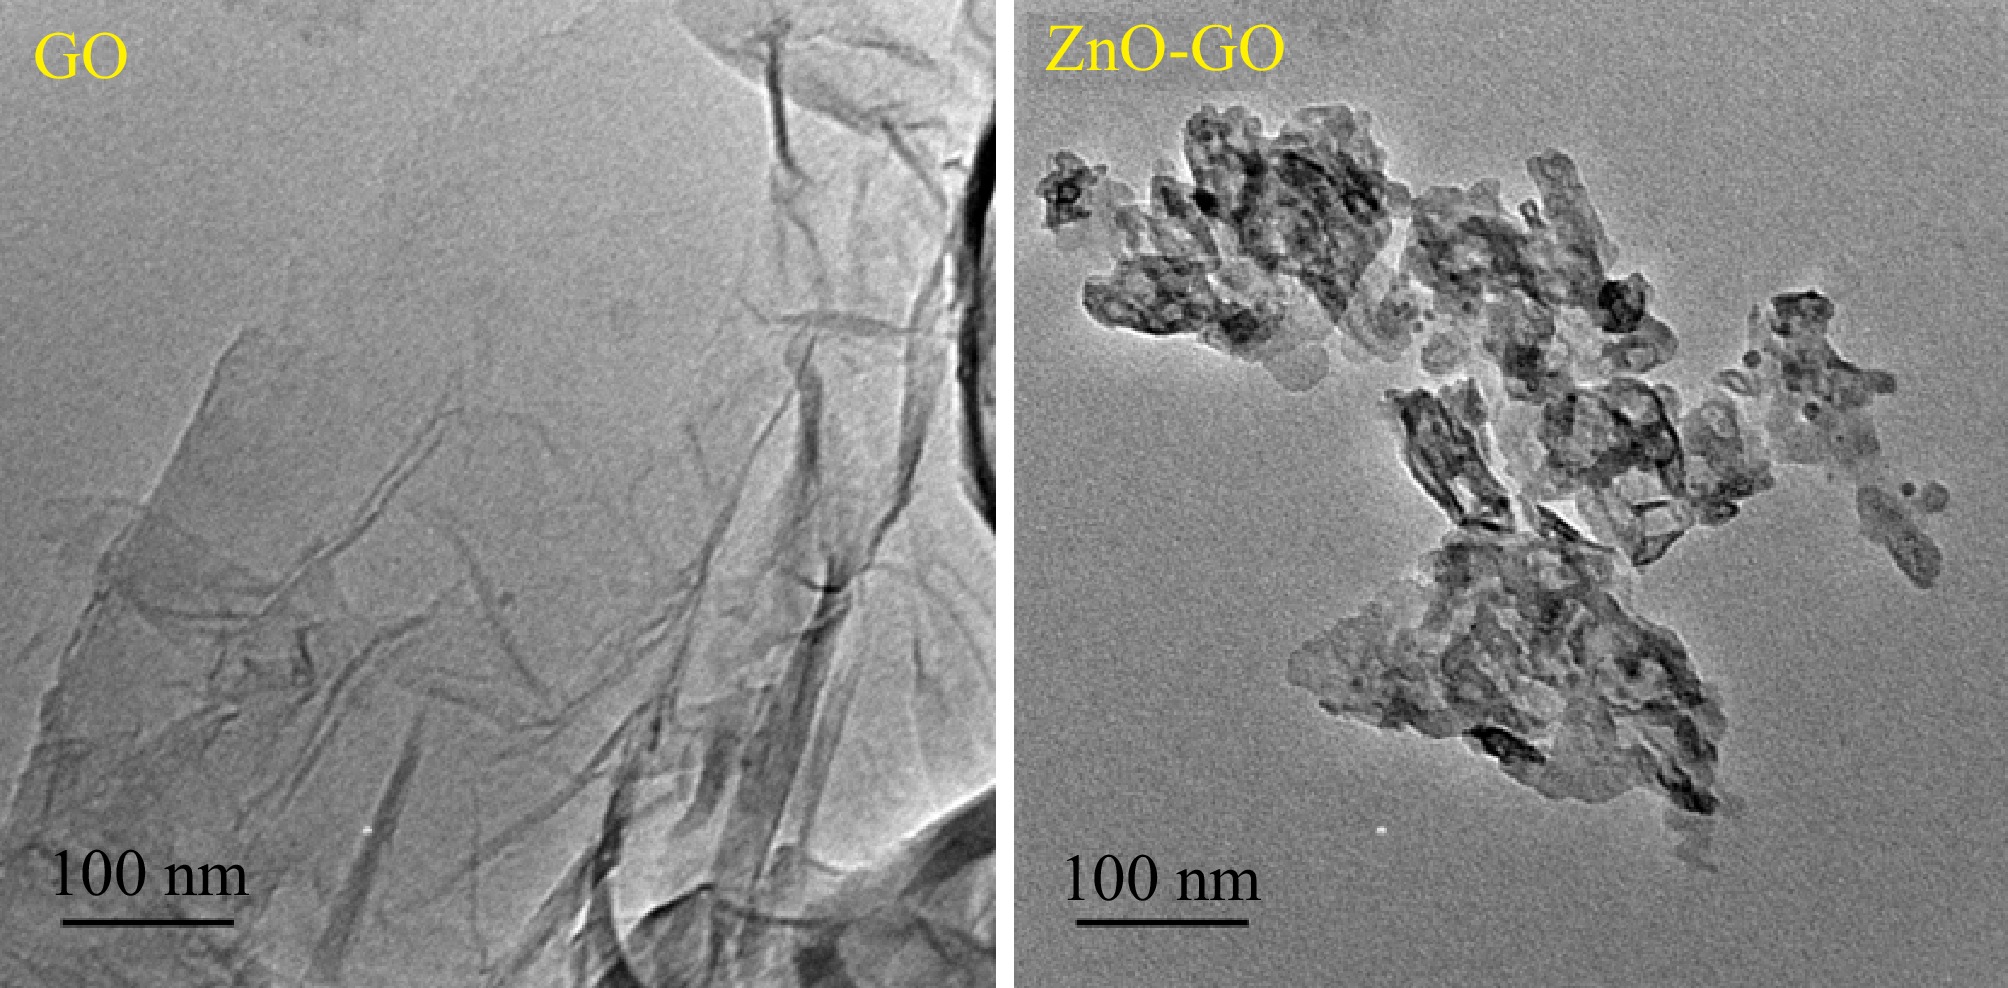
Figure 5.
TEM analysis.
-
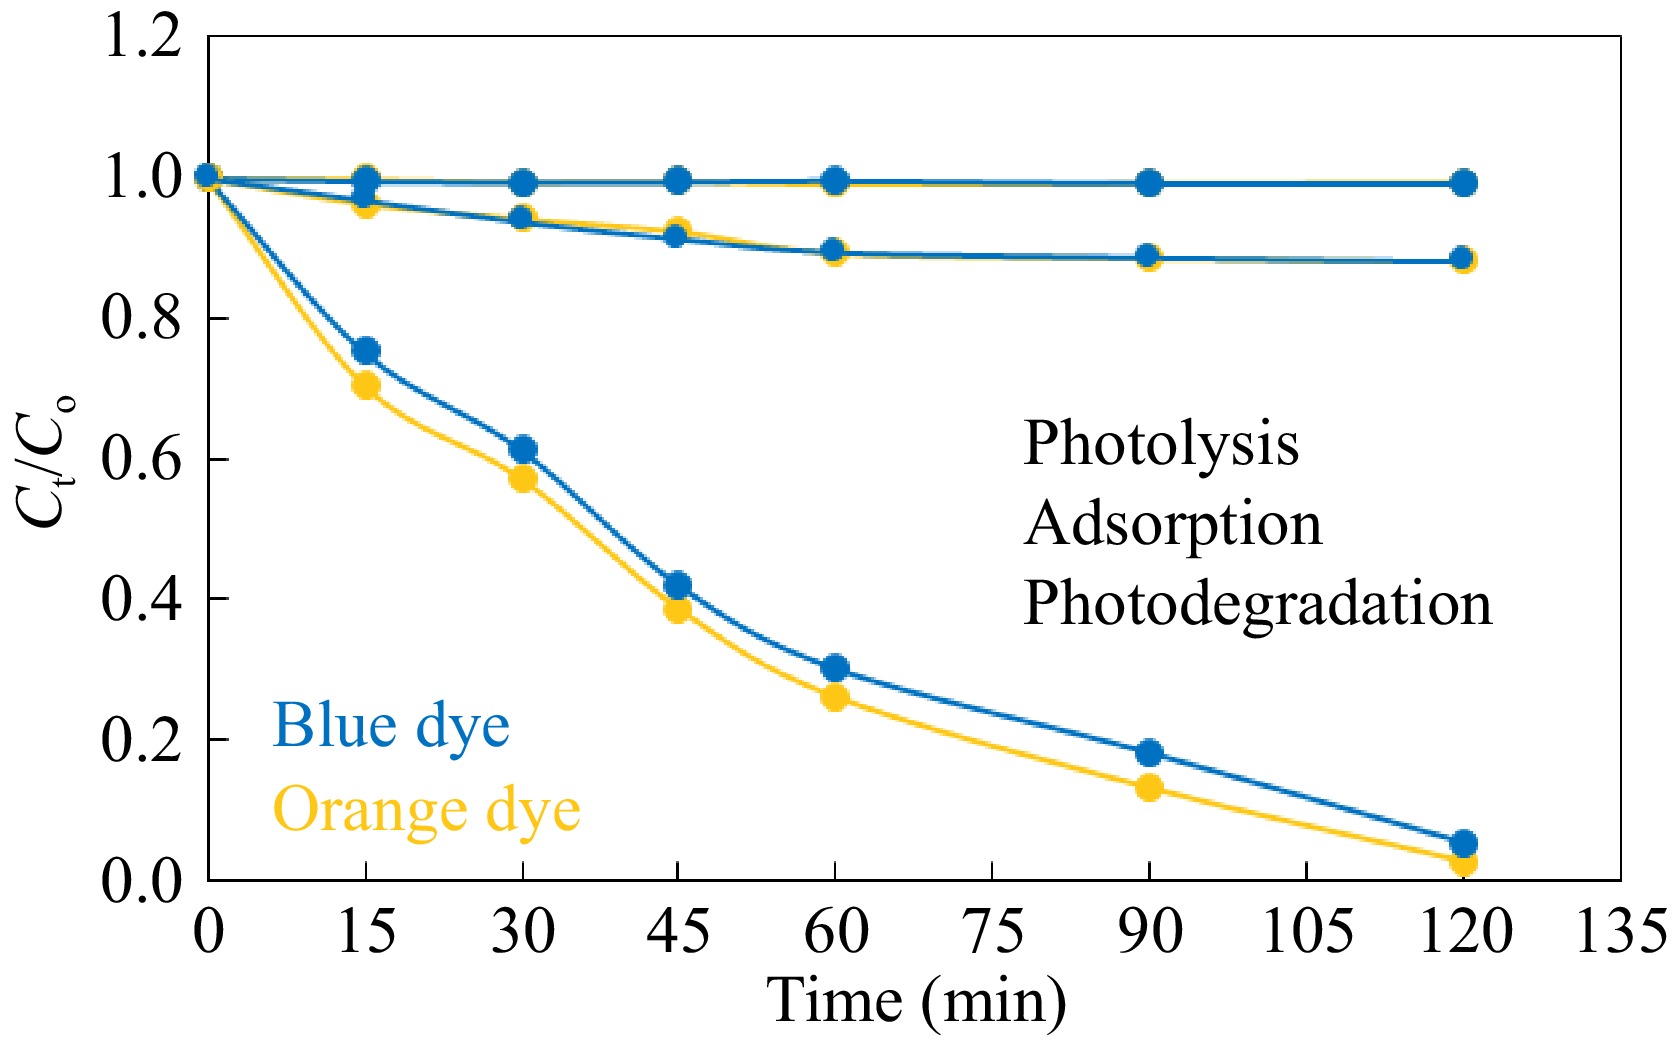
Figure 6.
Treatment of the selected dyes with ZnO-GO. Reaction conditions: 50 mL solution having concentration 100 mg·L−1 0.1 g ZnO-GO were stirred at 40 °C.
-
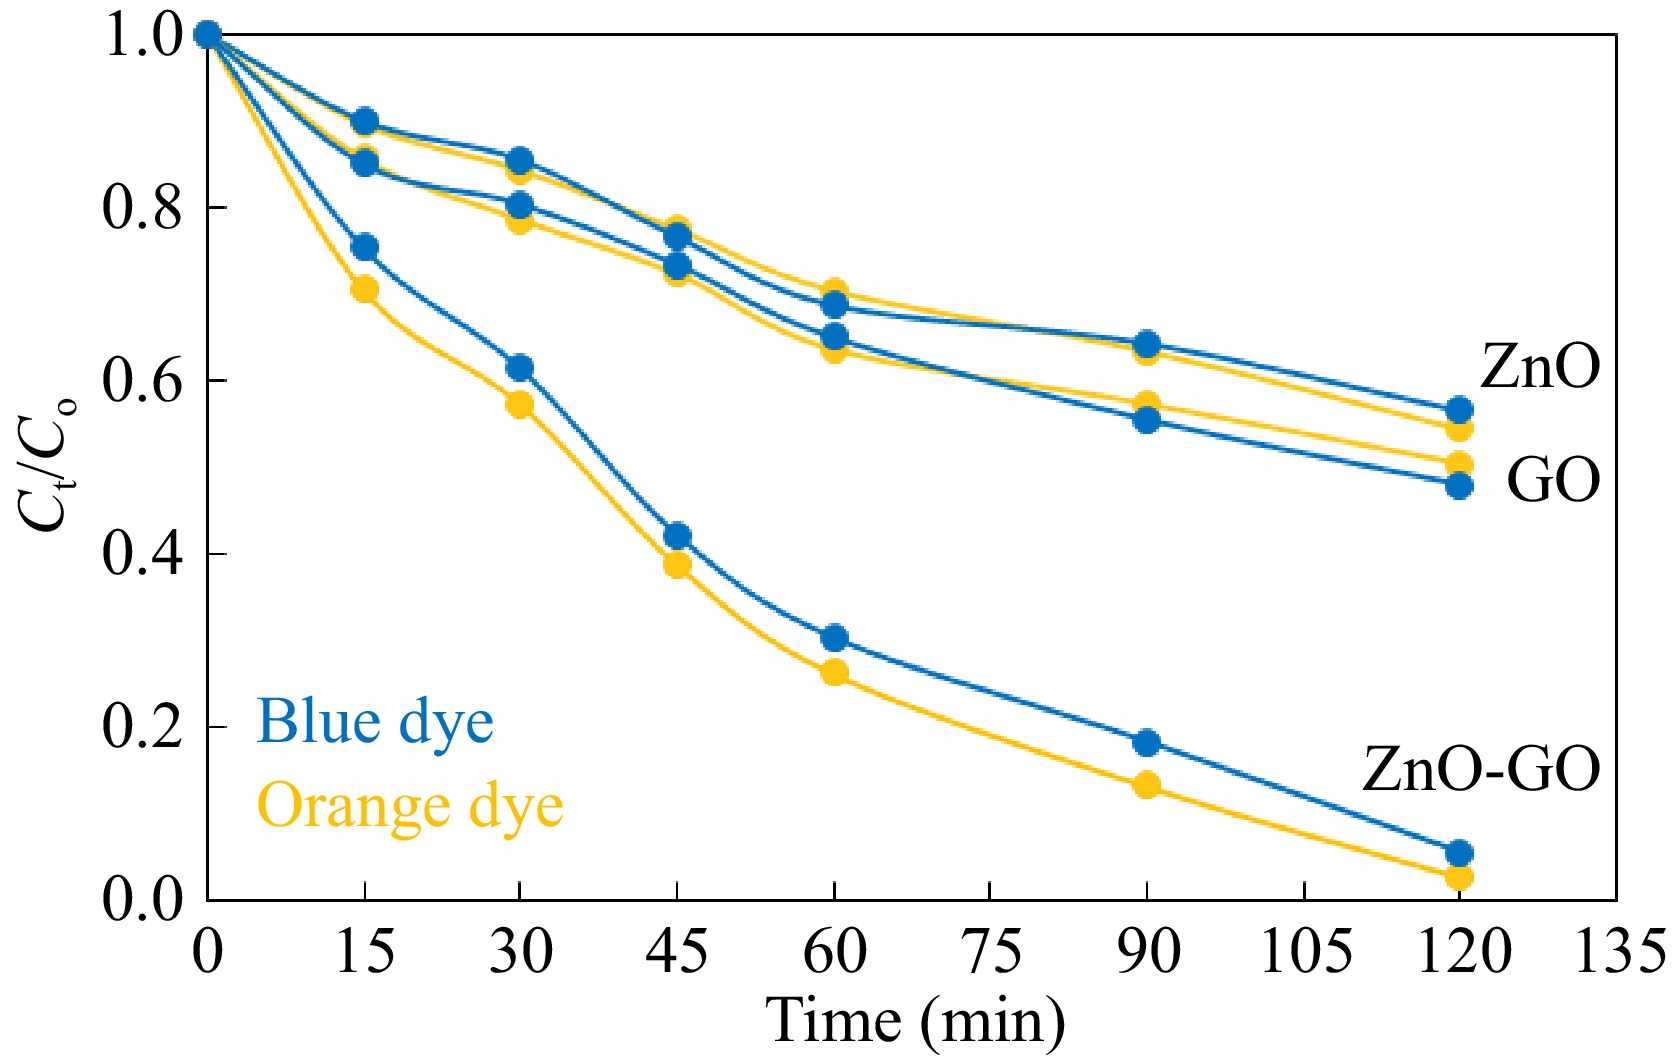
Figure 7.
Treatment of the selected dyes with ZnO, GO, and ZnO-GO photocatalyst. Reaction conditions: 50 mL solution having concentration 100 mg·L−1 0.1 g each catalyst in separate experiments were stirred at 40 °C.
-
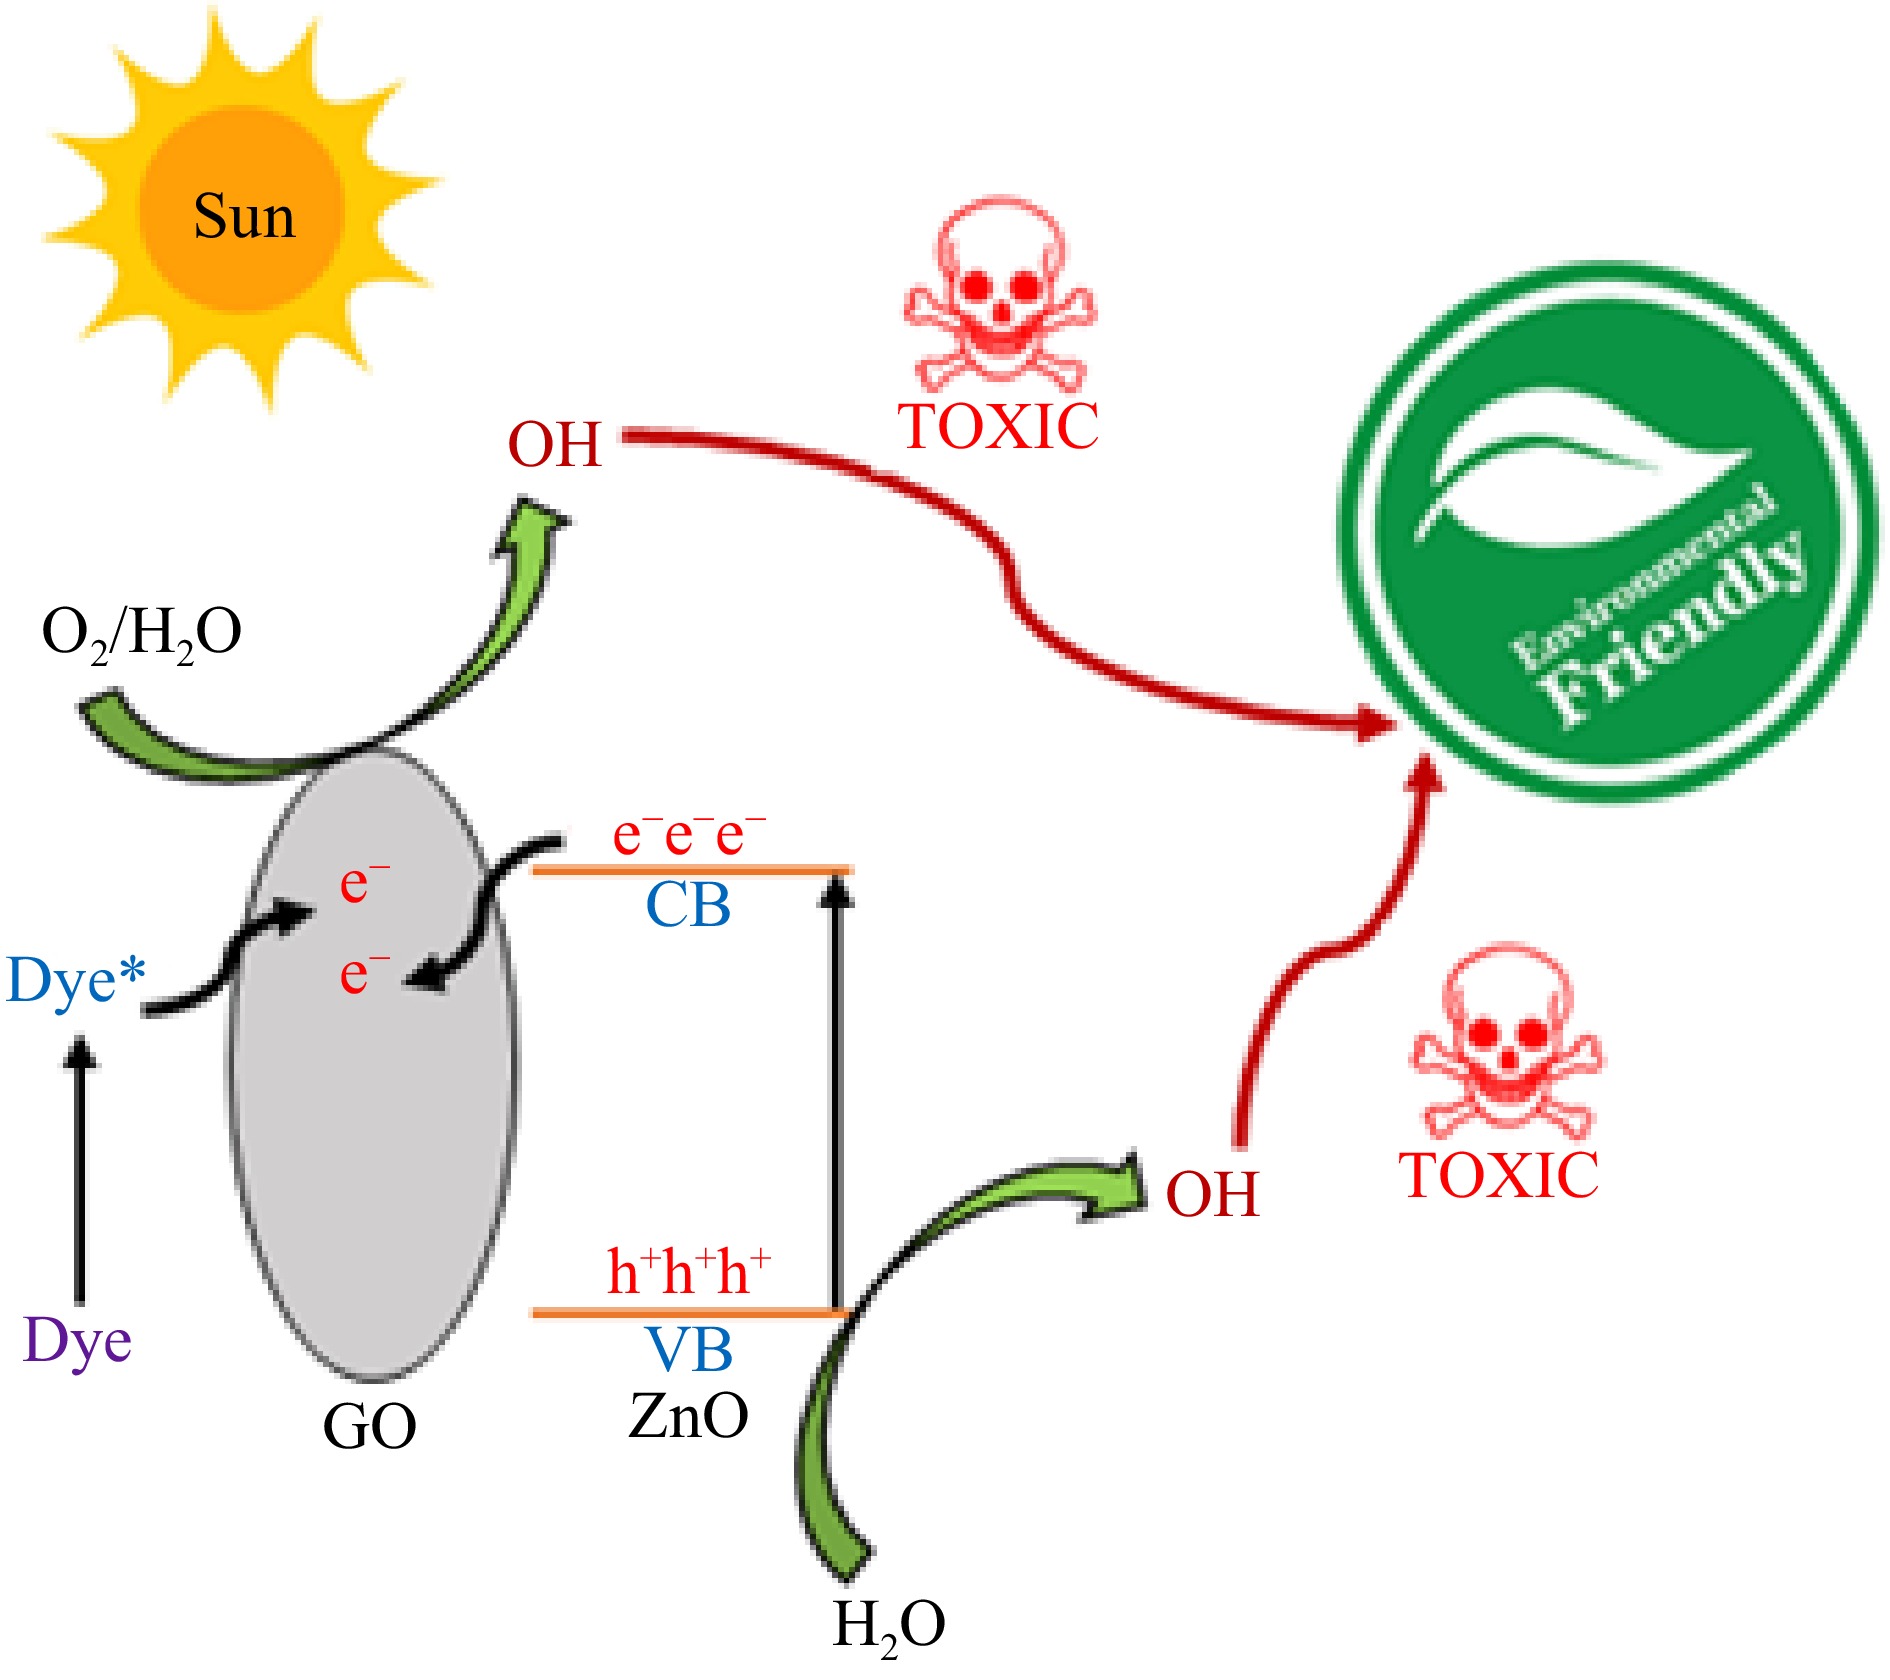
Figure 8.
Mechanism of photocatalytic degradation of dyes.
-
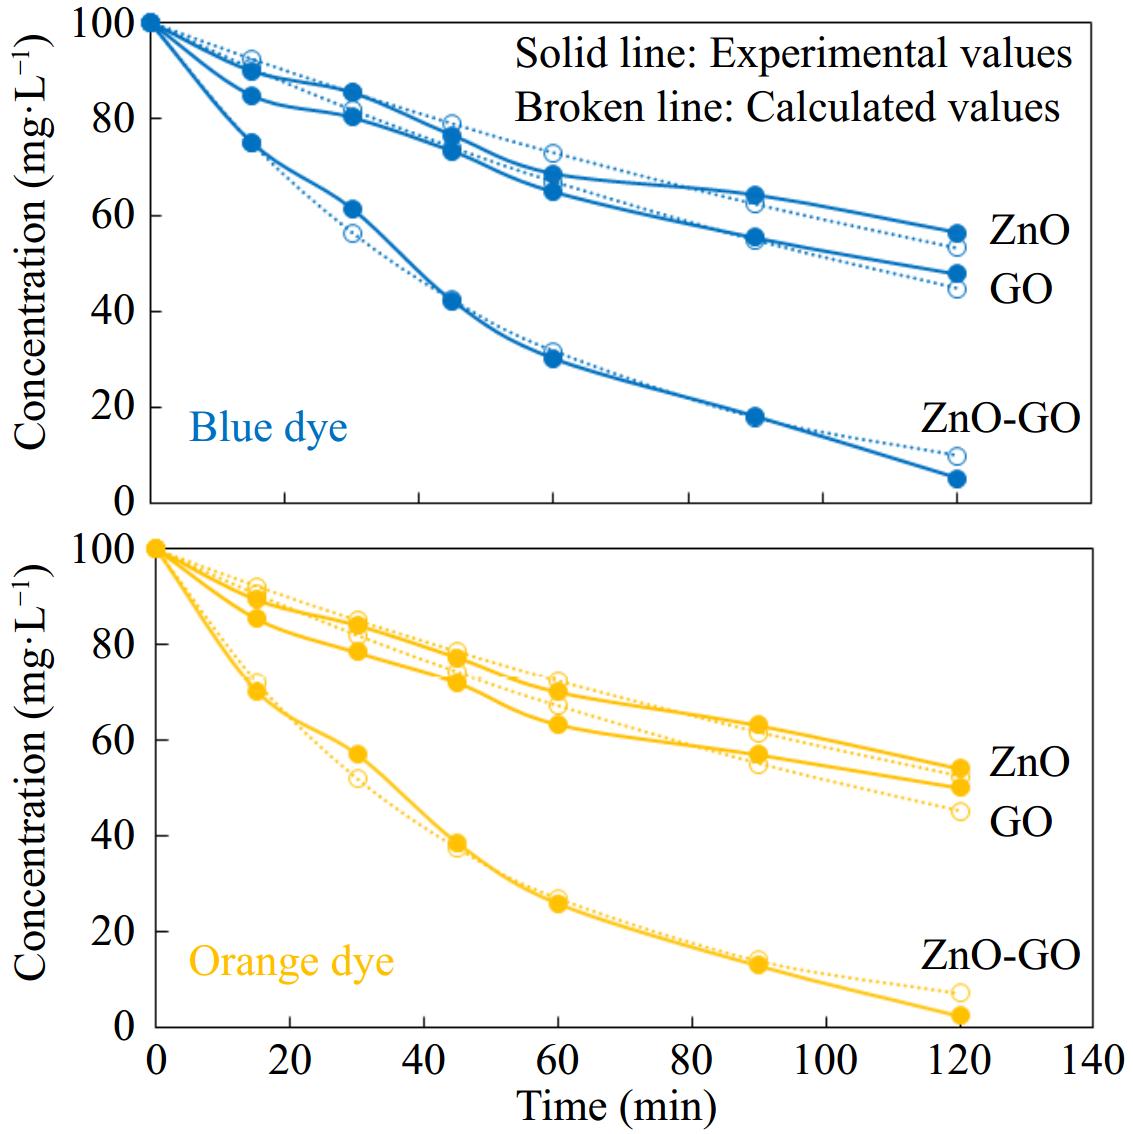
Figure 9.
Kinetics of photocatalytic degradation of the selected dyes. Reaction conditions: 50 mL (100 mg·L−1) dye solution was treated with 0.1 g catalyst at 40 °C.
-
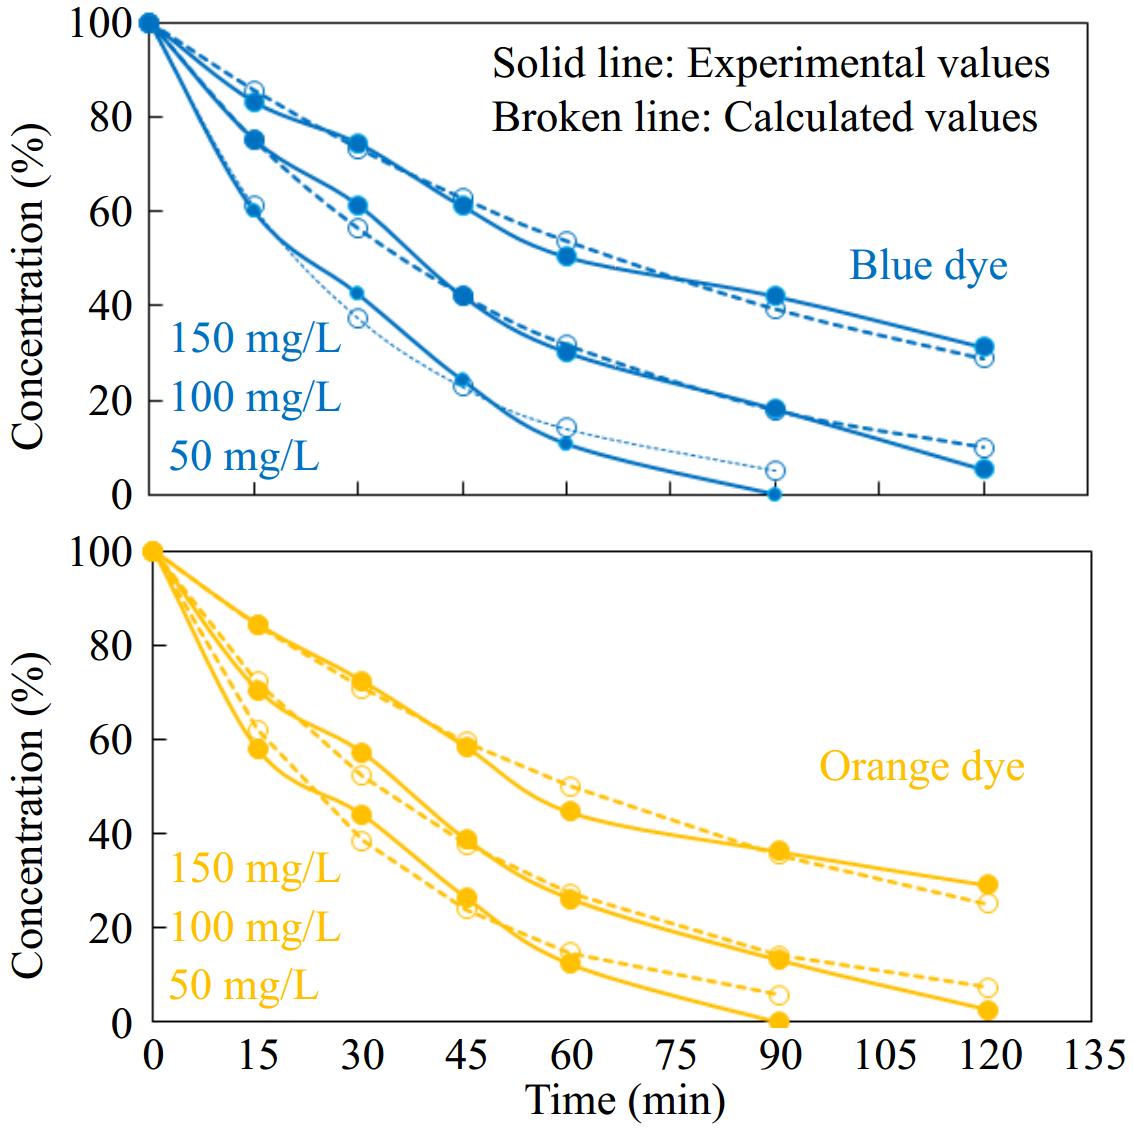
Figure 10.
Effect of concentration on catalytic activity of ZnO-GO in photodegradation of the selected dyes. Reaction conditions: 50 mL dye solution was treated with 0.1 g ZnO-GO at 40 °C.
-
Name Sandalfix orange P3R Sandalfix Turq. blue PG Color Orange Blue Class Reactive Reactive CI number Reactive orange 12 Reactive blue 21 λmax 485 nm 414 nm Molecular weight 793 g·mol−1 1,079.6 g·mol−1 Molecular formula C21H14ClN8Na3O10S3 C40H25CuN9O14S5 Molecular structure 

Table 1.
Detailed information about the selected dyes.
-
Photocatalyst Sandalfix orange P3R Sandalfix turq. blue PG kr (per min) R2 kr (per min) R2 ZnO 0.0054 0.99 0.0053 0.99 GO 0.0066 0.98 0.0067 0.98 ZnO-GO 0.0217 0.99 0.0191 0.99 Table 2.
Rate constants for photocatalytic degradation of the selected dyes.
-
Concentration (mg·L−1) Sandalfix orange P3R Sandalfix Turq. blue PG *Activity (%) kr (per min) *Activity (%) kr (per min) 50 88 0.0319 89 0.0326 100 74 0.0217 70 0.0191 150 55 0.0115 50 0.0103 * Photodegradation after 60 min. Table 3.
Rate constants for photocatalytic degradation of the selected dyes with different initial concentrations.
Figures
(10)
Tables
(3)