-
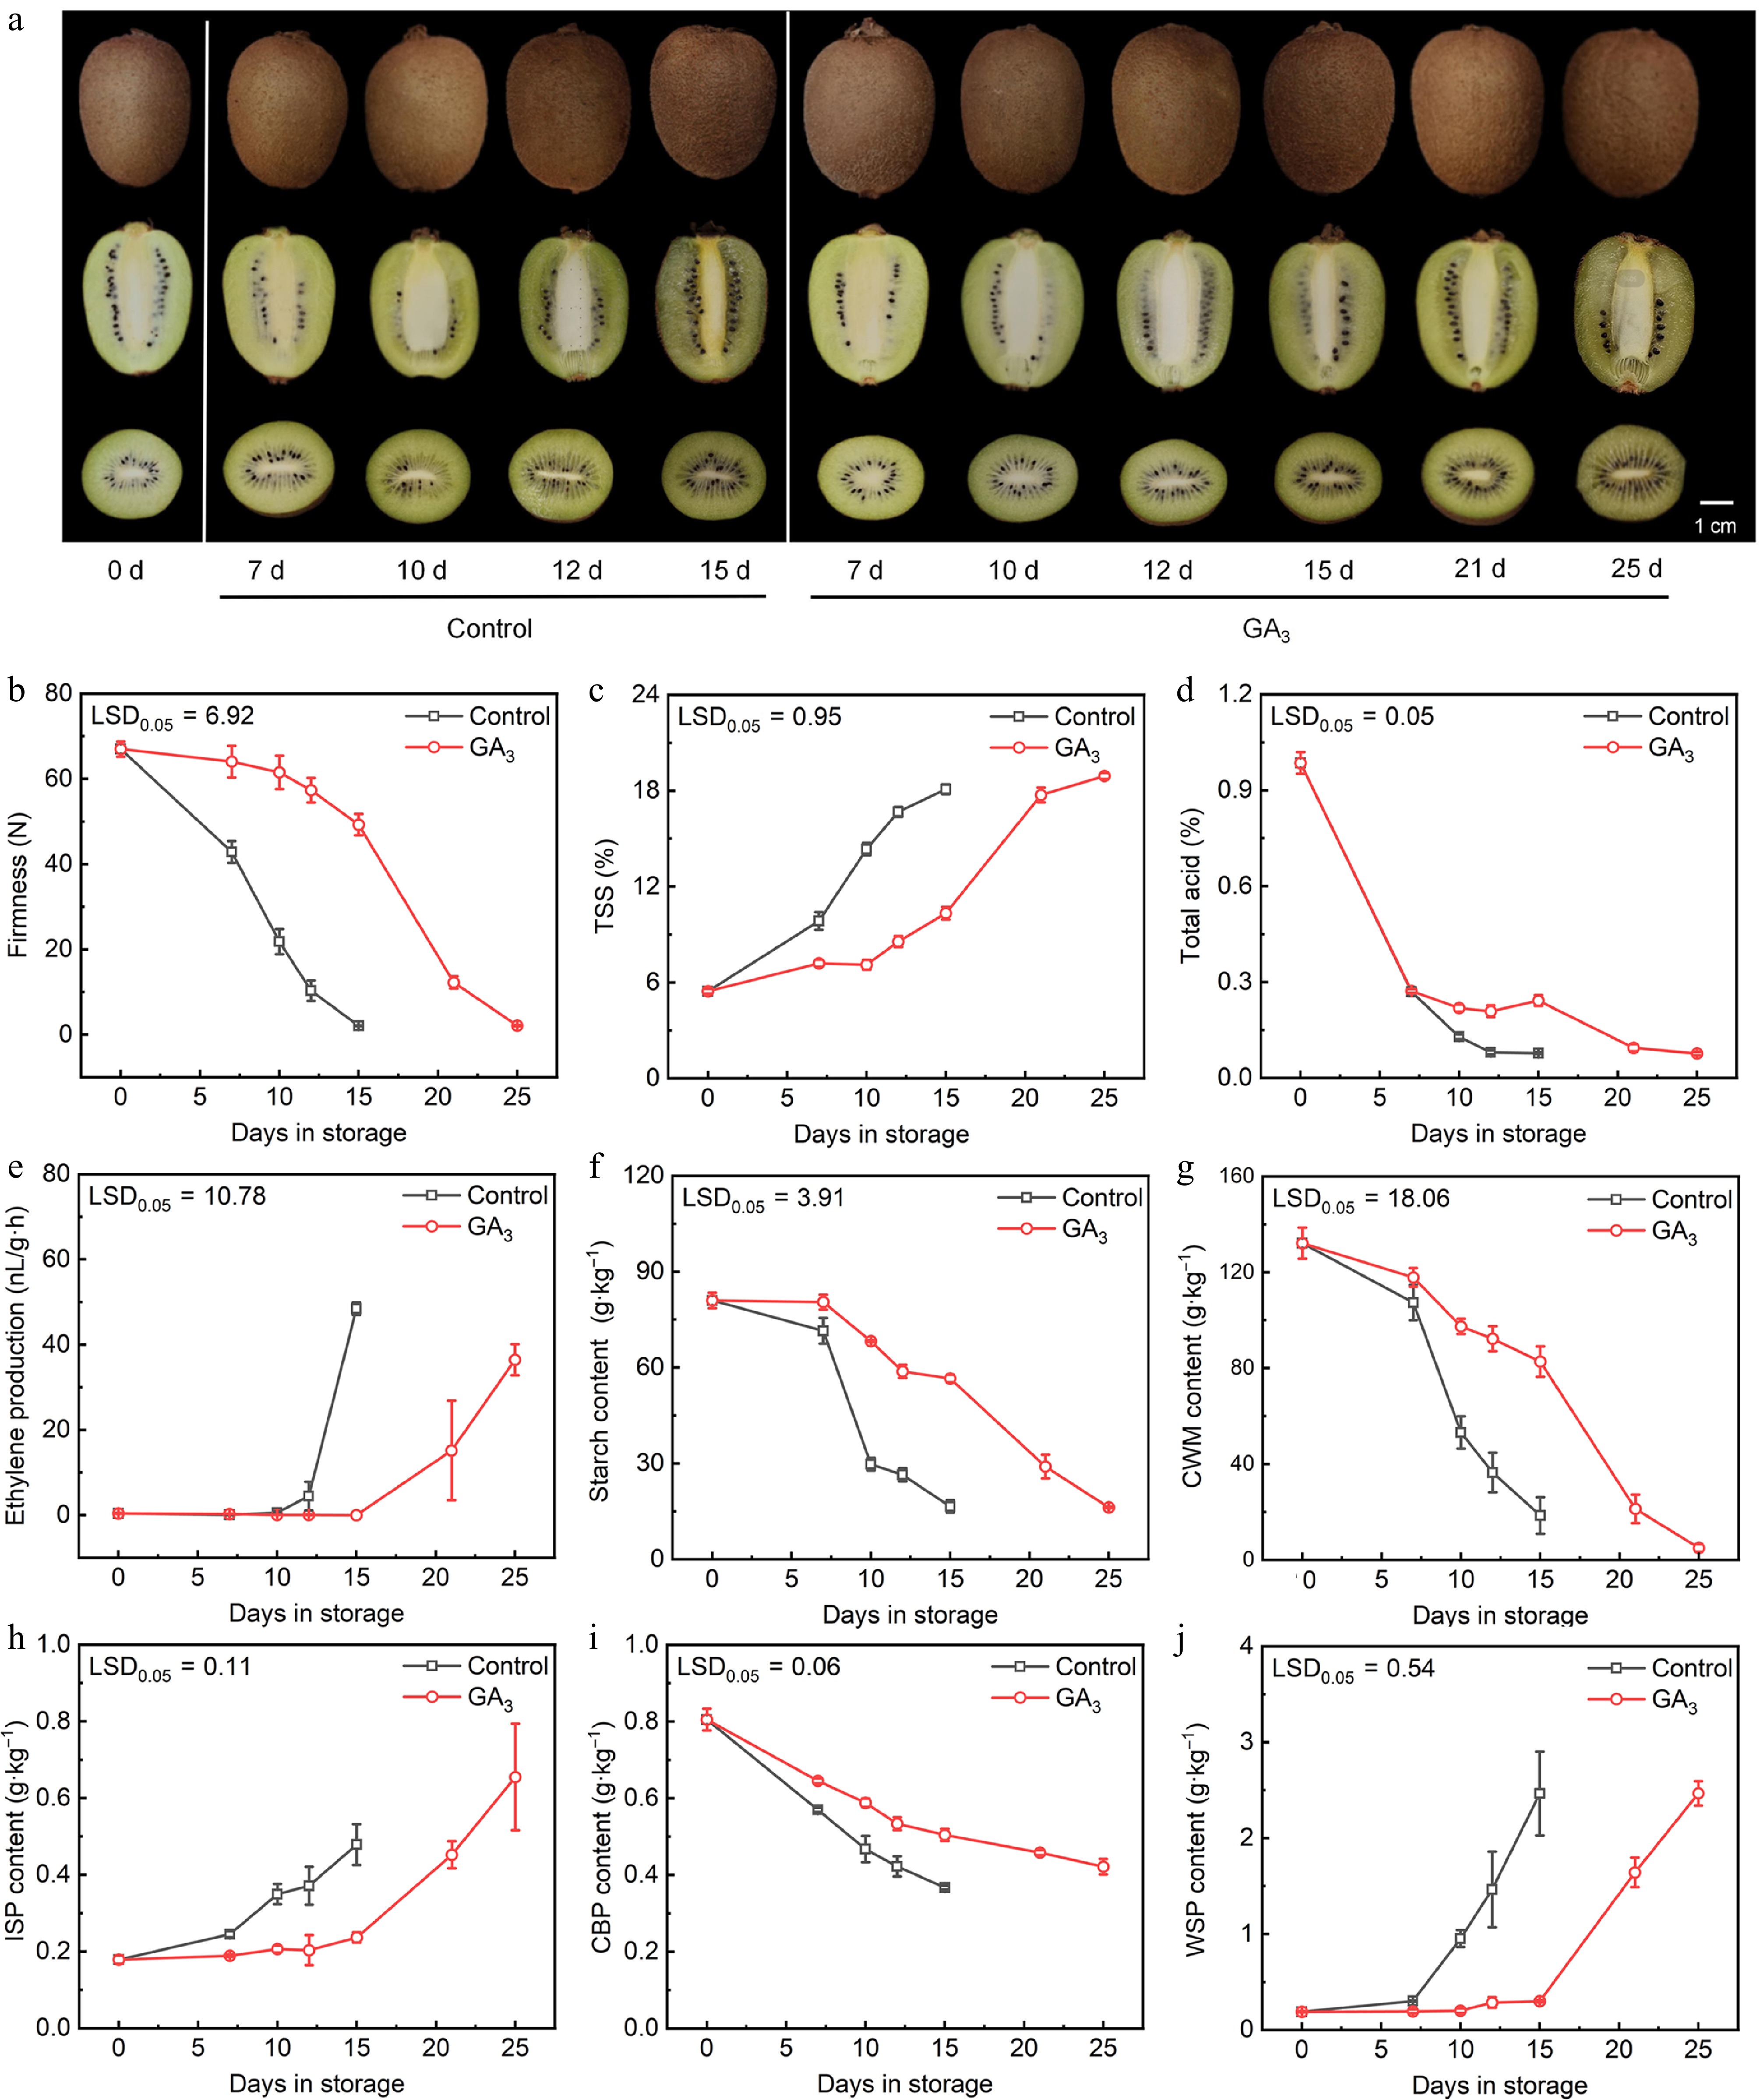
Figure 1.
The alterations in performance and physiological attributes of kiwifruit following treatment with gibberellin has been conducted. (a) Photographs of kiwifruit in different groups. (b) Firmness of kiwifruit in different groups. (c) Total soluble solids (TSS) of kiwifruit in different groups. (d) Total acid of kiwifruit in different groups. (e) Ethylene production of kiwifruit in different groups. (f) Starch content of kiwifruit in different groups. (g) Cell-wall material (CWM) content of kiwifruit in different groups. (h) Ionic soluble pectin (ISP) content of kiwifruit in different groups. (i) Covalent binding pectin (CBP) content of kiwifruit in different groups. (j) Water soluble pectin (WSP) content of kiwifruit in different groups. Error bars: ± SE from nine replicates (for firmness, TSS, and total acid) or three replicates (for ethylene production, starch content, CWM, ISP, CBP, and WSP). LSD: least significant difference at p = 0.05.
-
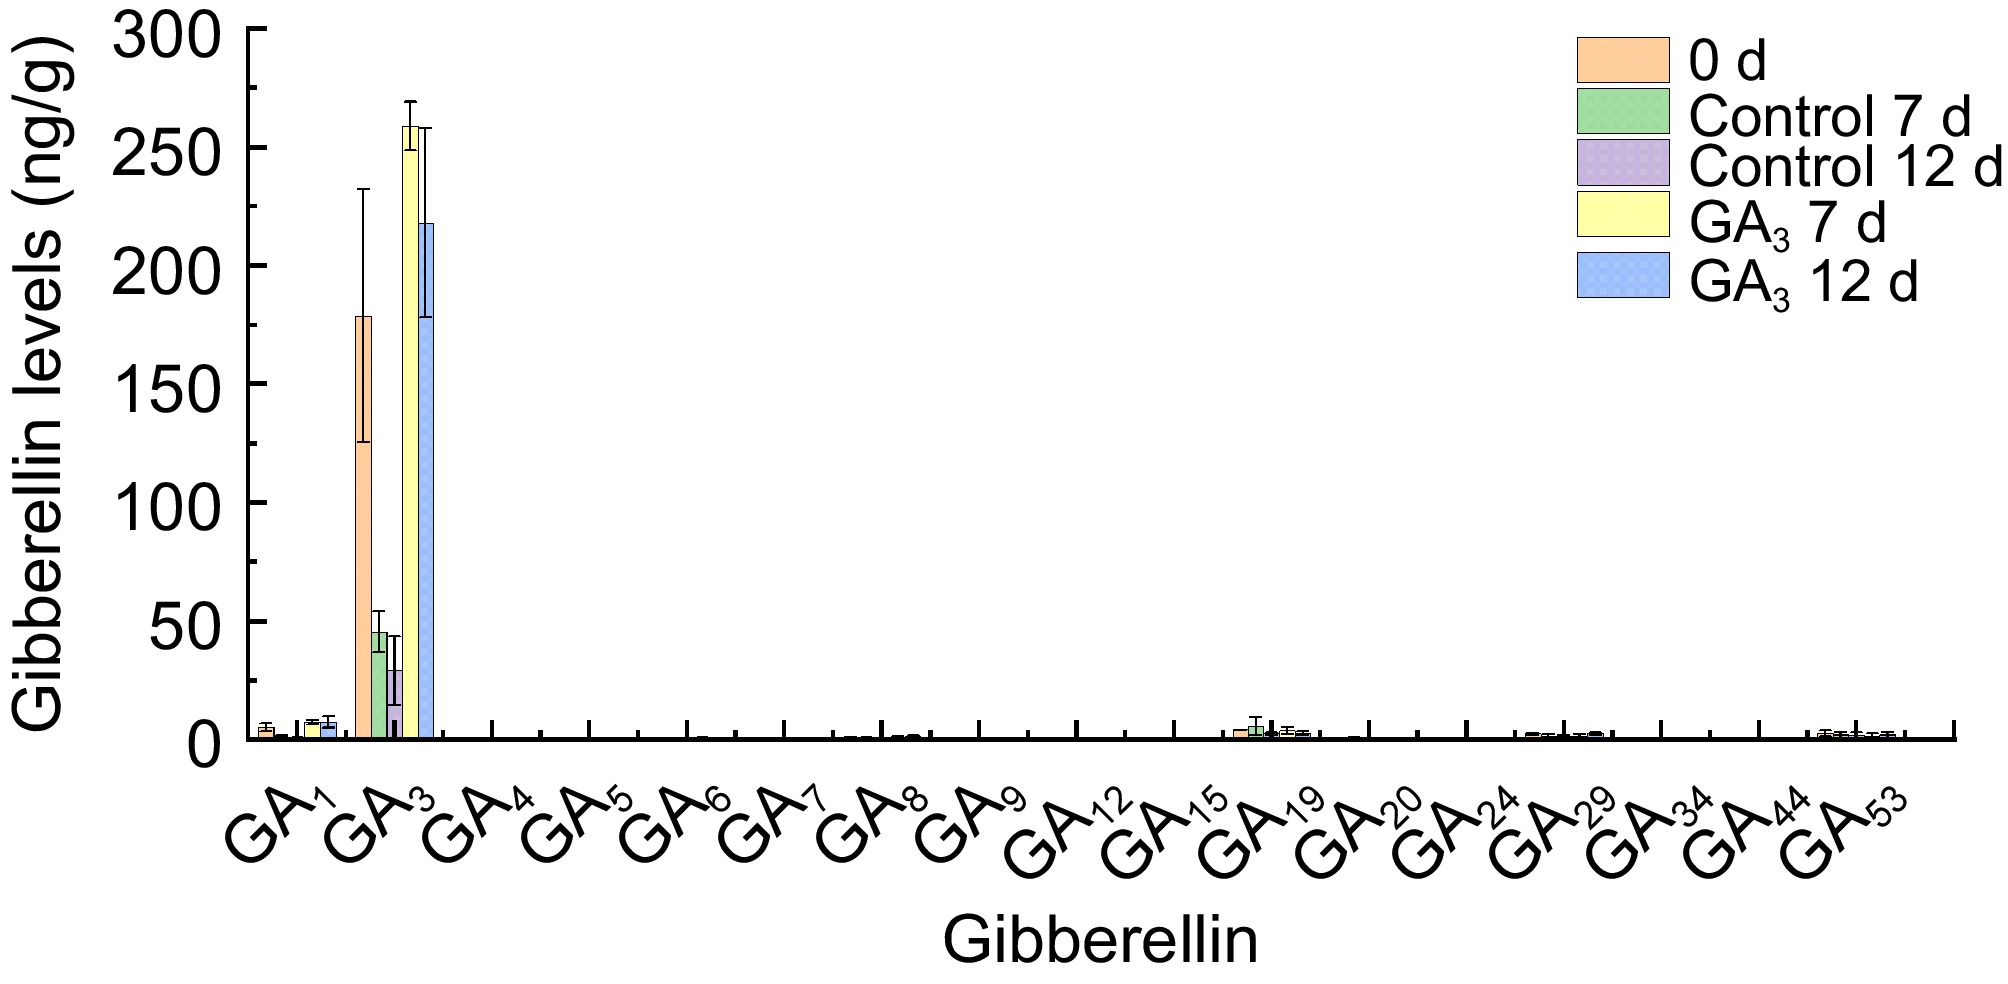
Figure 2.
Determination of endogenous gibberellin contents in different group kiwifruit at 0, 7, and 12 d of post-harvest storage. Error bars: ± SE from three replicates.
-
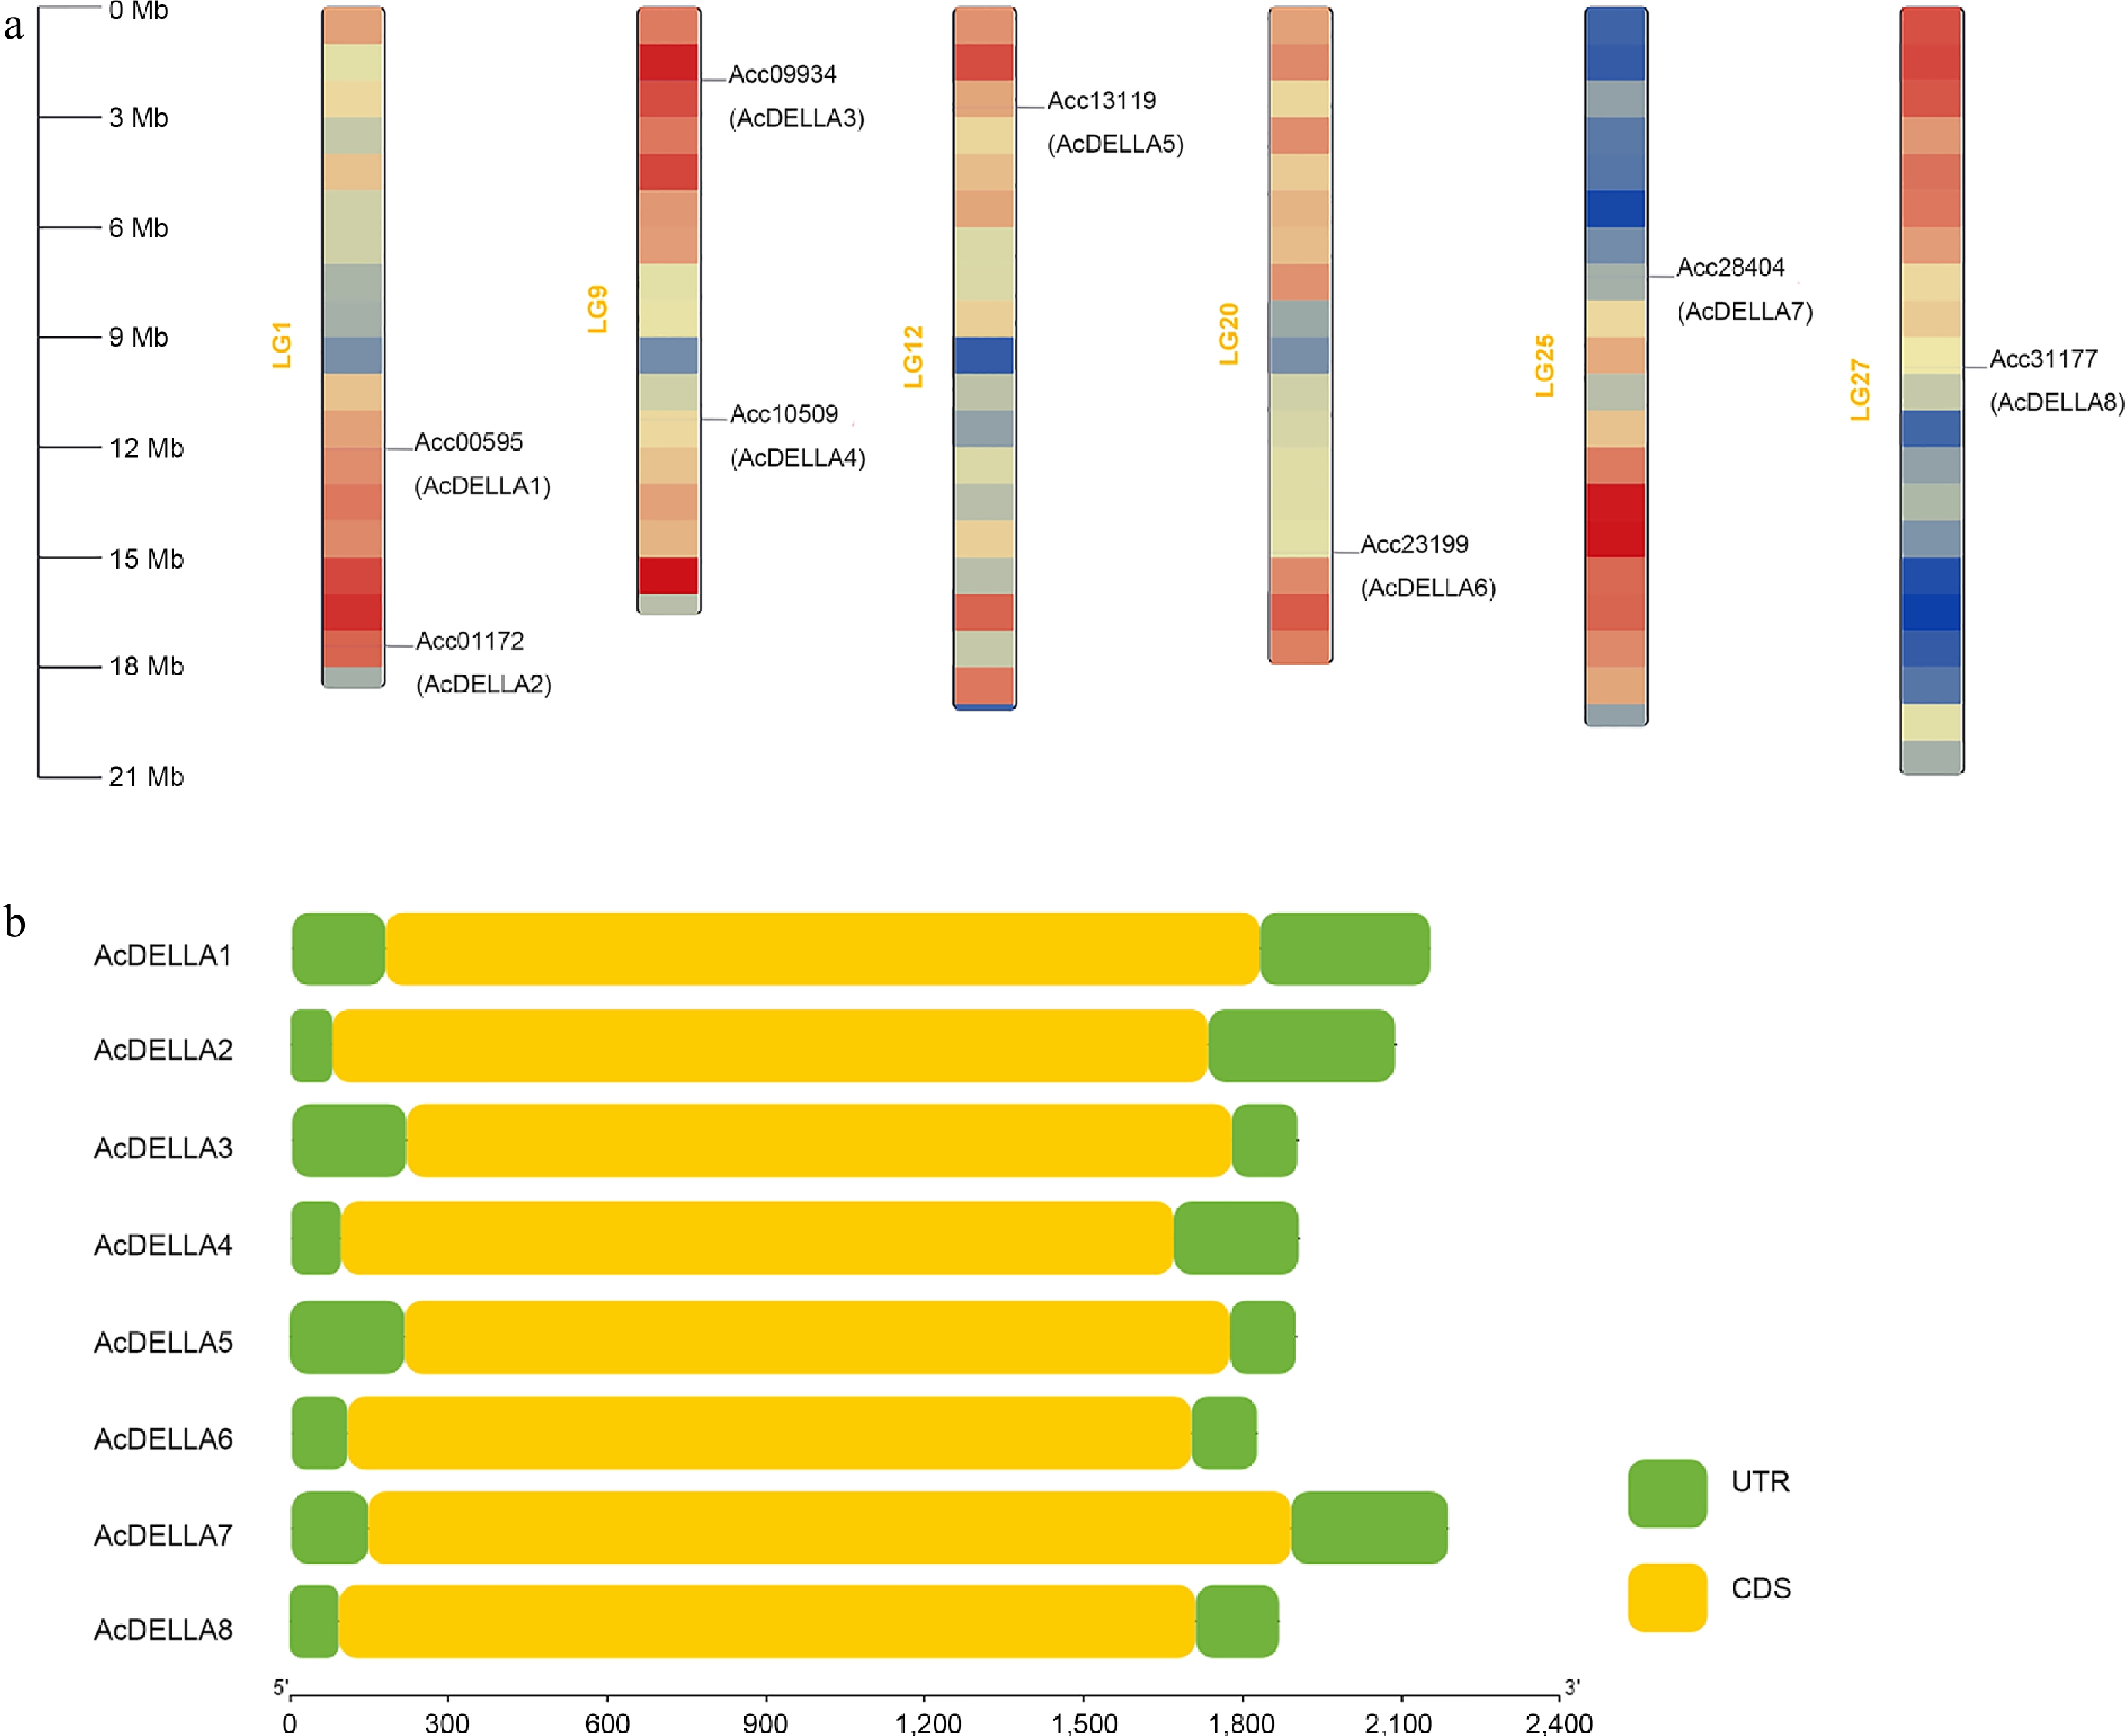
Figure 3.
(a) Chromosome localization of kiwifruit AcDELLA gene family, and (b) schematic diagram of gene structure of kiwifruit AcDELLA gene family.
-
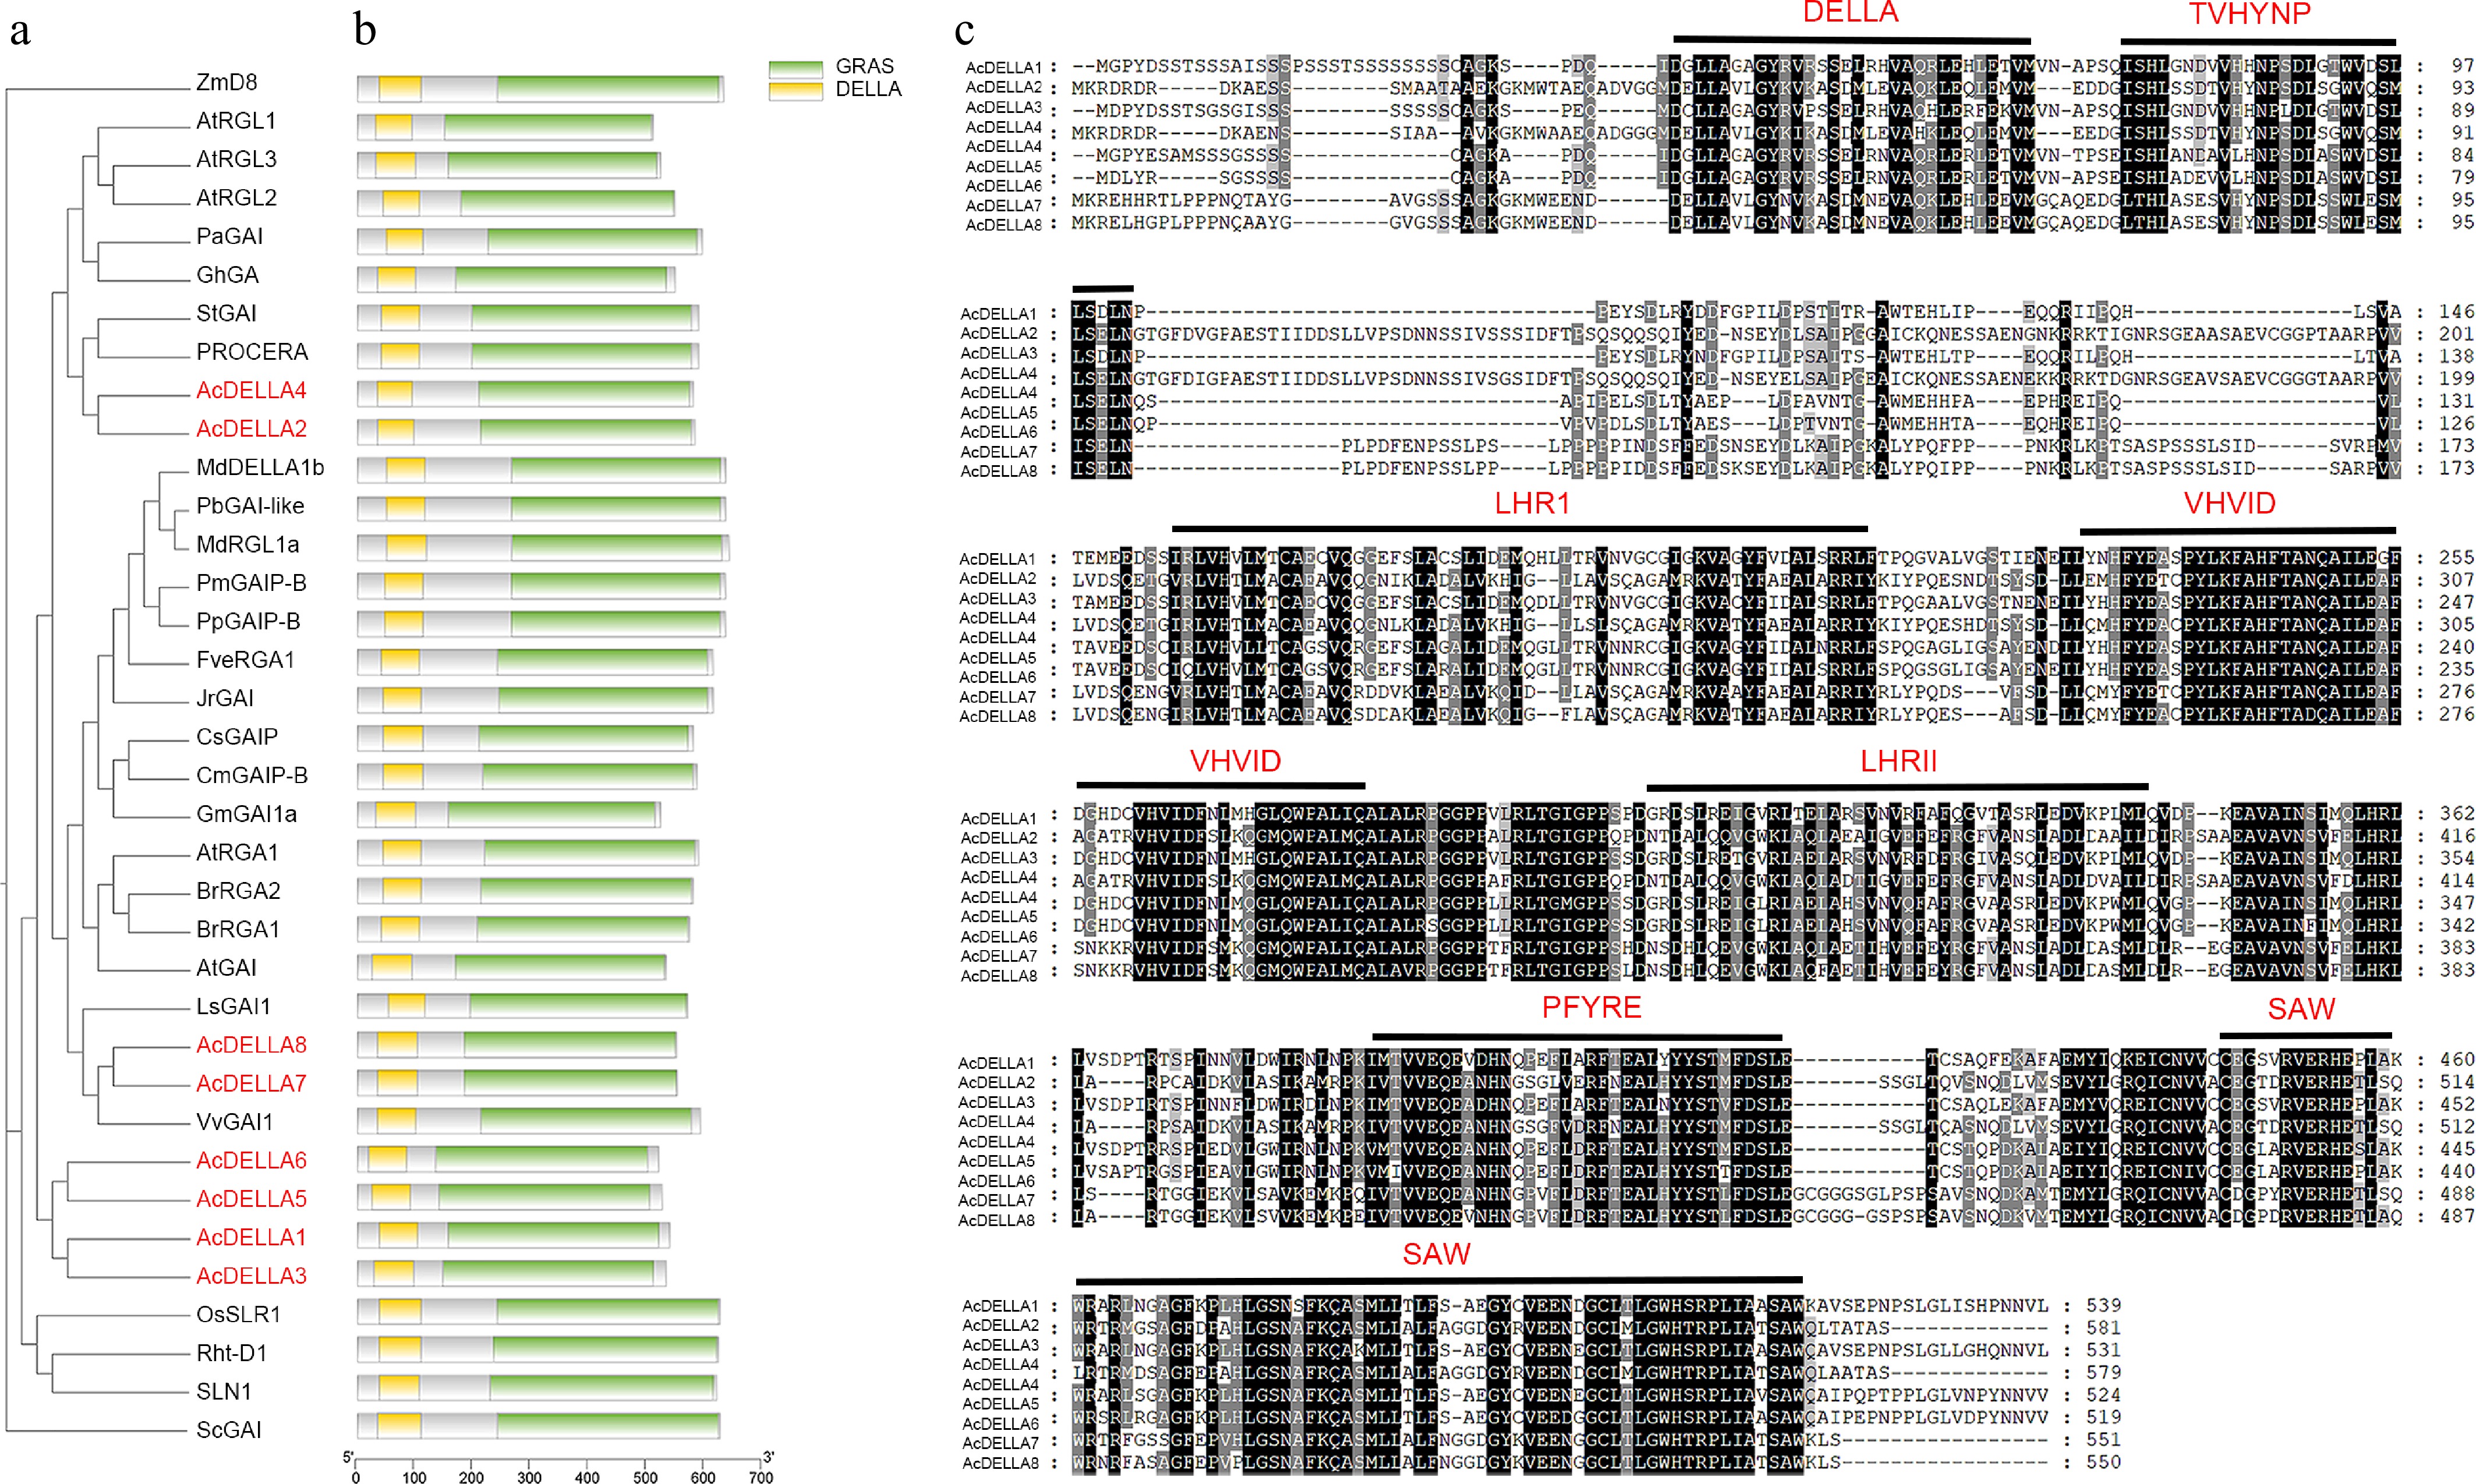
Figure 4.
Phylogenetic analysis, protein domain, conserved motif analysis of AcDELLA proteins. (a) Phylogenetic analysis of kiwifruit DELLA proteins with other species DELLA proteins. (b) Multiple comparison of amino acid sequences of kiwifruit and other species DELLA proteins. (c) Conserved motif analysis of AcDELLA proteins. Conserved residues are indicated by dark and gray boxes and variant residues are shown by light gray boxes. Black lines represent conserved motifs.
-
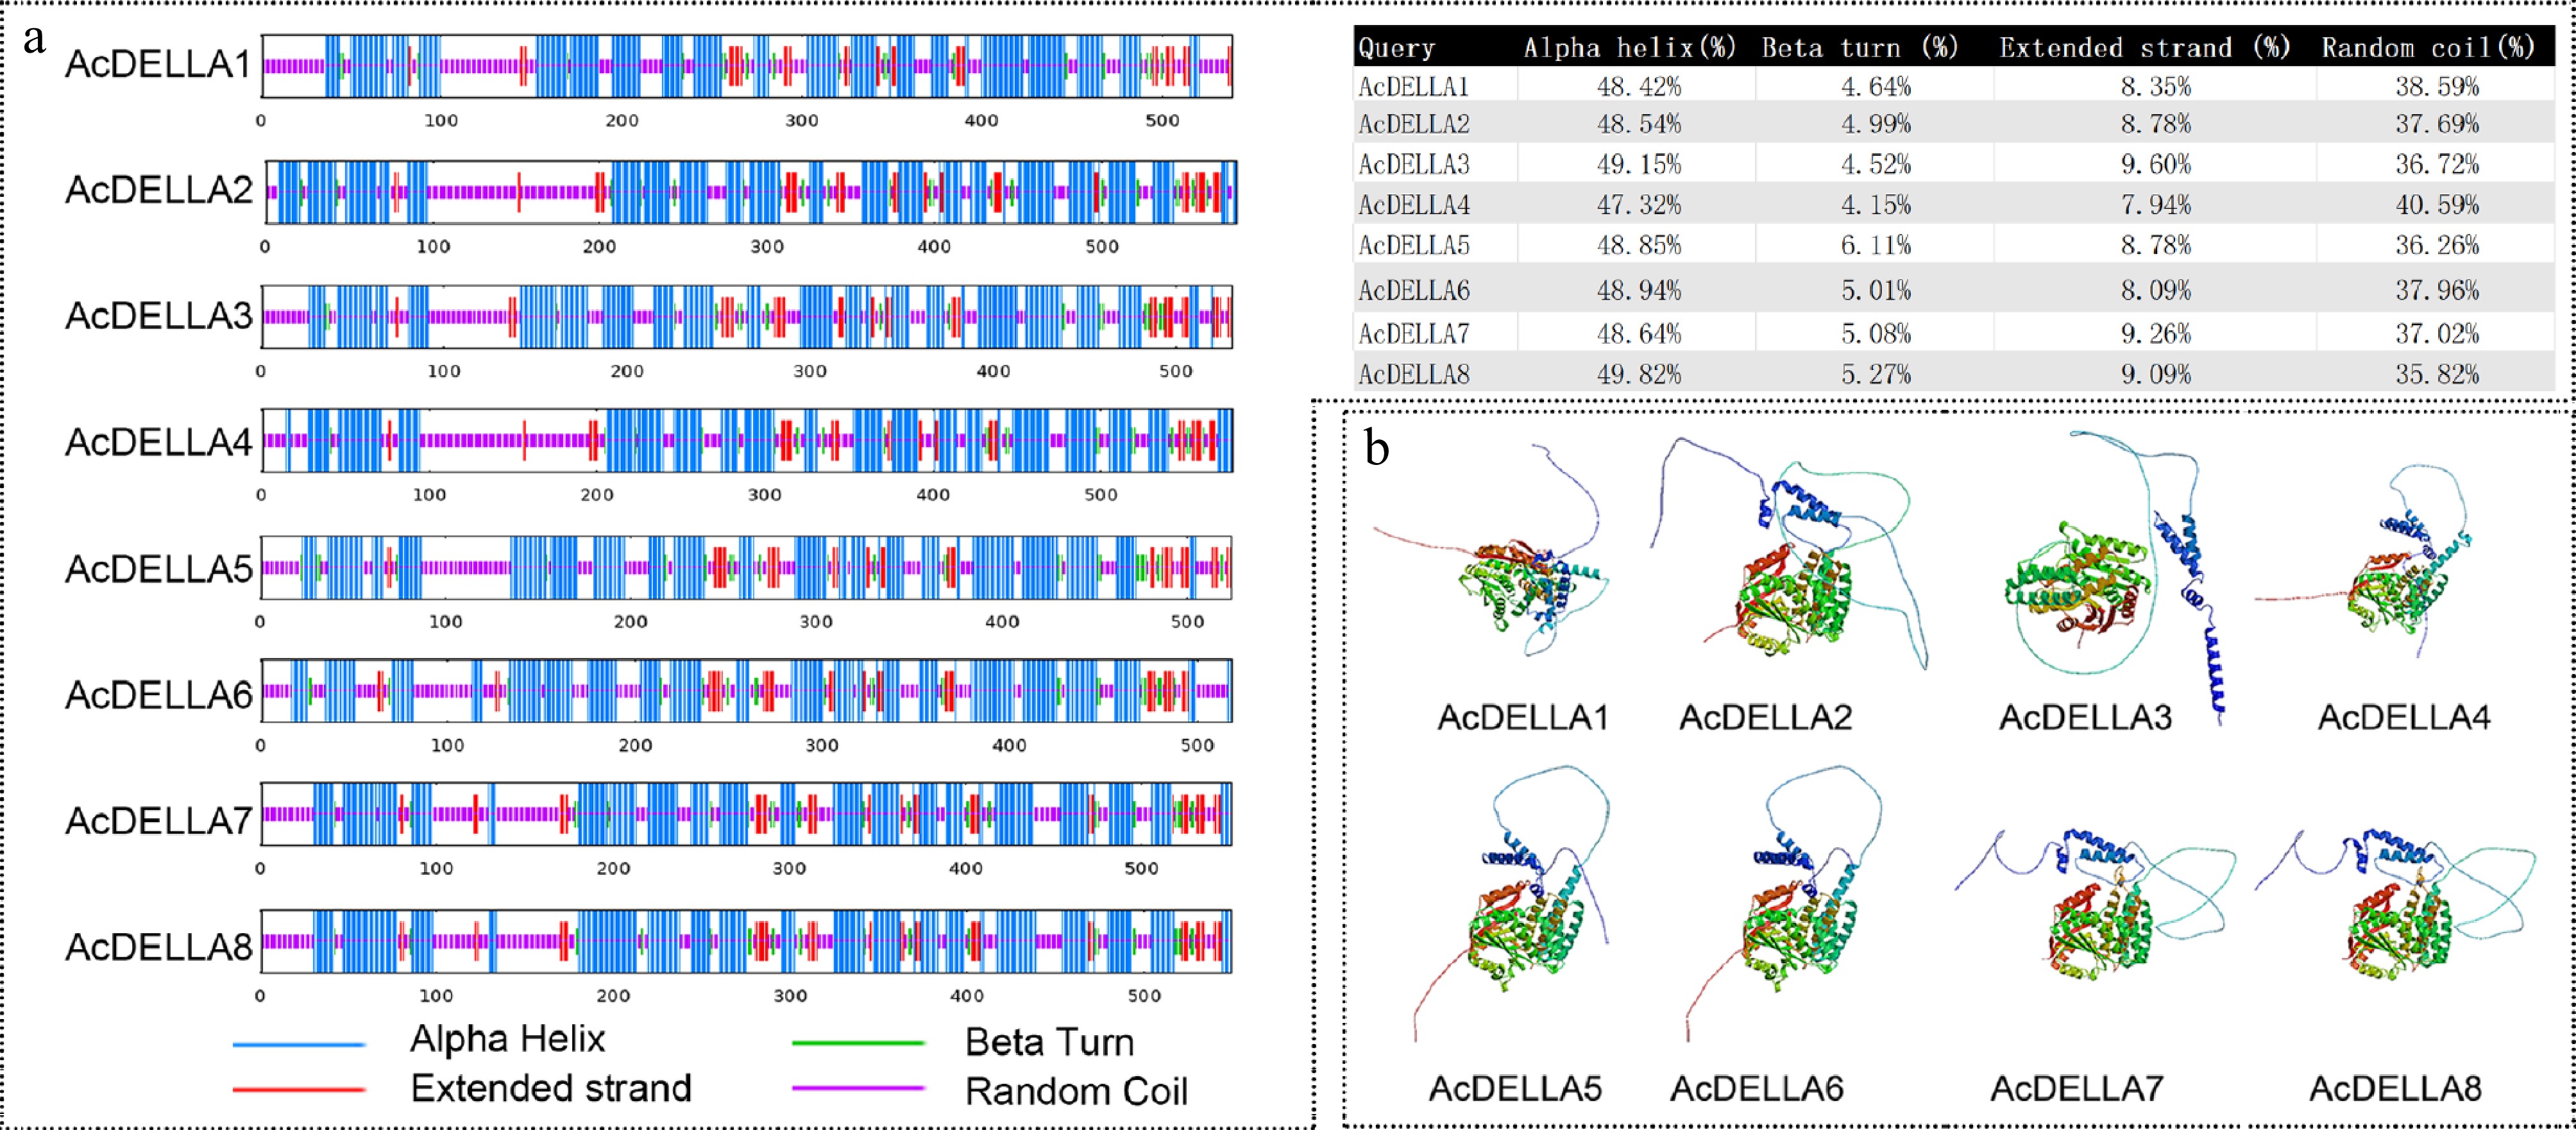
Figure 5.
Structure prediction of eight AcDELLA proteins in kiwifruit. (a) Secondary structure of AcDELLA proteins. (b) Tertiary structure of AcDELLA proteins.
-
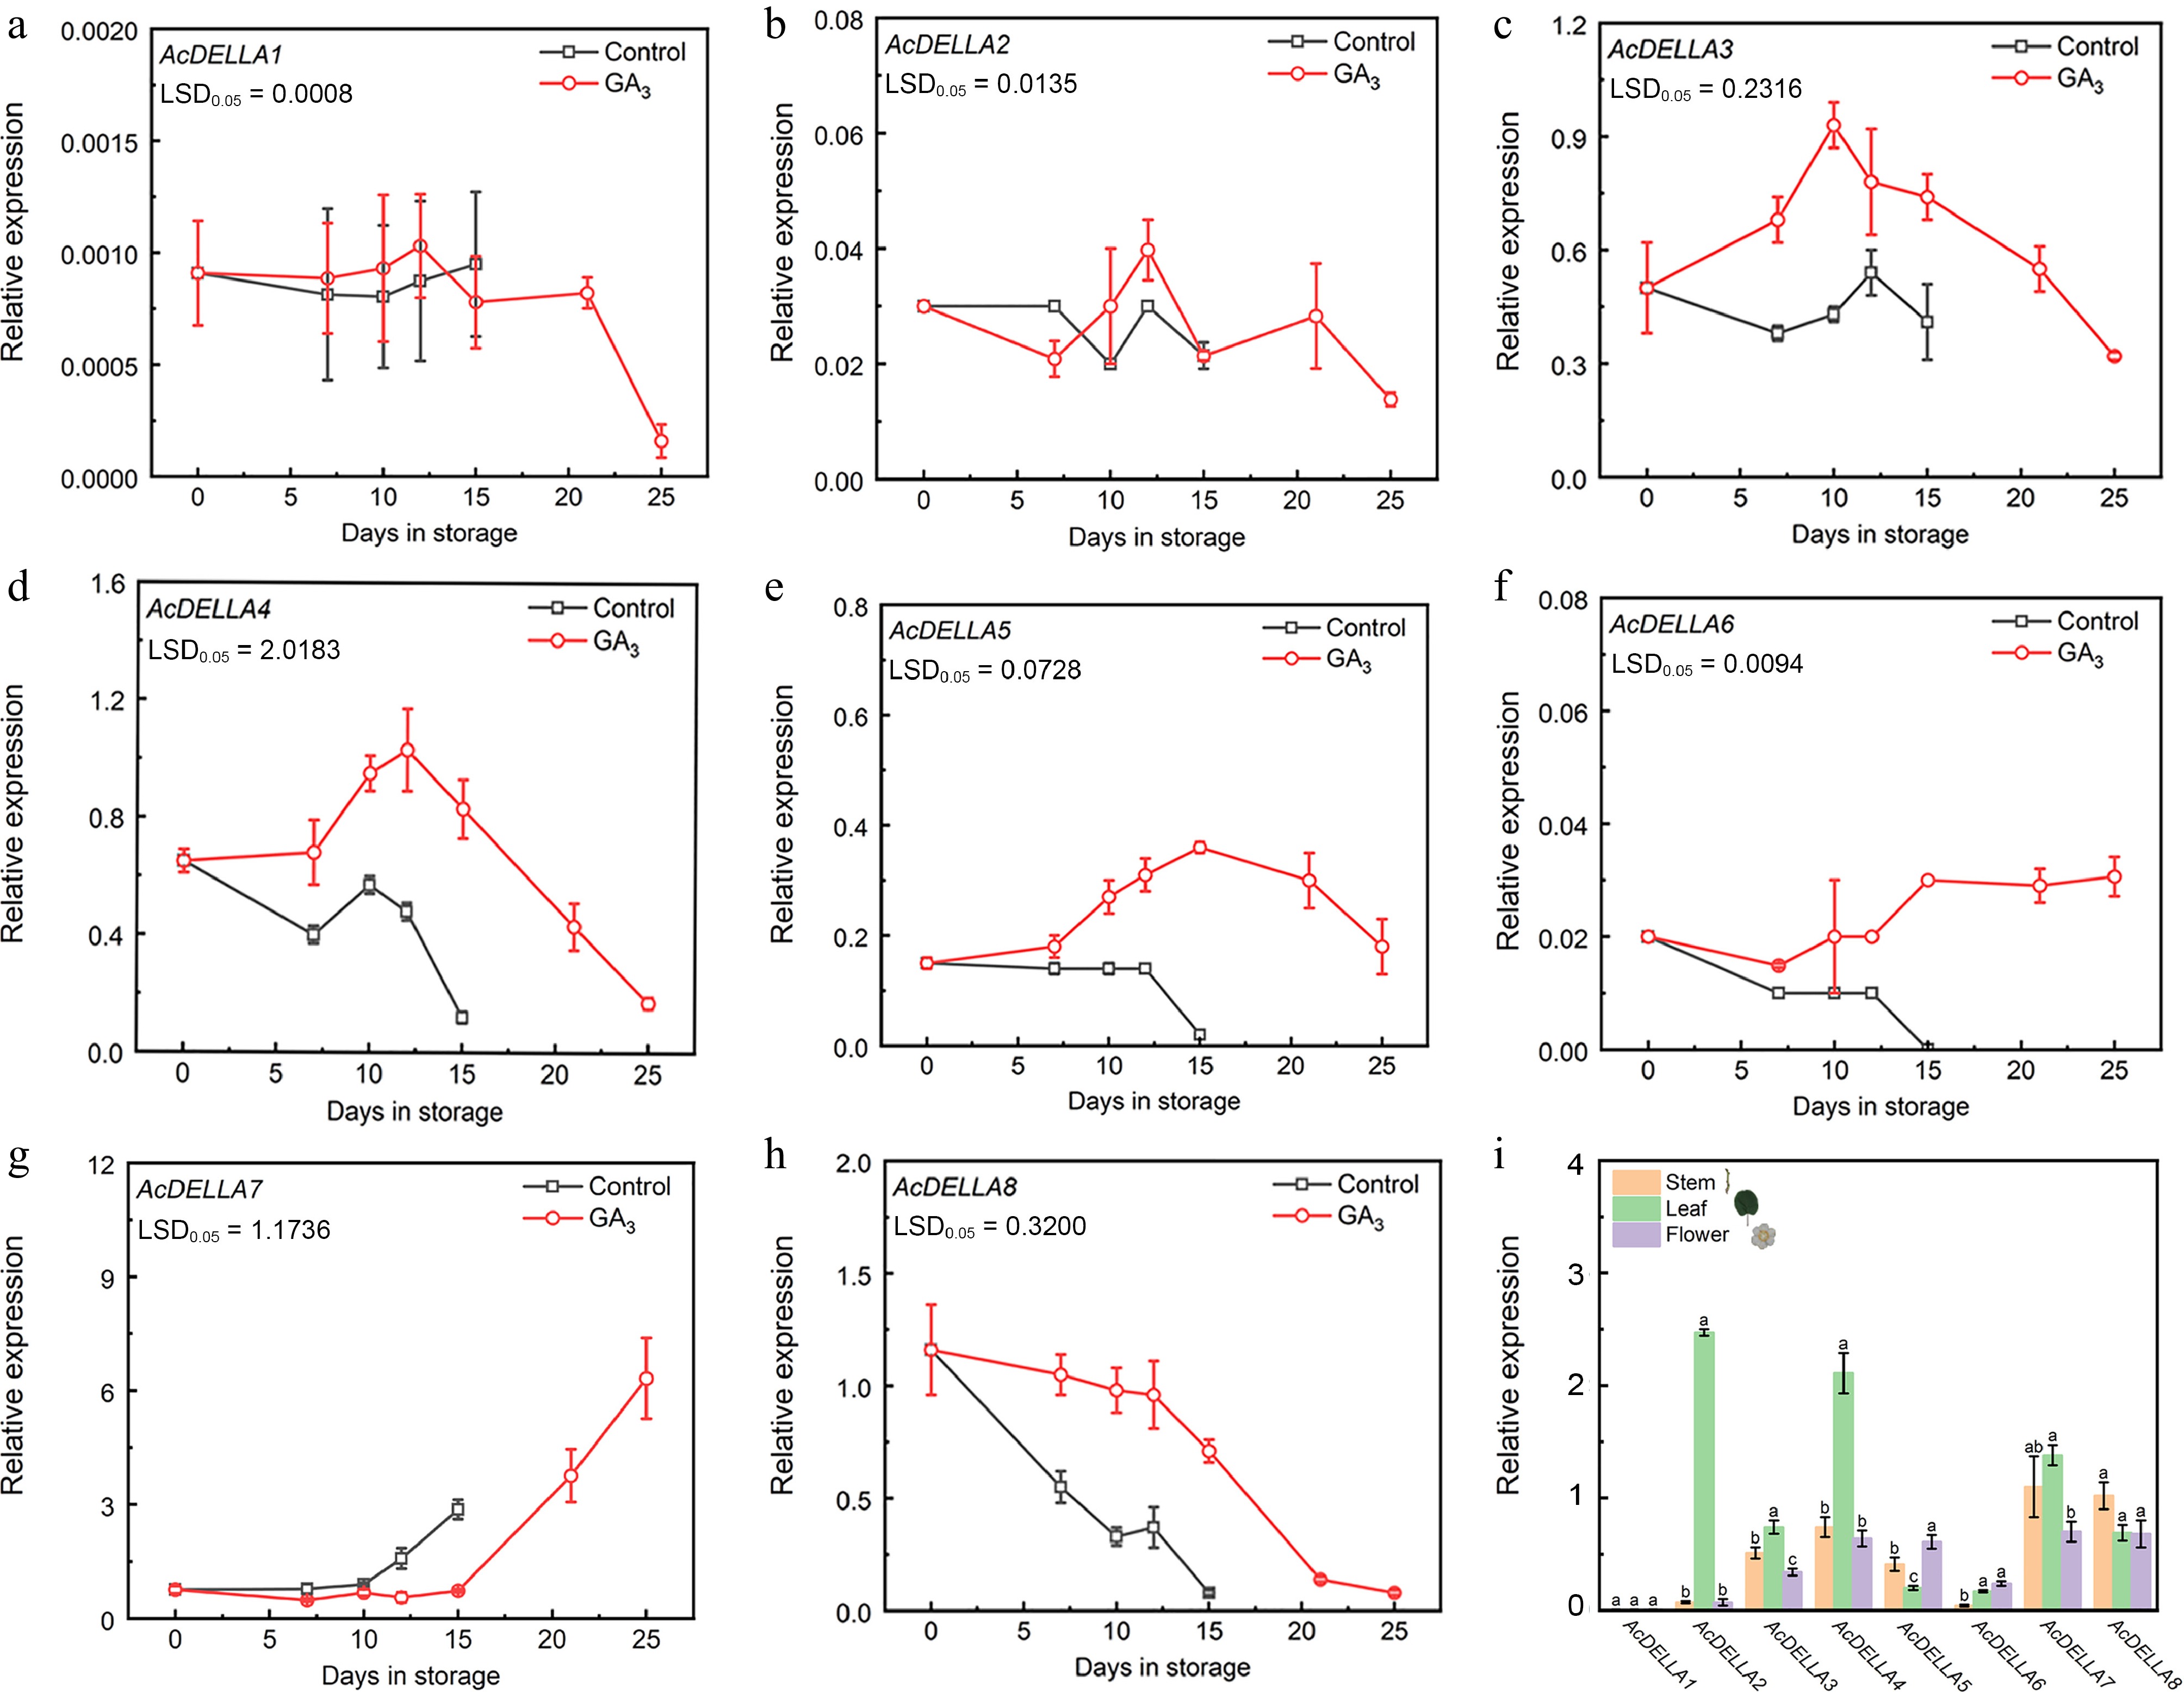
Figure 6.
qRT-PCR analysis of eight DELLAs expression patterns in 'Cuixiang' kiwifruit. (a) AcDELLA1. (b) AcDELLA2. (c) AcDELLA3. (d) AcDELLA4. (e) AcDELLA5. (f) AcDELLA6. (g) AcDELLA7. (h) AcDELLA8. (i) Expression of eight DELLAs at different tissues. Error bars indicate SE from three replicates. LSD values indicate LSD at p = 0.05. Analysis of variance (ANOVA) conducted using SPSS indicated that the observed differences between letters (a−c) at p < 0.05 were statistically significant.
-
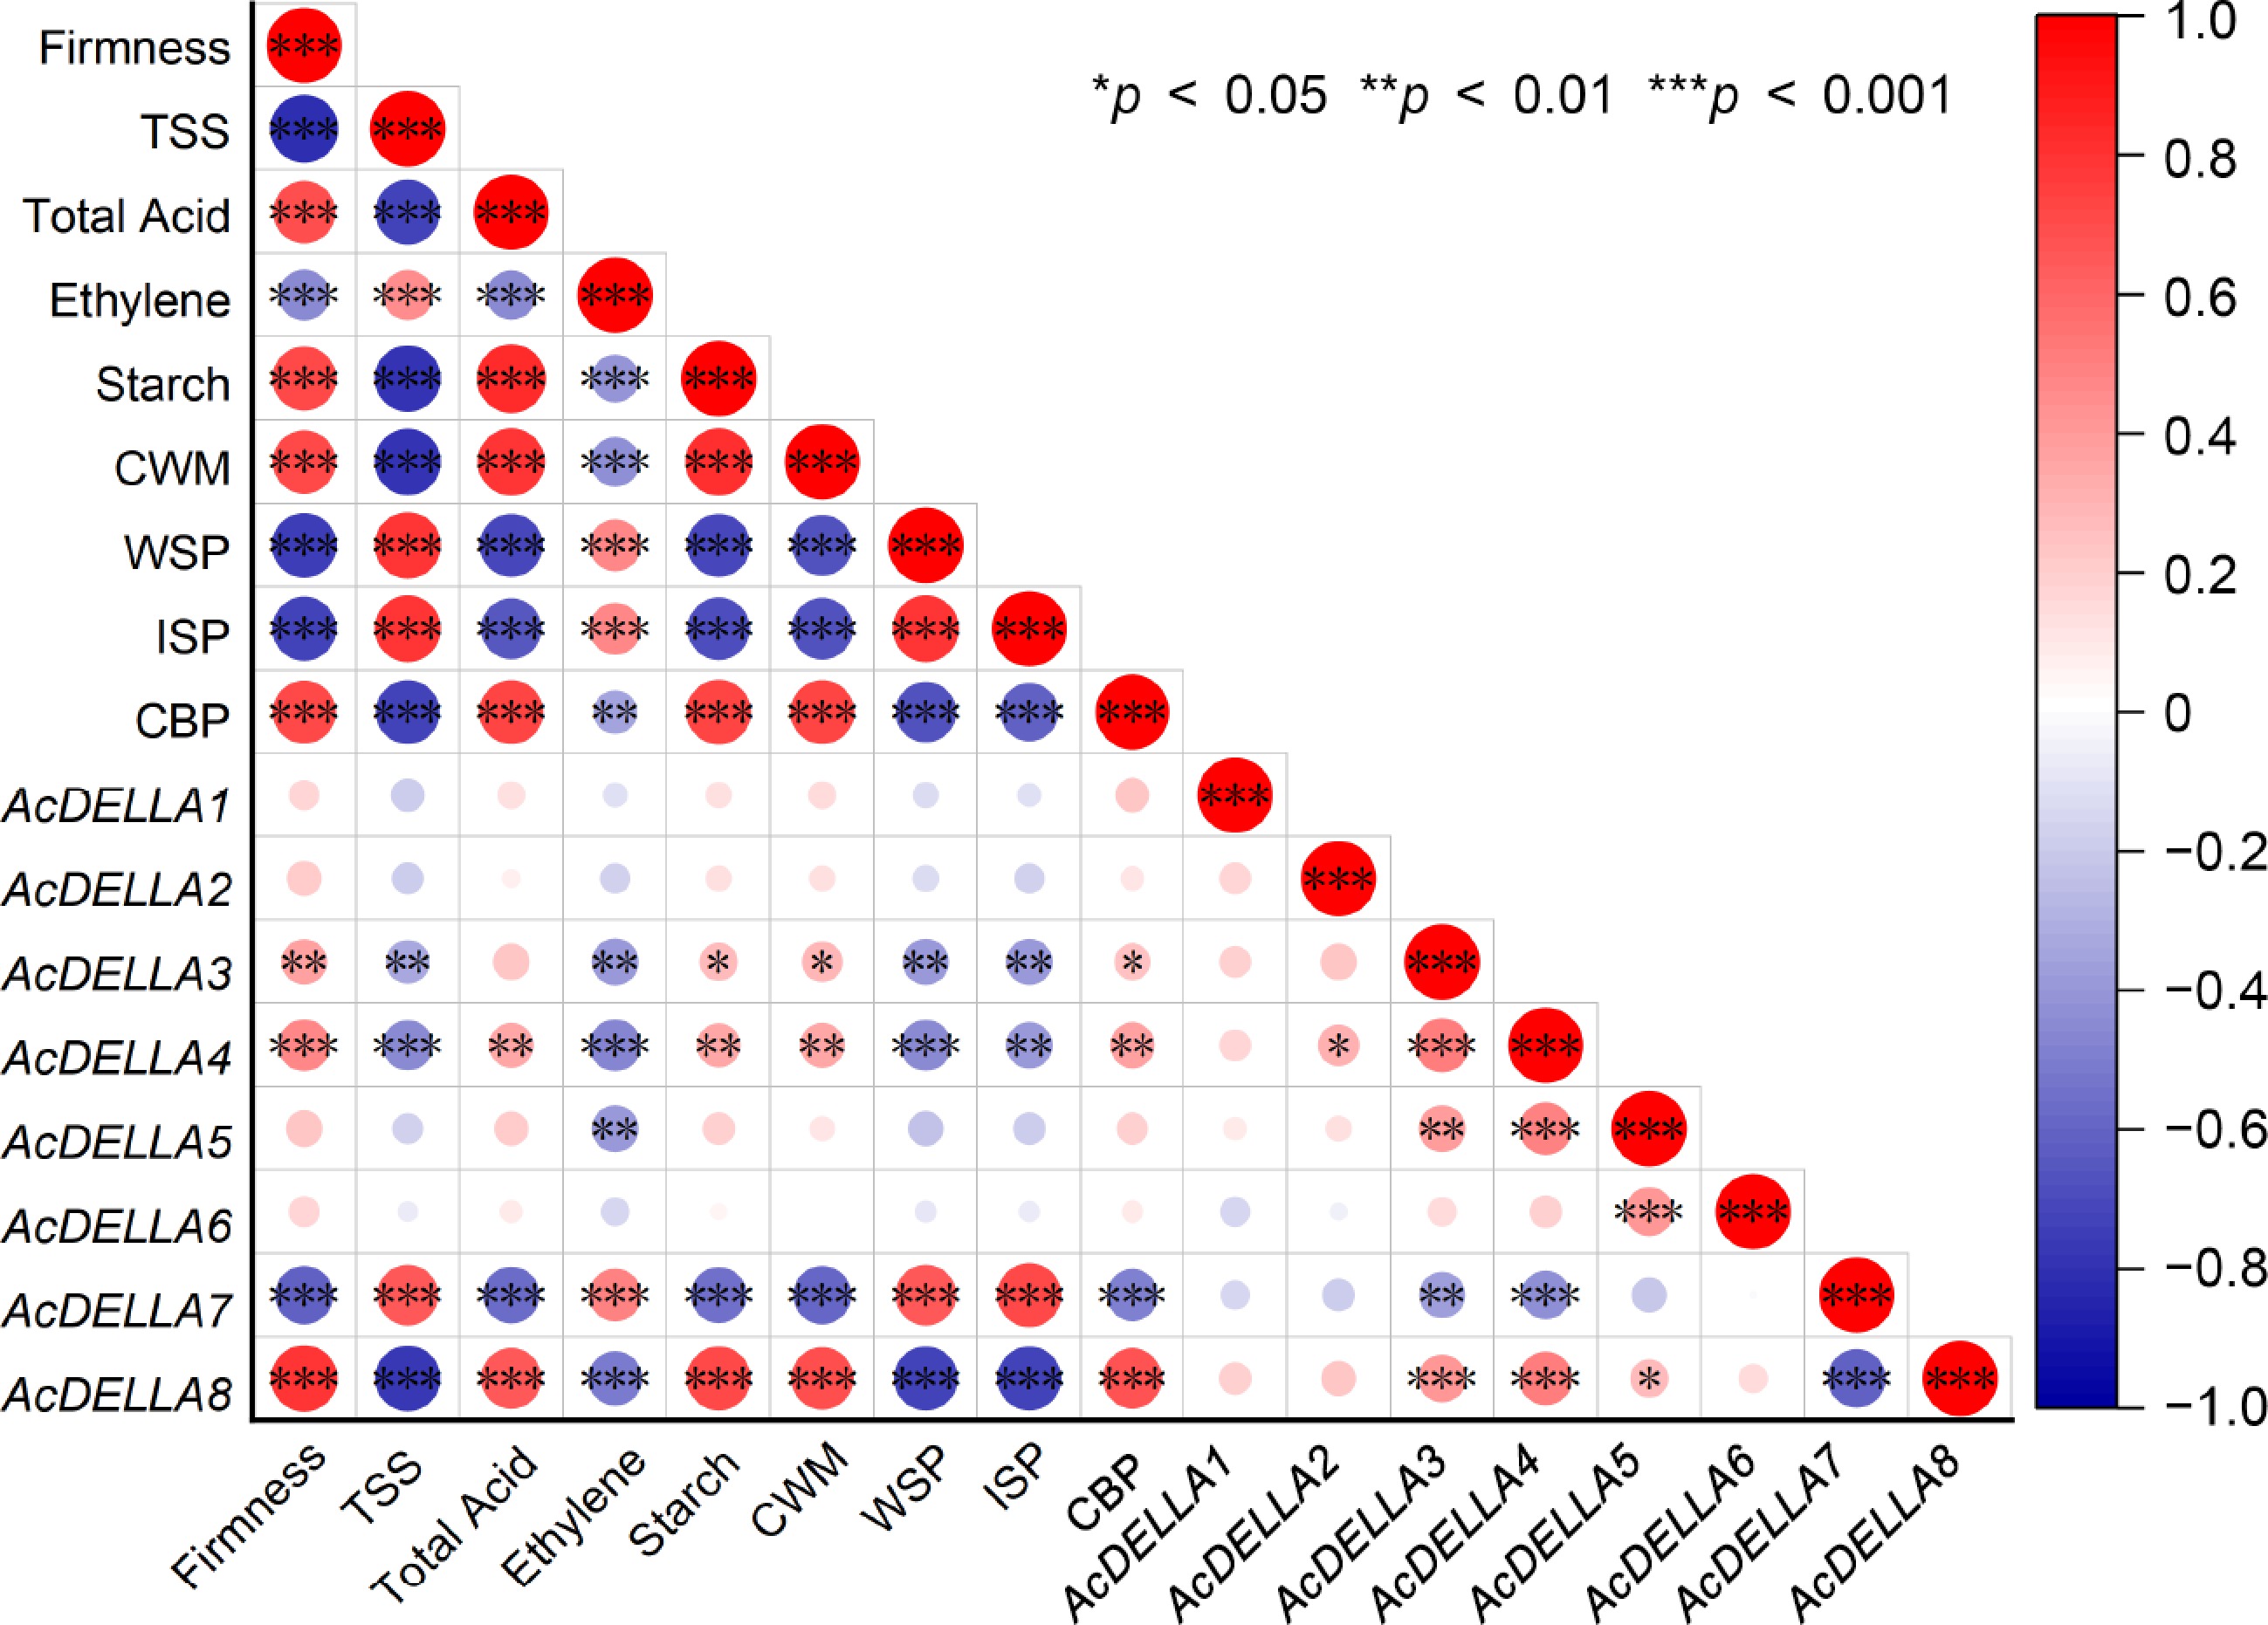
Figure 7.
Correlation analysis of AcDELLA genes expression with physiological characteristics and cell wall composition during storage in kiwifruit. The presence of positive and negative correlations is denoted through the use of color coding, with red signifying a positive correlation and blue indicating a negative one (*, p < 0.05, **, p < 0.01 and ***, p < 0.001).
Figures
(7)
Tables
(0)