-
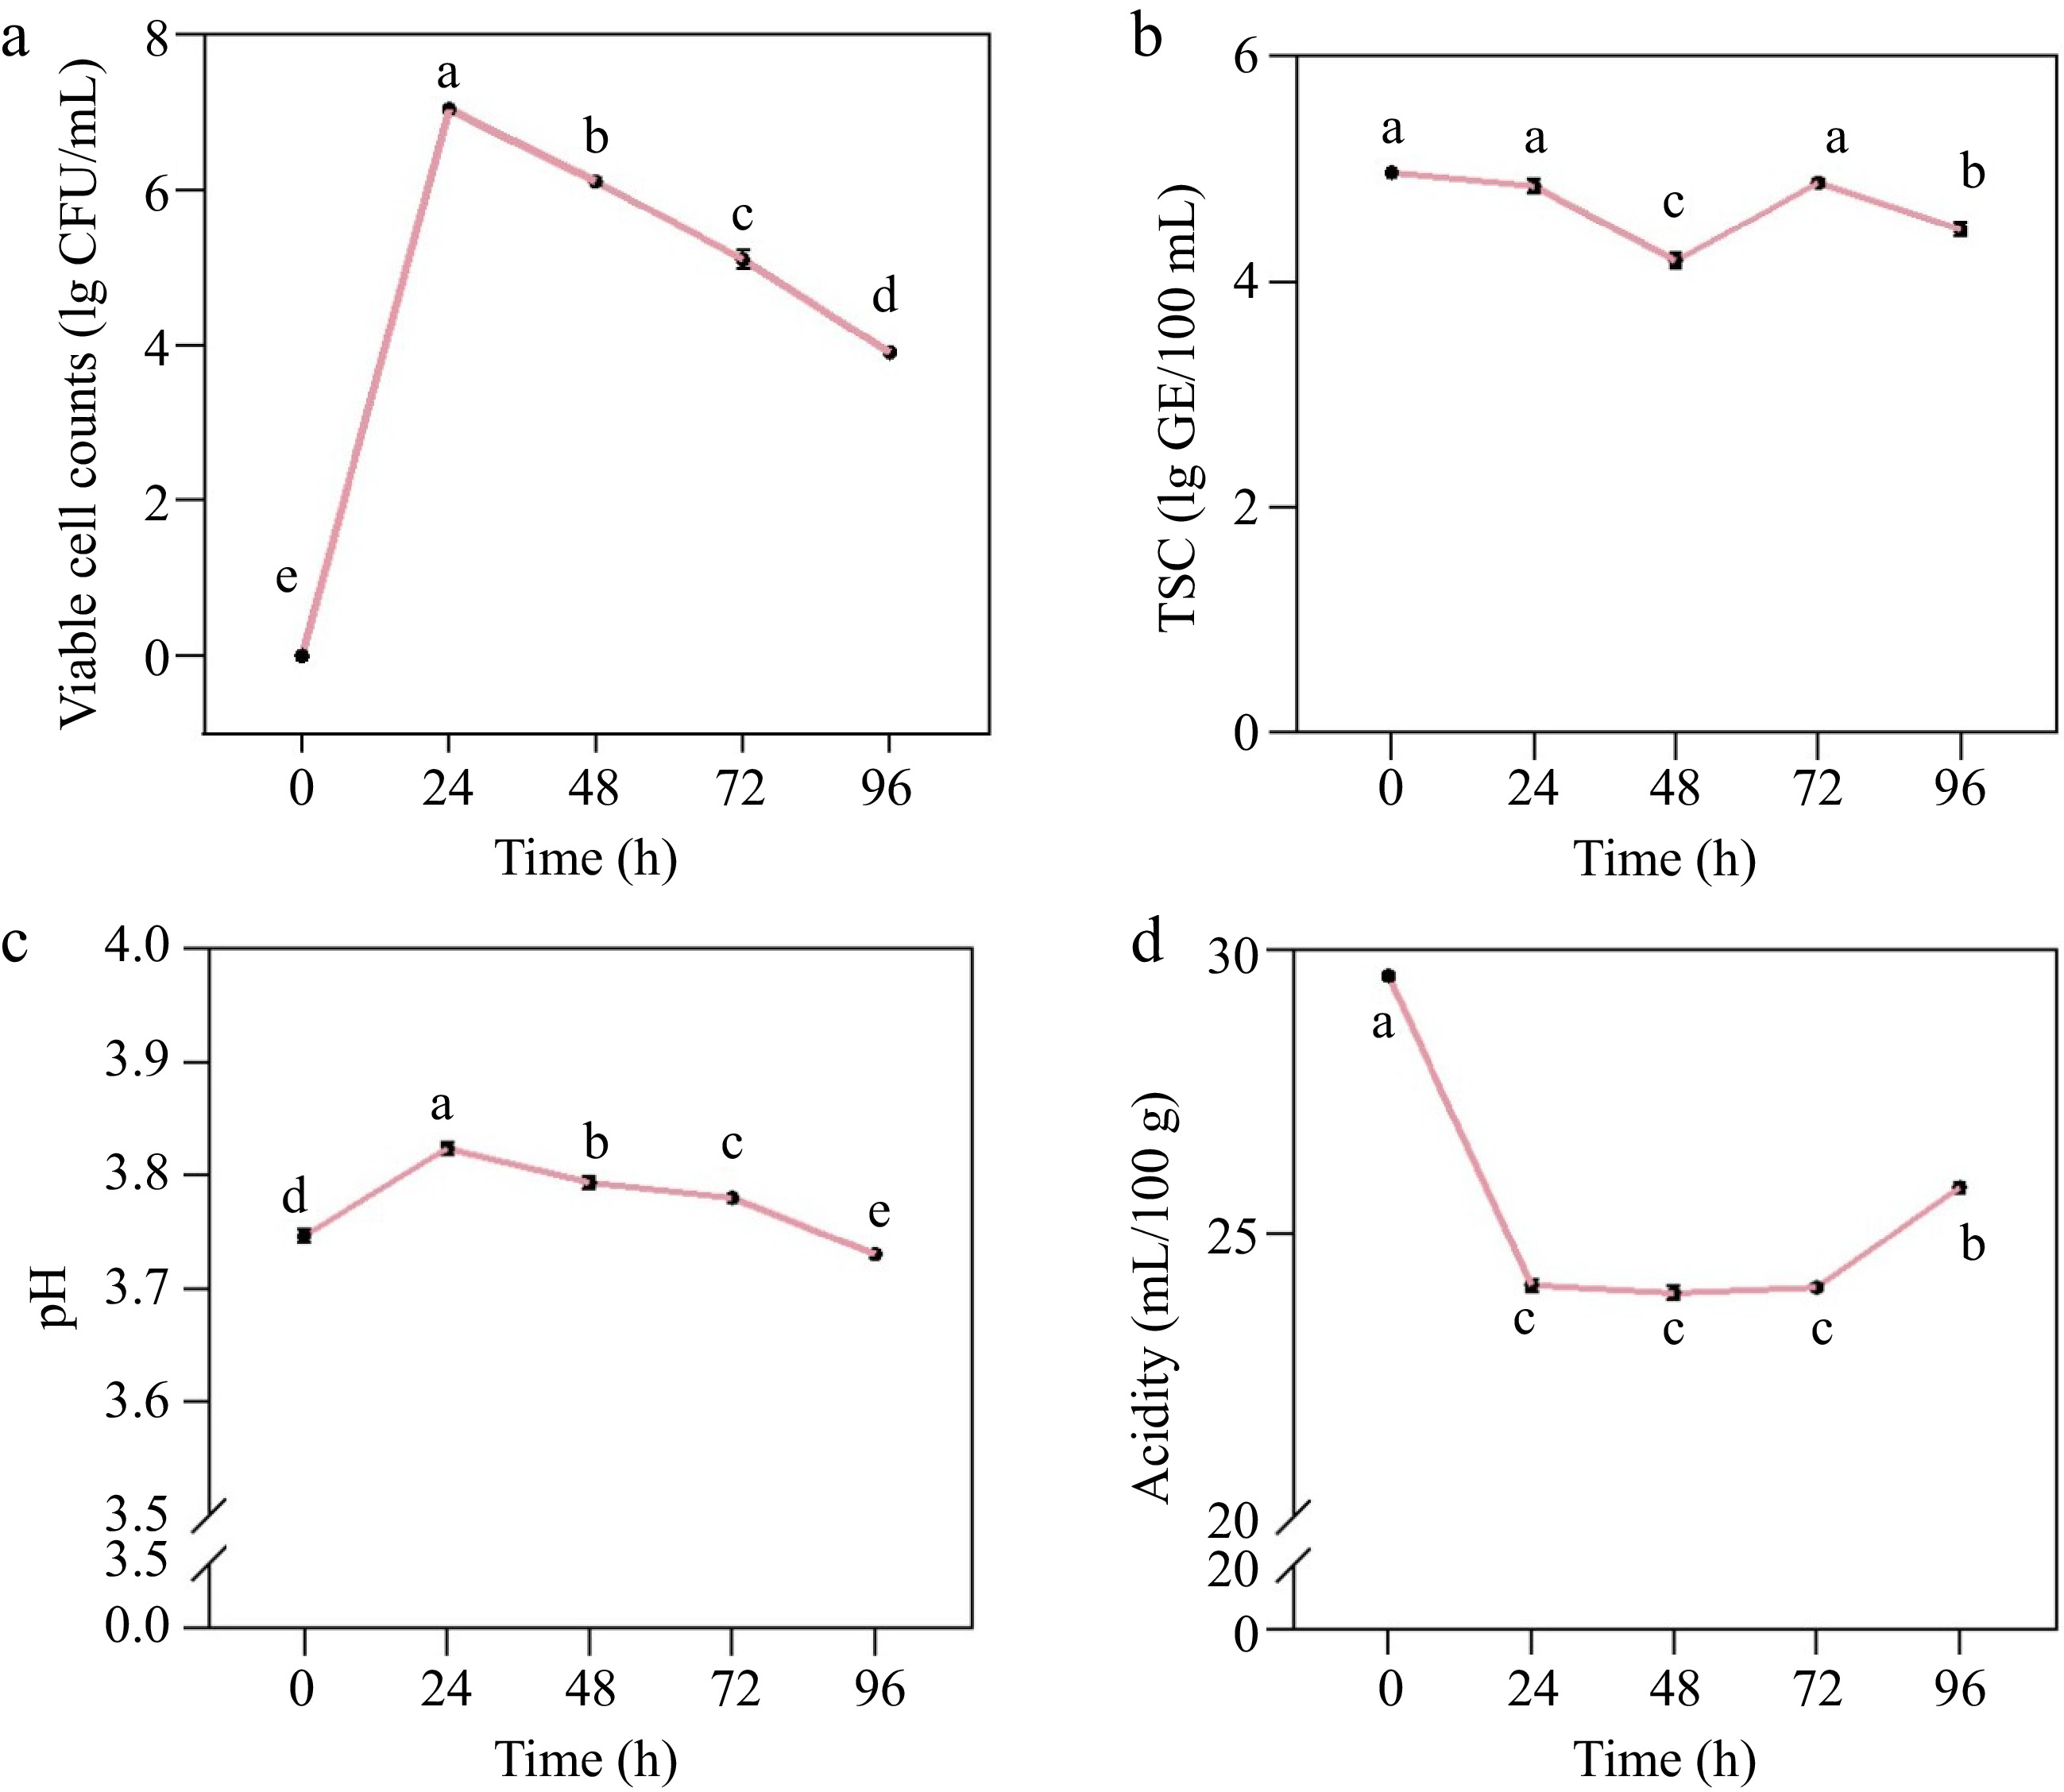
Figure 1.
Microbial and physicochemical properties of Aronia melanocarpa juice with different fermenting times. (a) Viable cell counts, (b) TSC, (c) pH, (d) acidity. Means of different lowercase letters are significant differences (p < 0.05).
-
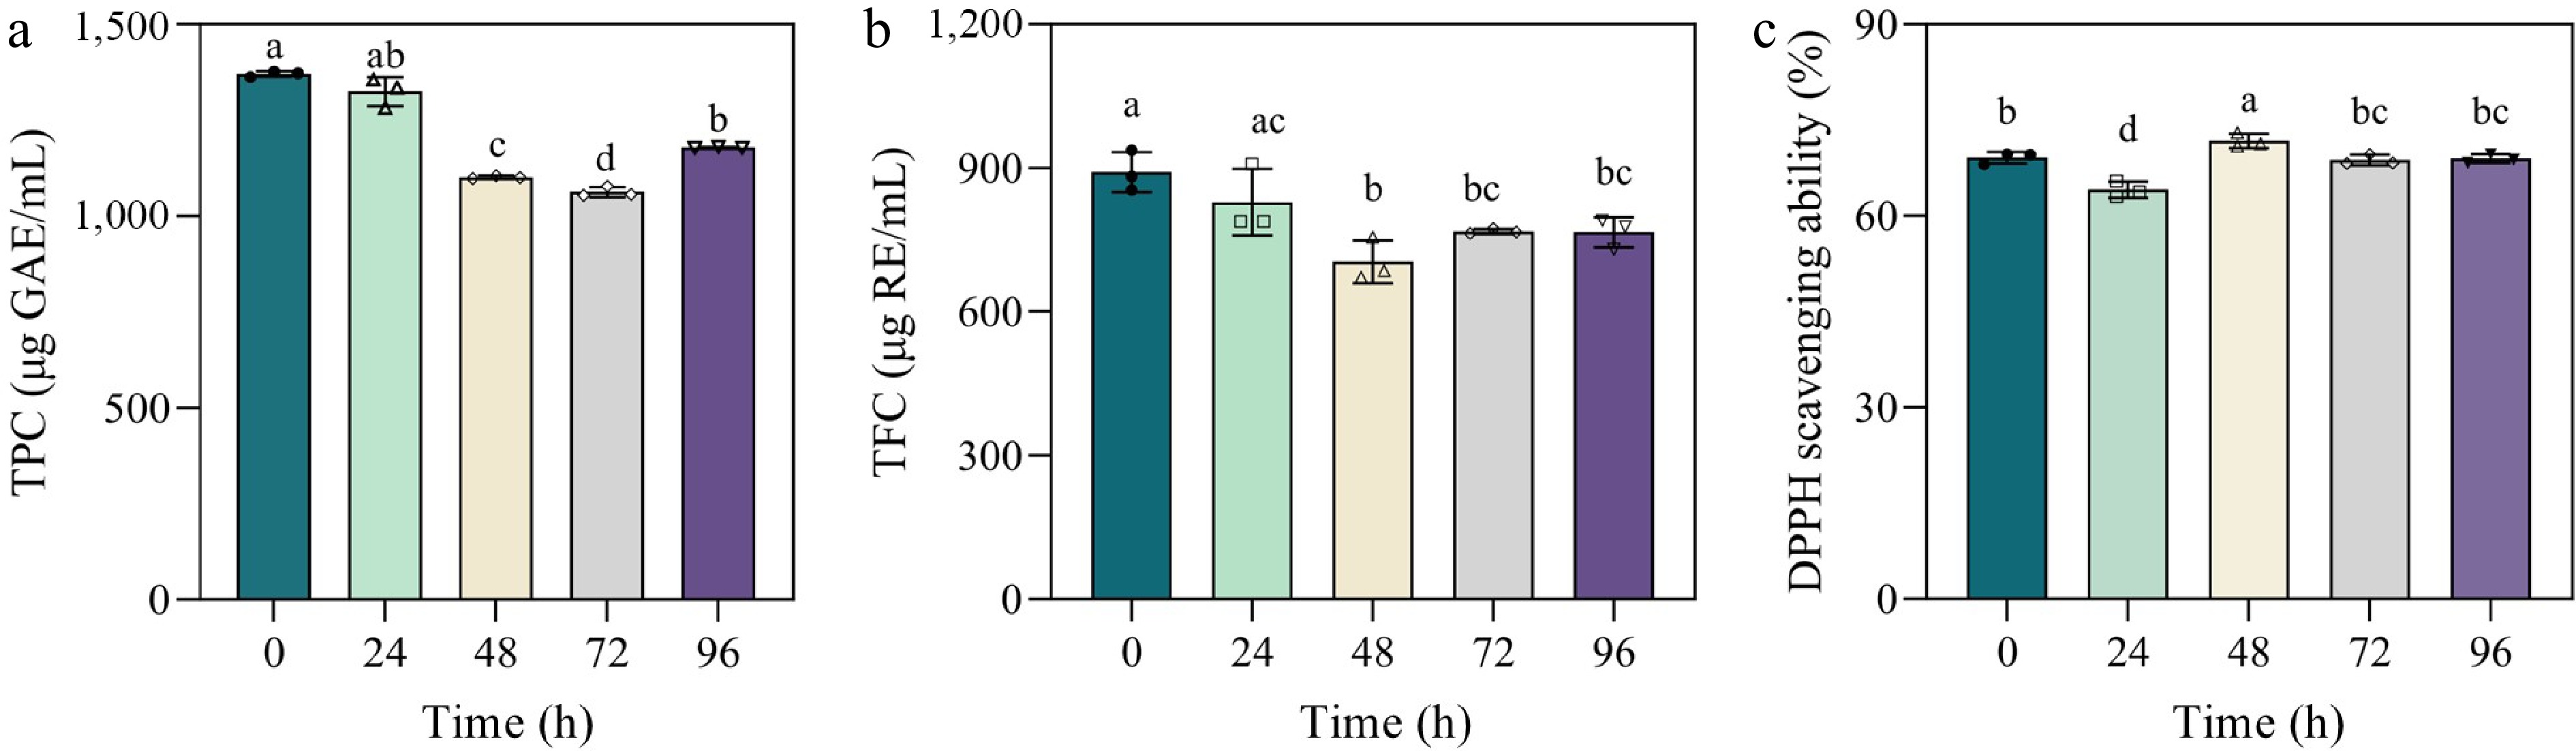
Figure 2.
Antioxidant activity of Aronia melanocarpa juice with different fermenting times. (a) TPC, (b) TFC, (c) DPPH scavenging activity. Means of different lowercase letters are significant differences (p < 0.05).
-
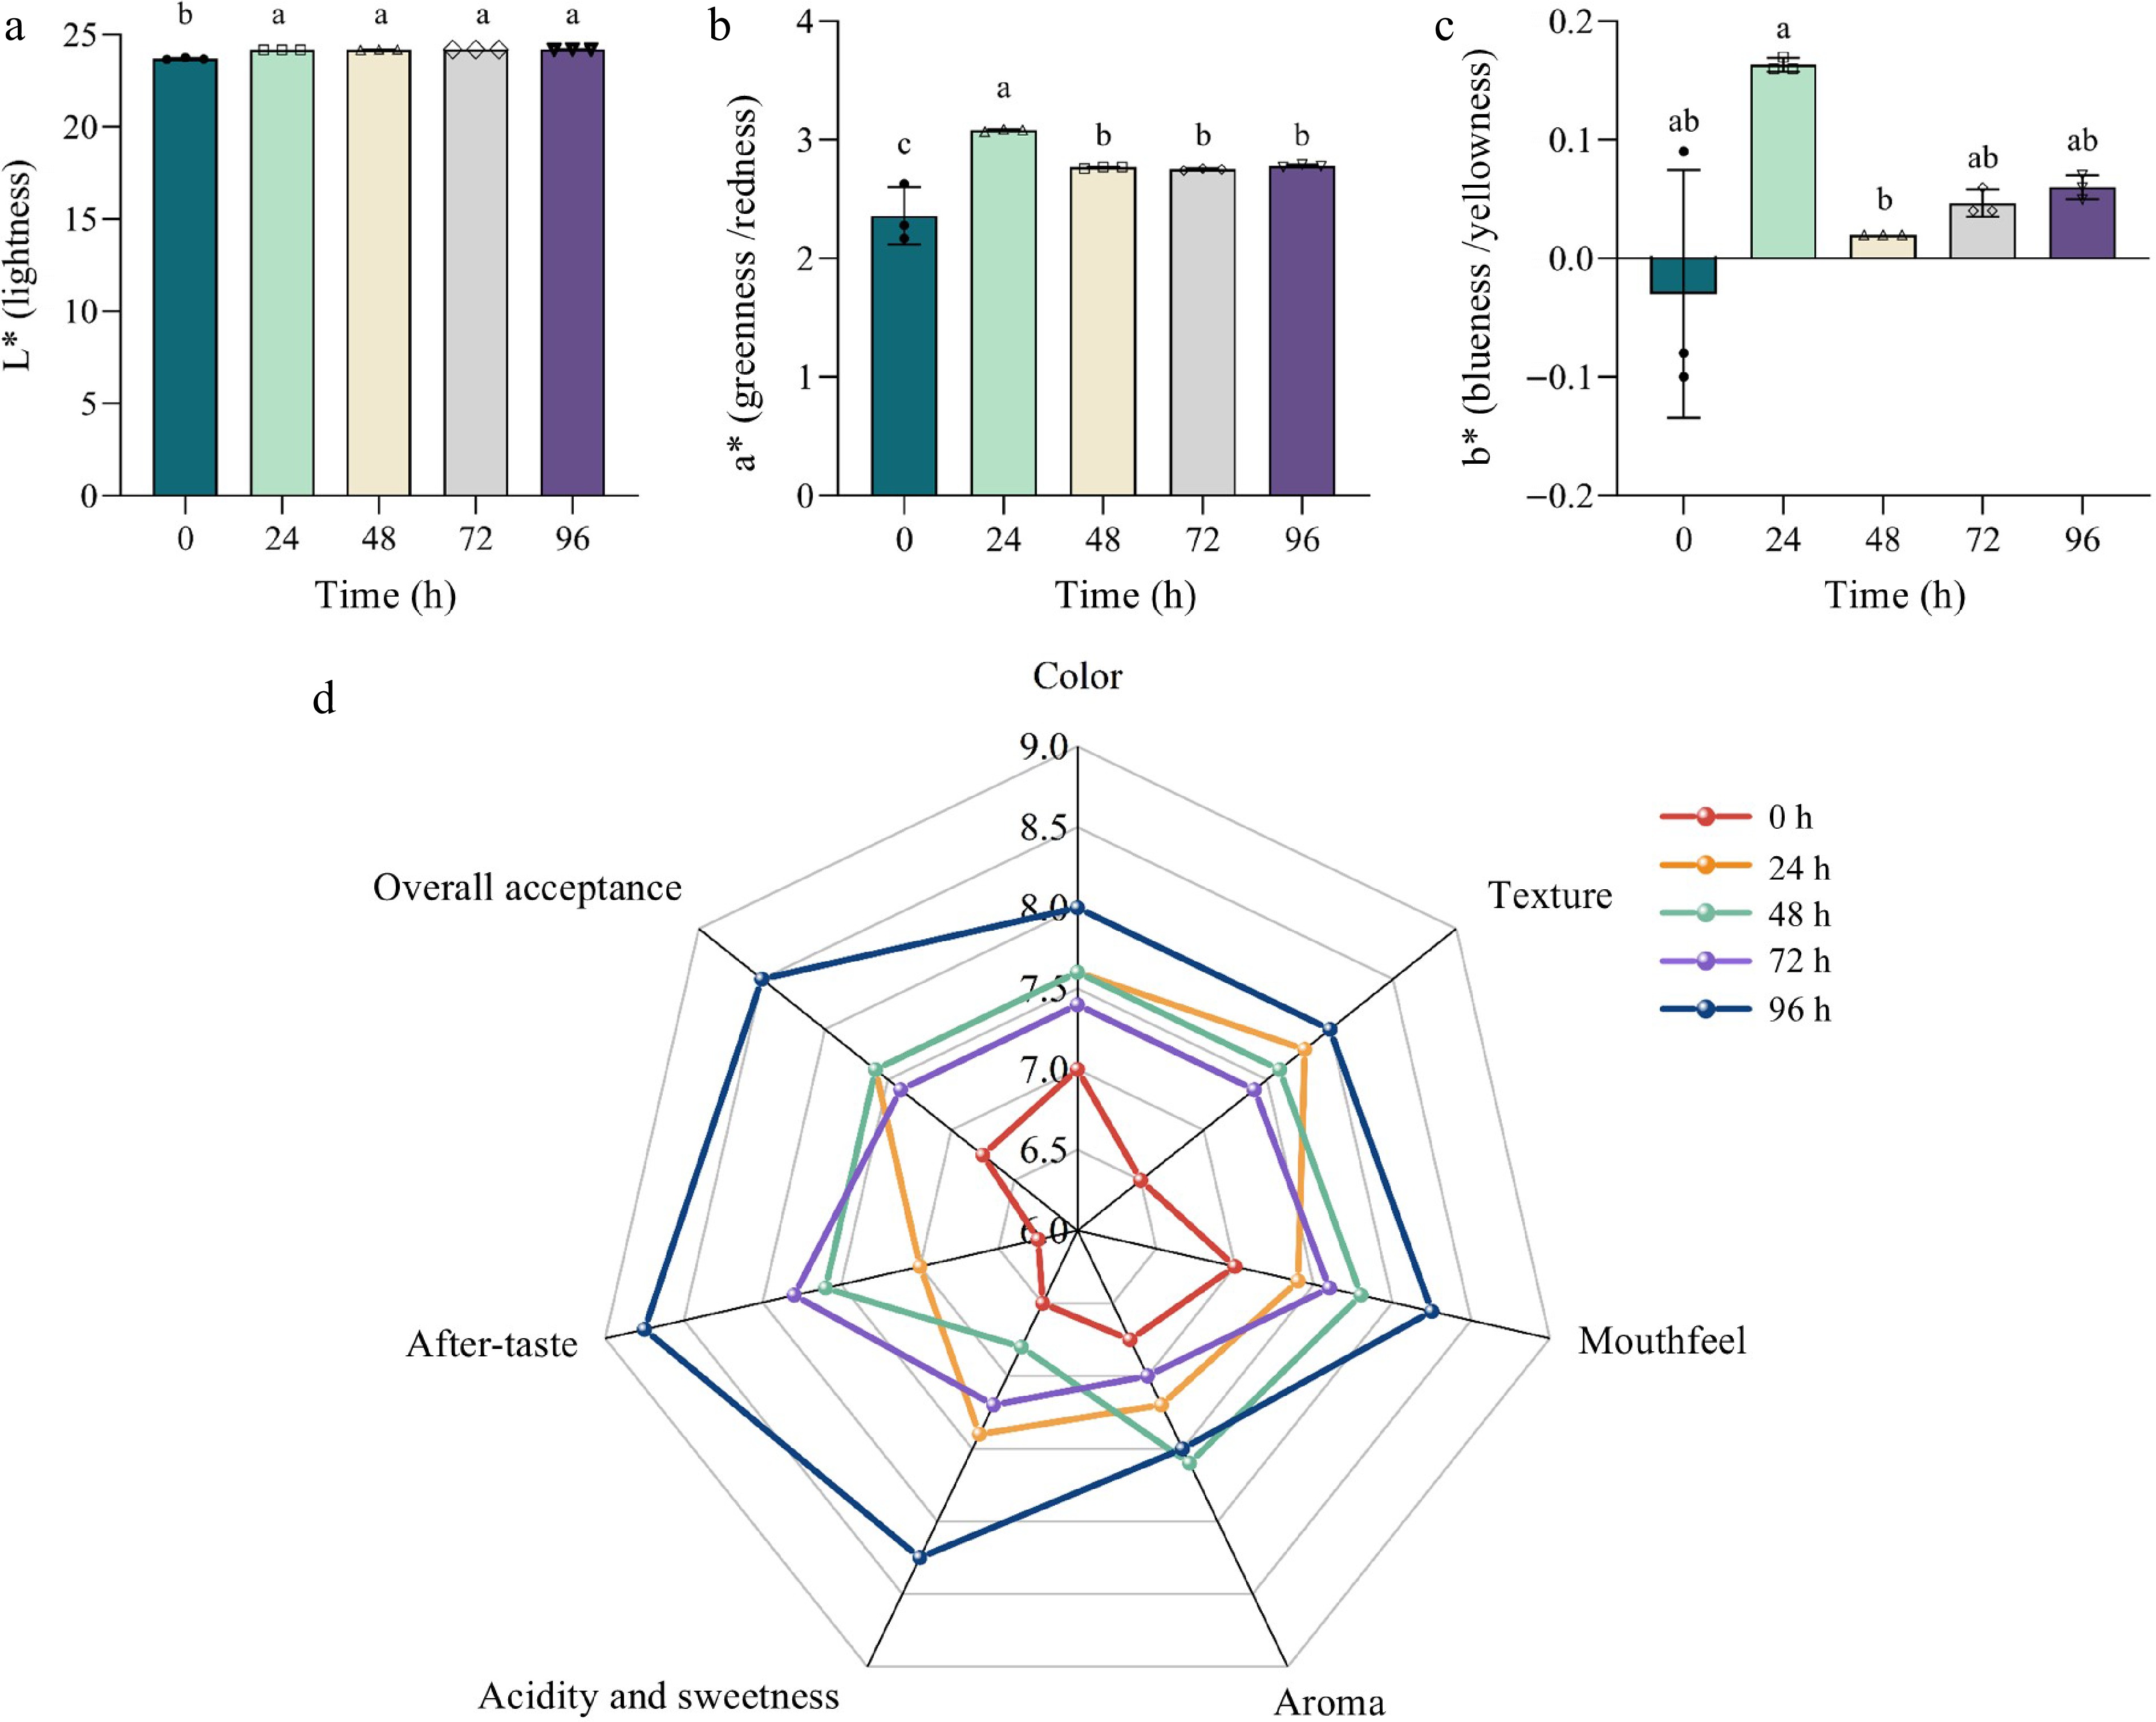
Figure 3.
Color indices and sensory scores of Aronia melanocarpa juice. (a) L* value, (b) a* value, (c) b* value, (d) radar chart of sensory evaluations. Means of different lowercase letters are significant differences (p < 0.05).
-
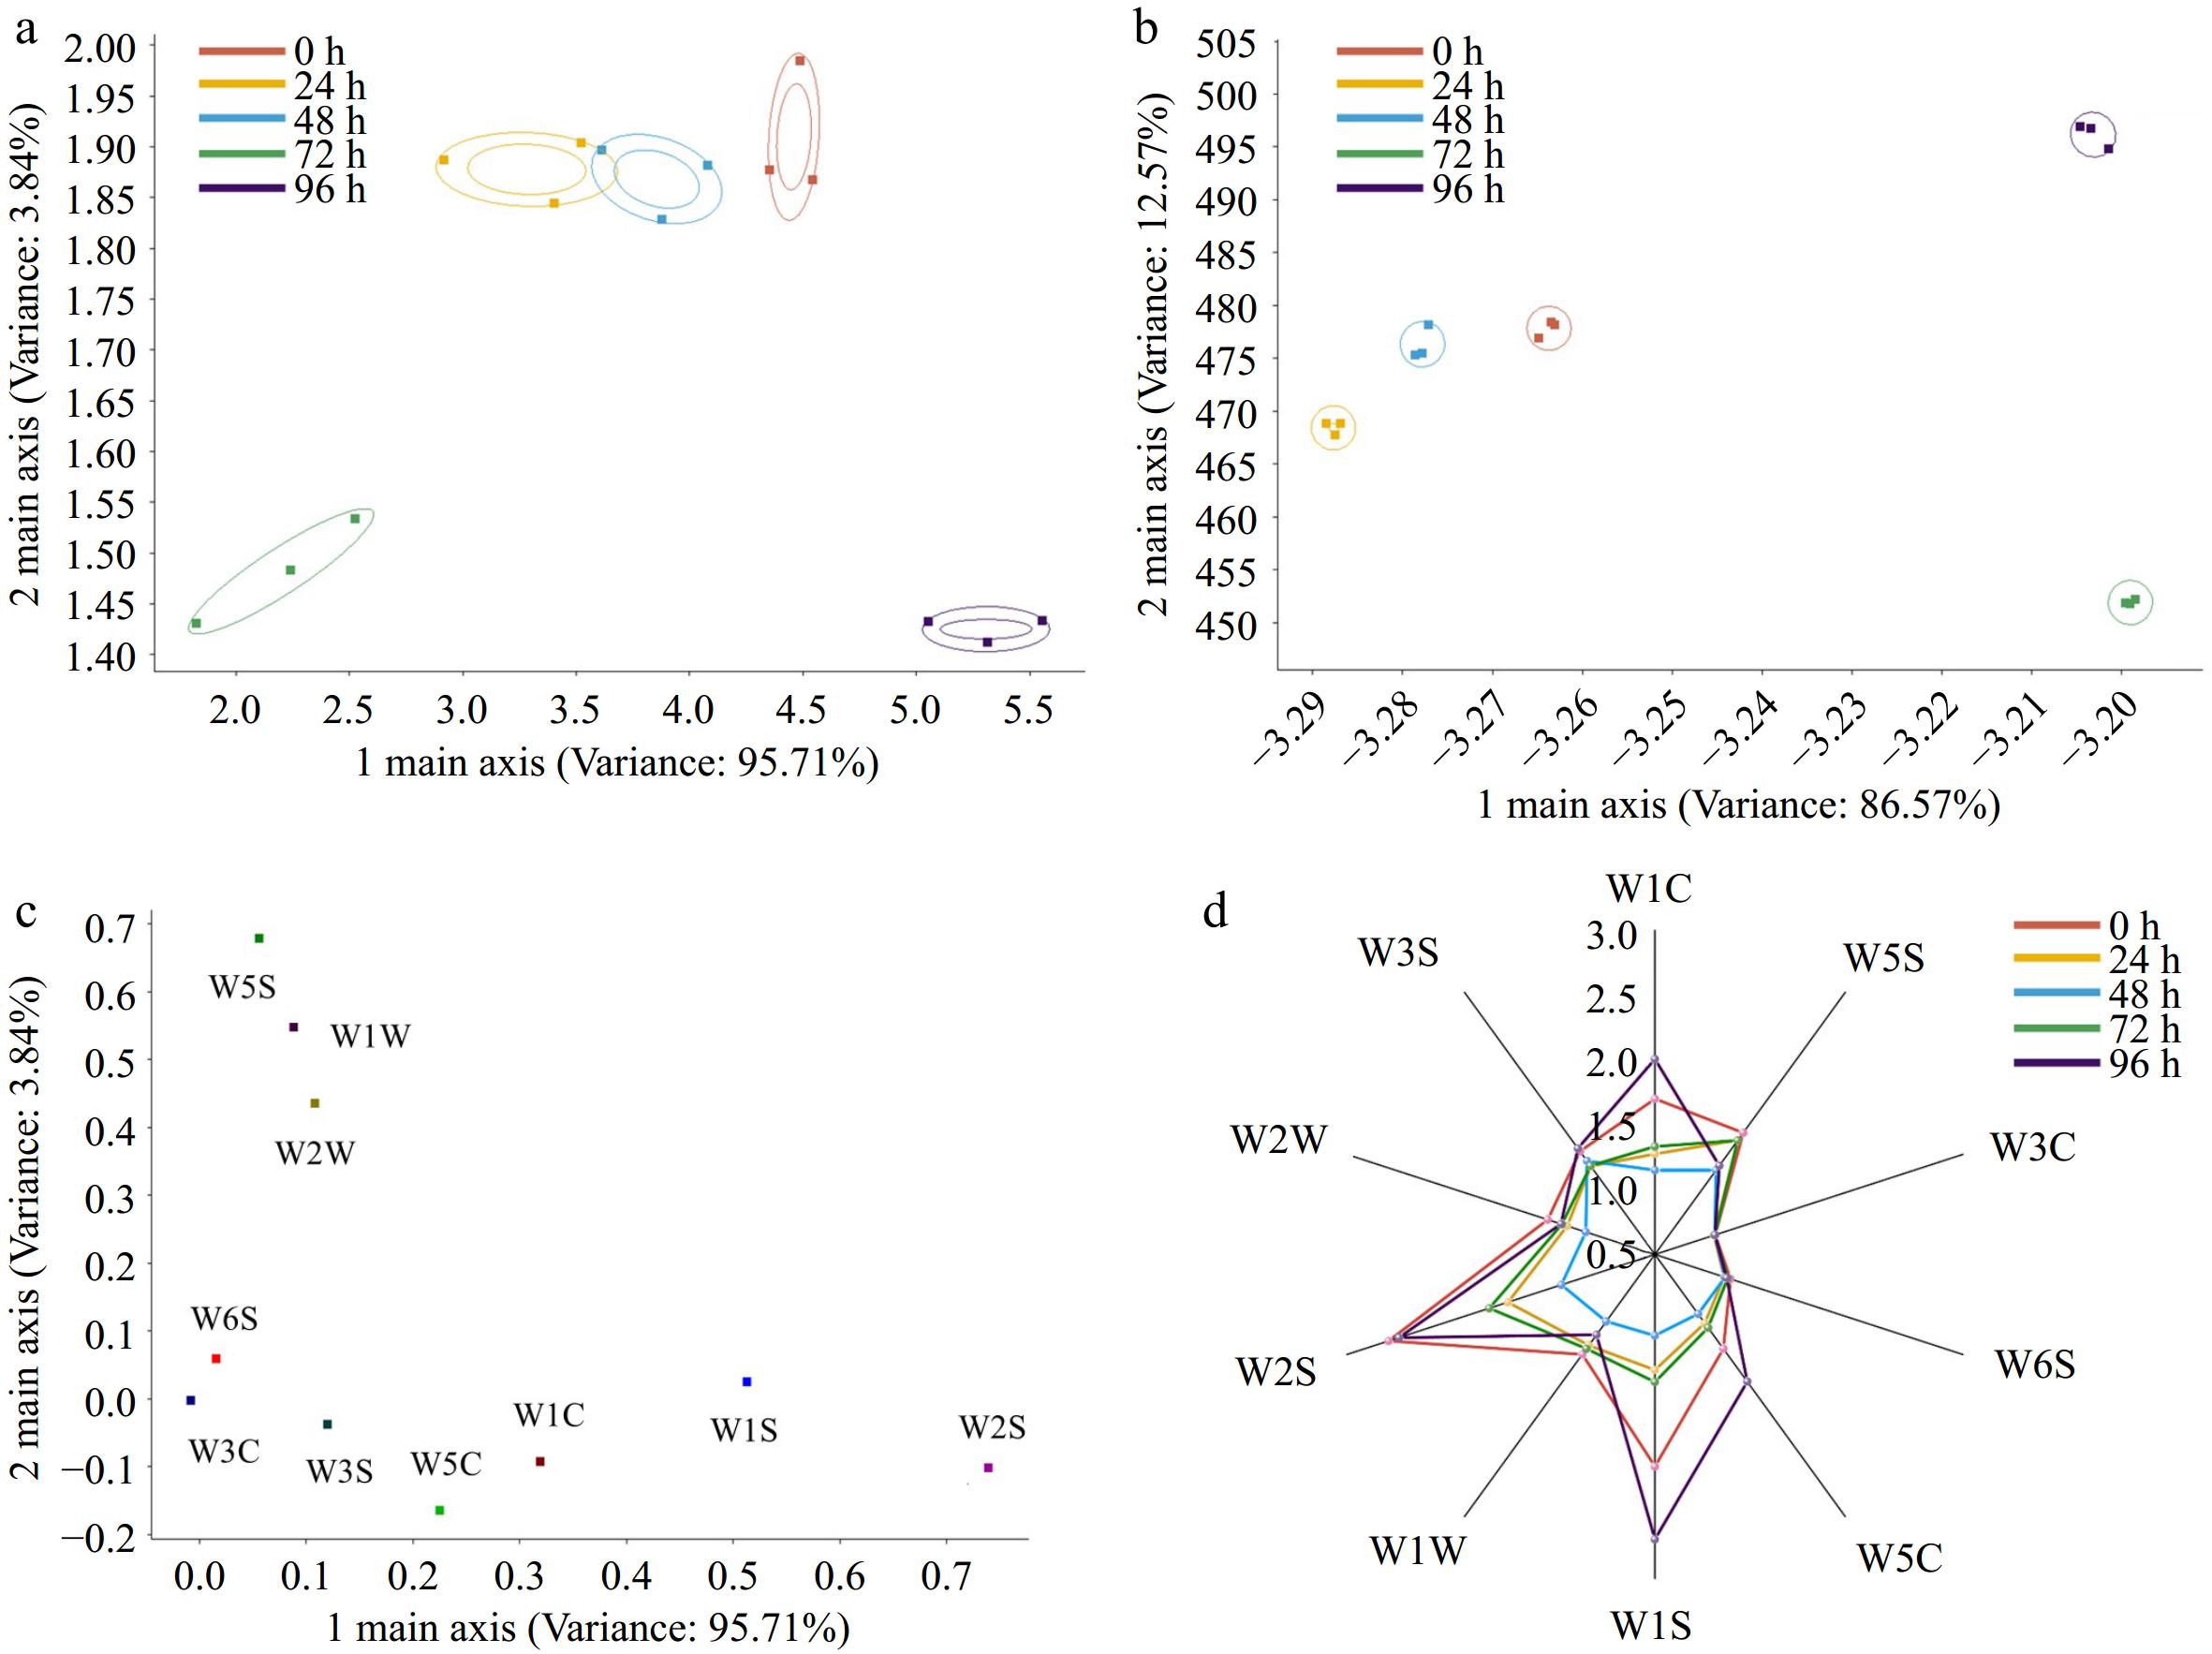
Figure 4.
E-nose analysis. (a) Principal analysis plot, (b) linear discriminant analysis plot, (c) loading plot, (d) radar chart of E-nose sensors.
-
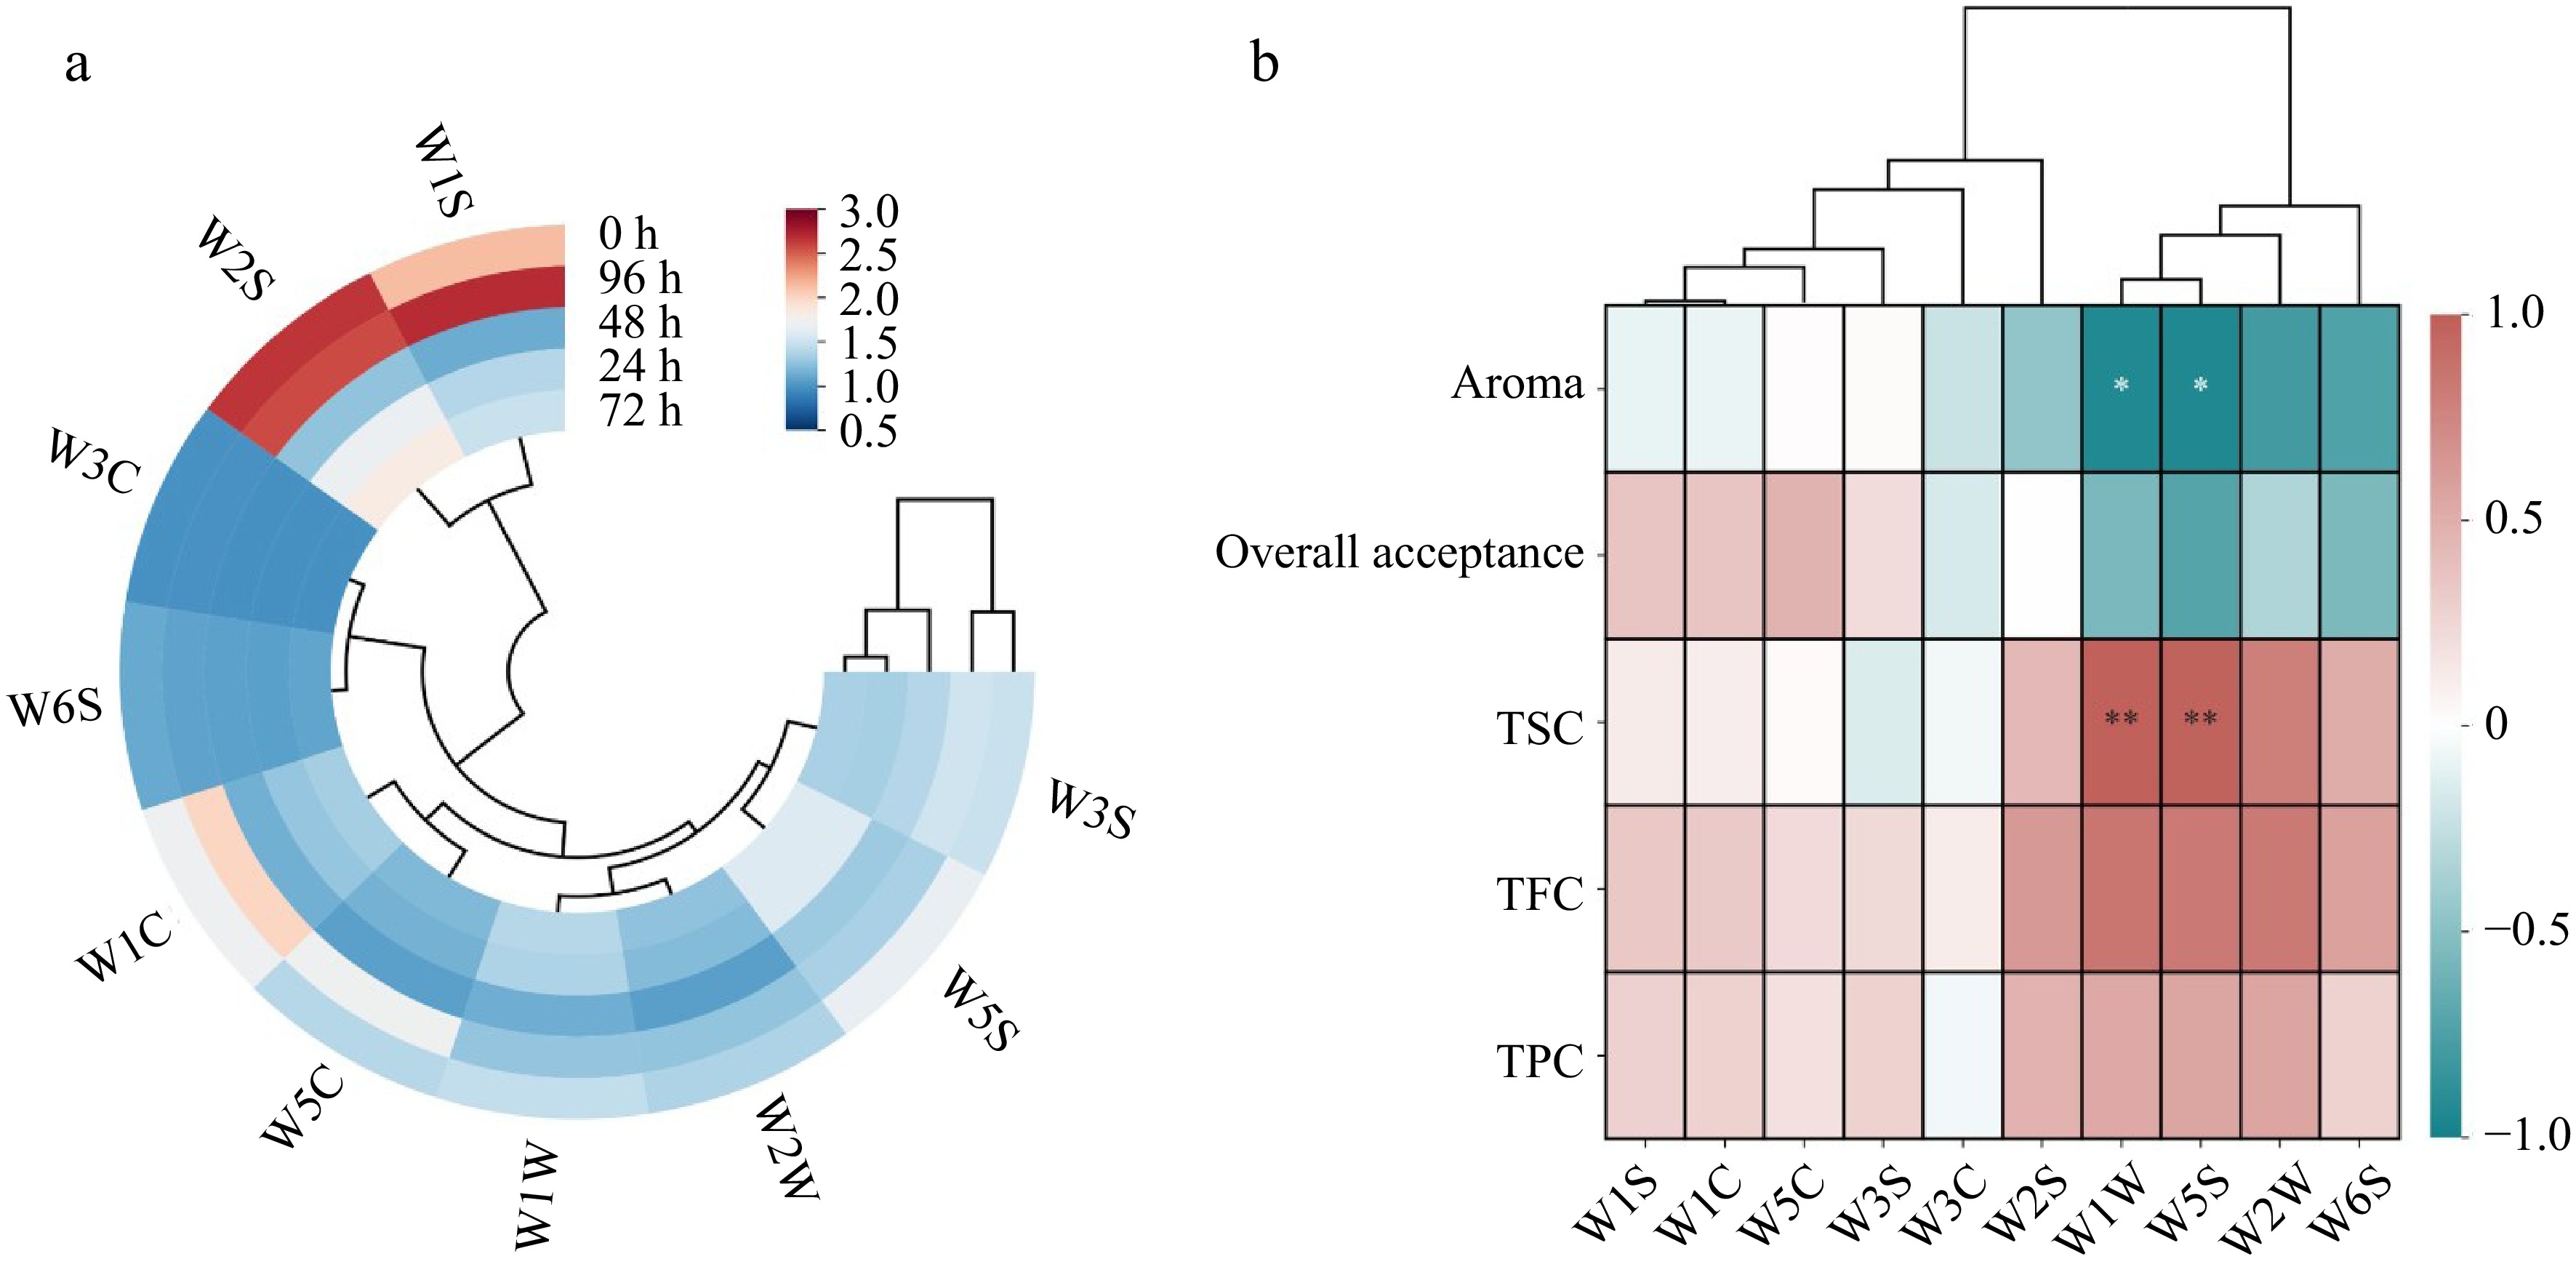
Figure 5.
Circle heatmap of correlation analysis between (a) fermenting times and E-nose sensors. The color bar ranged from blue to red, representing a positive correlation from 0.5 to 3. Double matrices correlation heatmap between (b) E-nose sensors and sensory evaluations in all fermenting times. * indicates significant mark (p < 0.05), ** indicates significant mark (p < 0.01). The color bar ranged from green to pink, representing a correlation relationship from negative to positive.
-
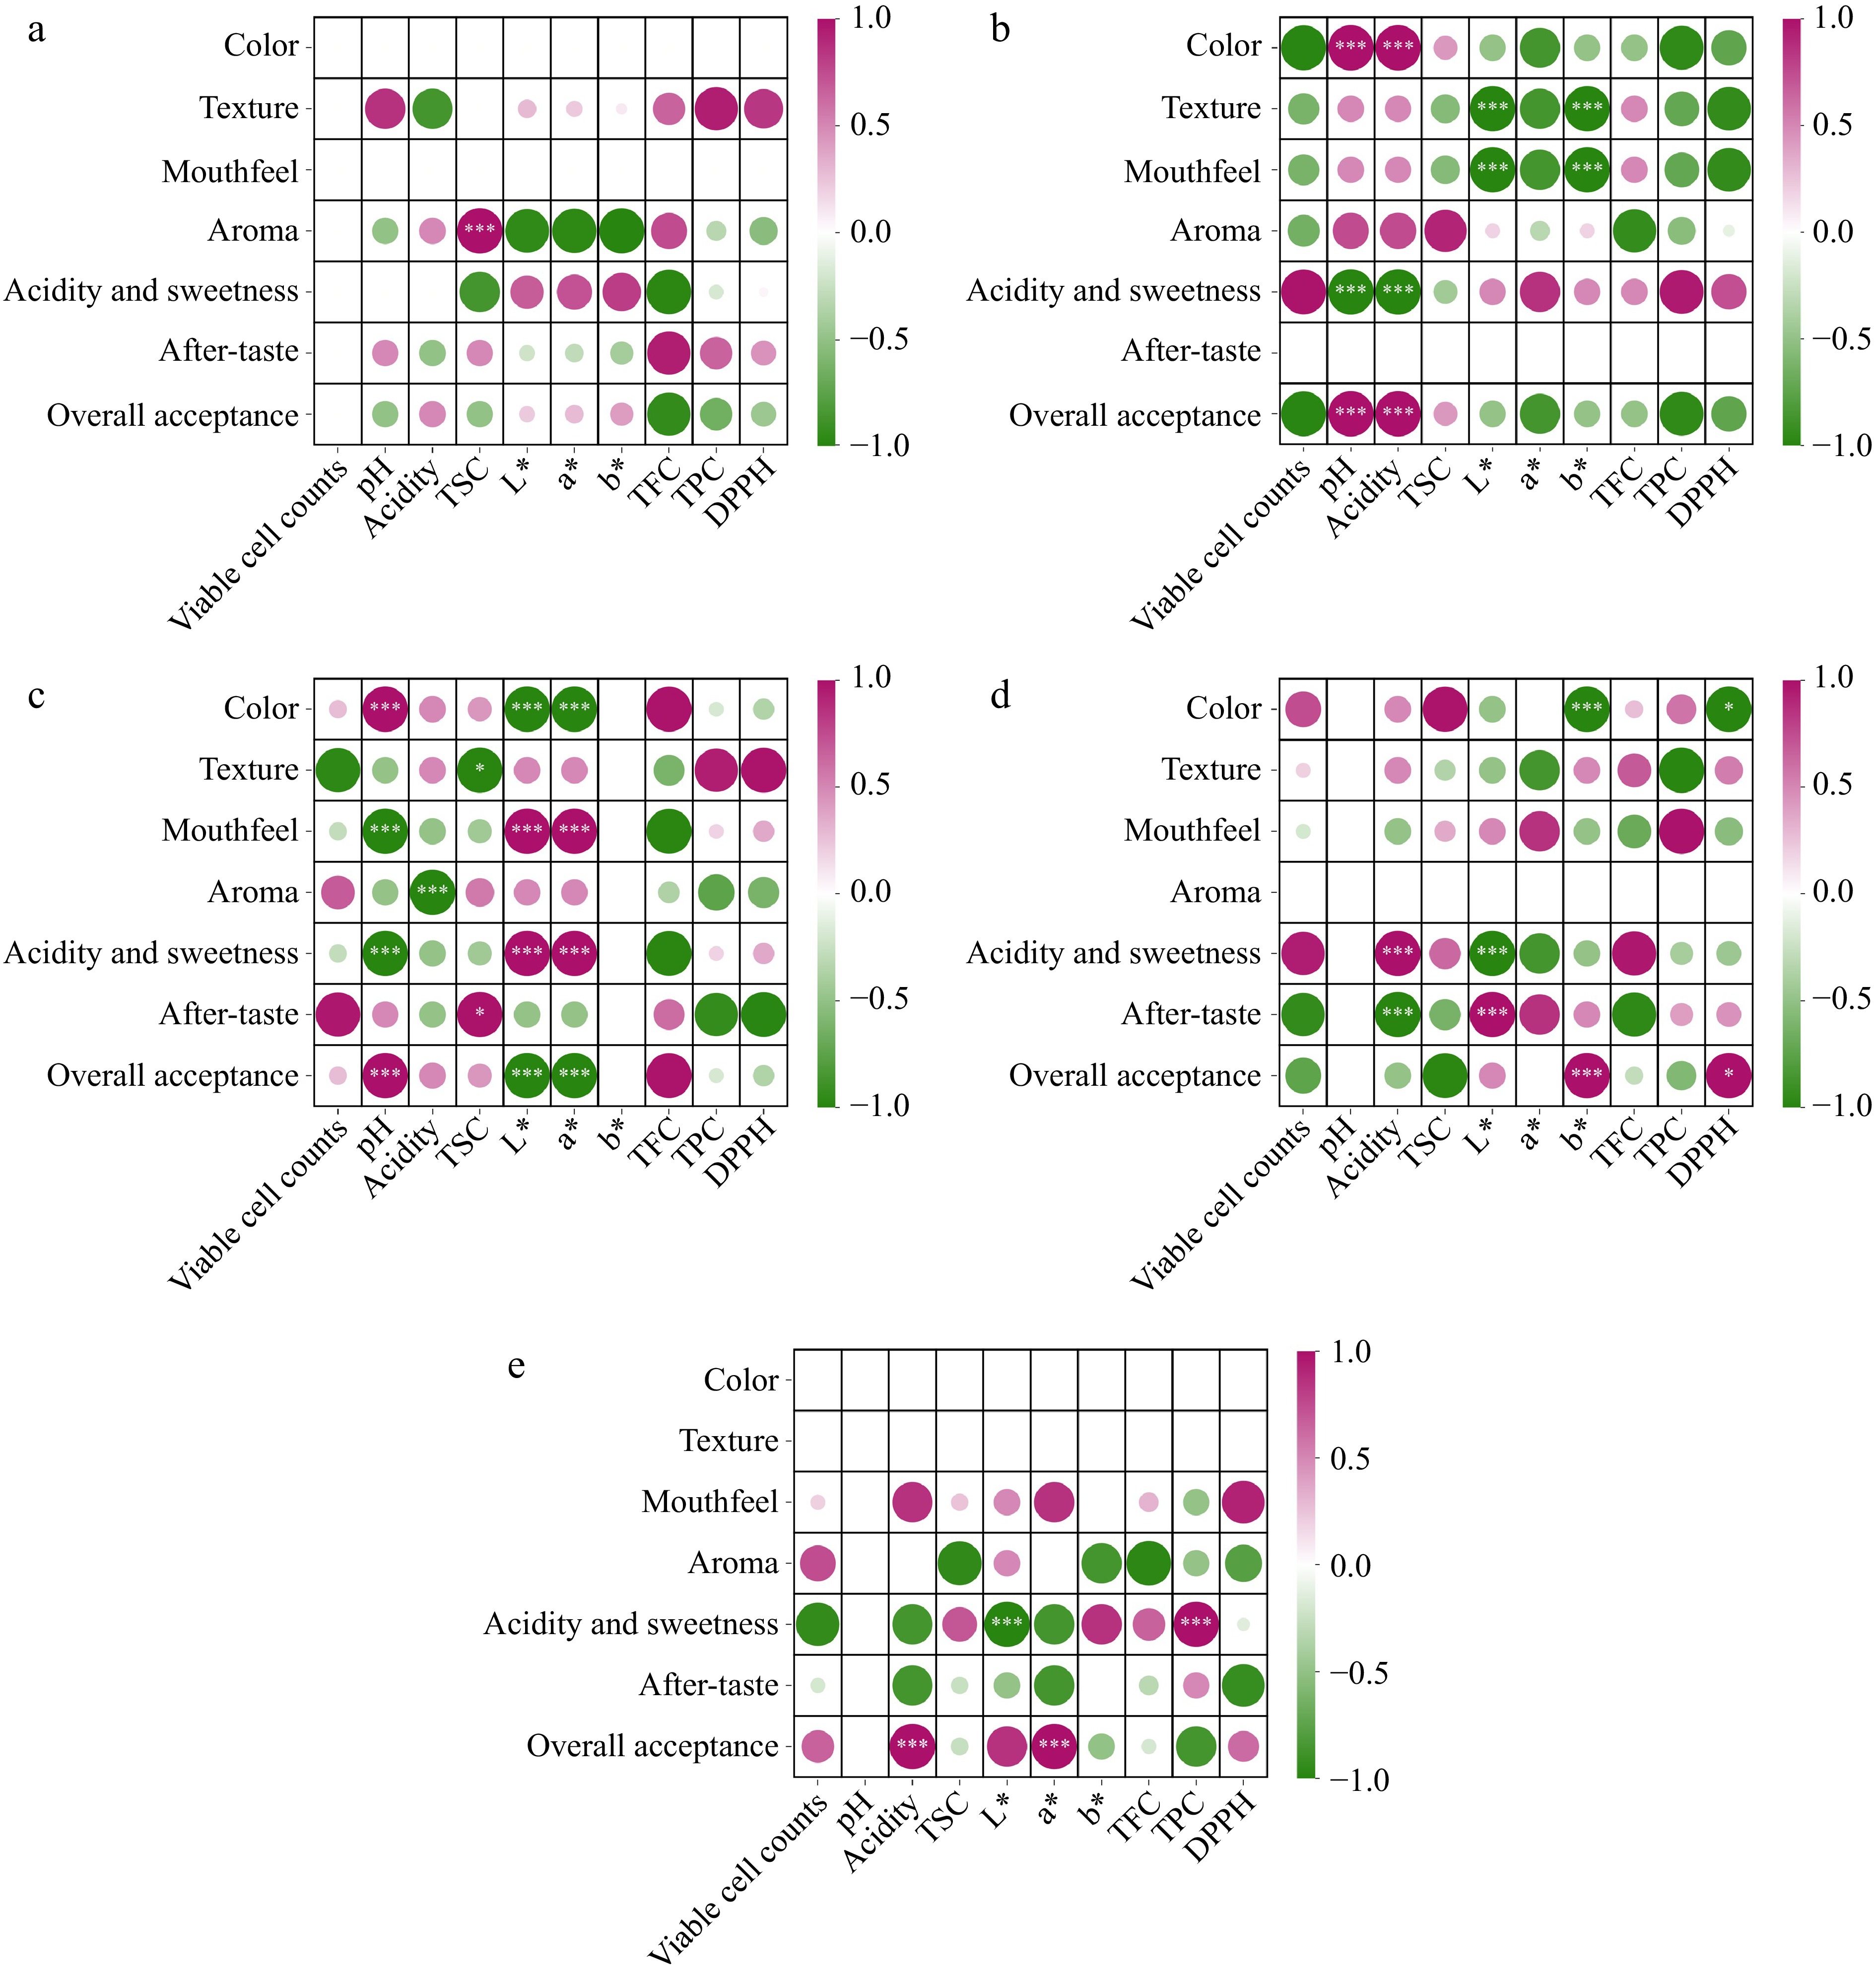
Figure 6.
Double matrices heatmap of correlation analysis between quality indices and sensory evaluations of different fermenting times. (a) 0 h, (b) 24 h, (c) 48 h, (d) 72 h, (e) 96 h. The color bar ranged from green to pink, representing a correlation relationship from negative to positive. * indicates significant mark (p < 0.05), ** indicates significant mark (p < 0.01), *** indicates significant mark (p < 0.001).
Figures
(6)
Tables
(0)