-
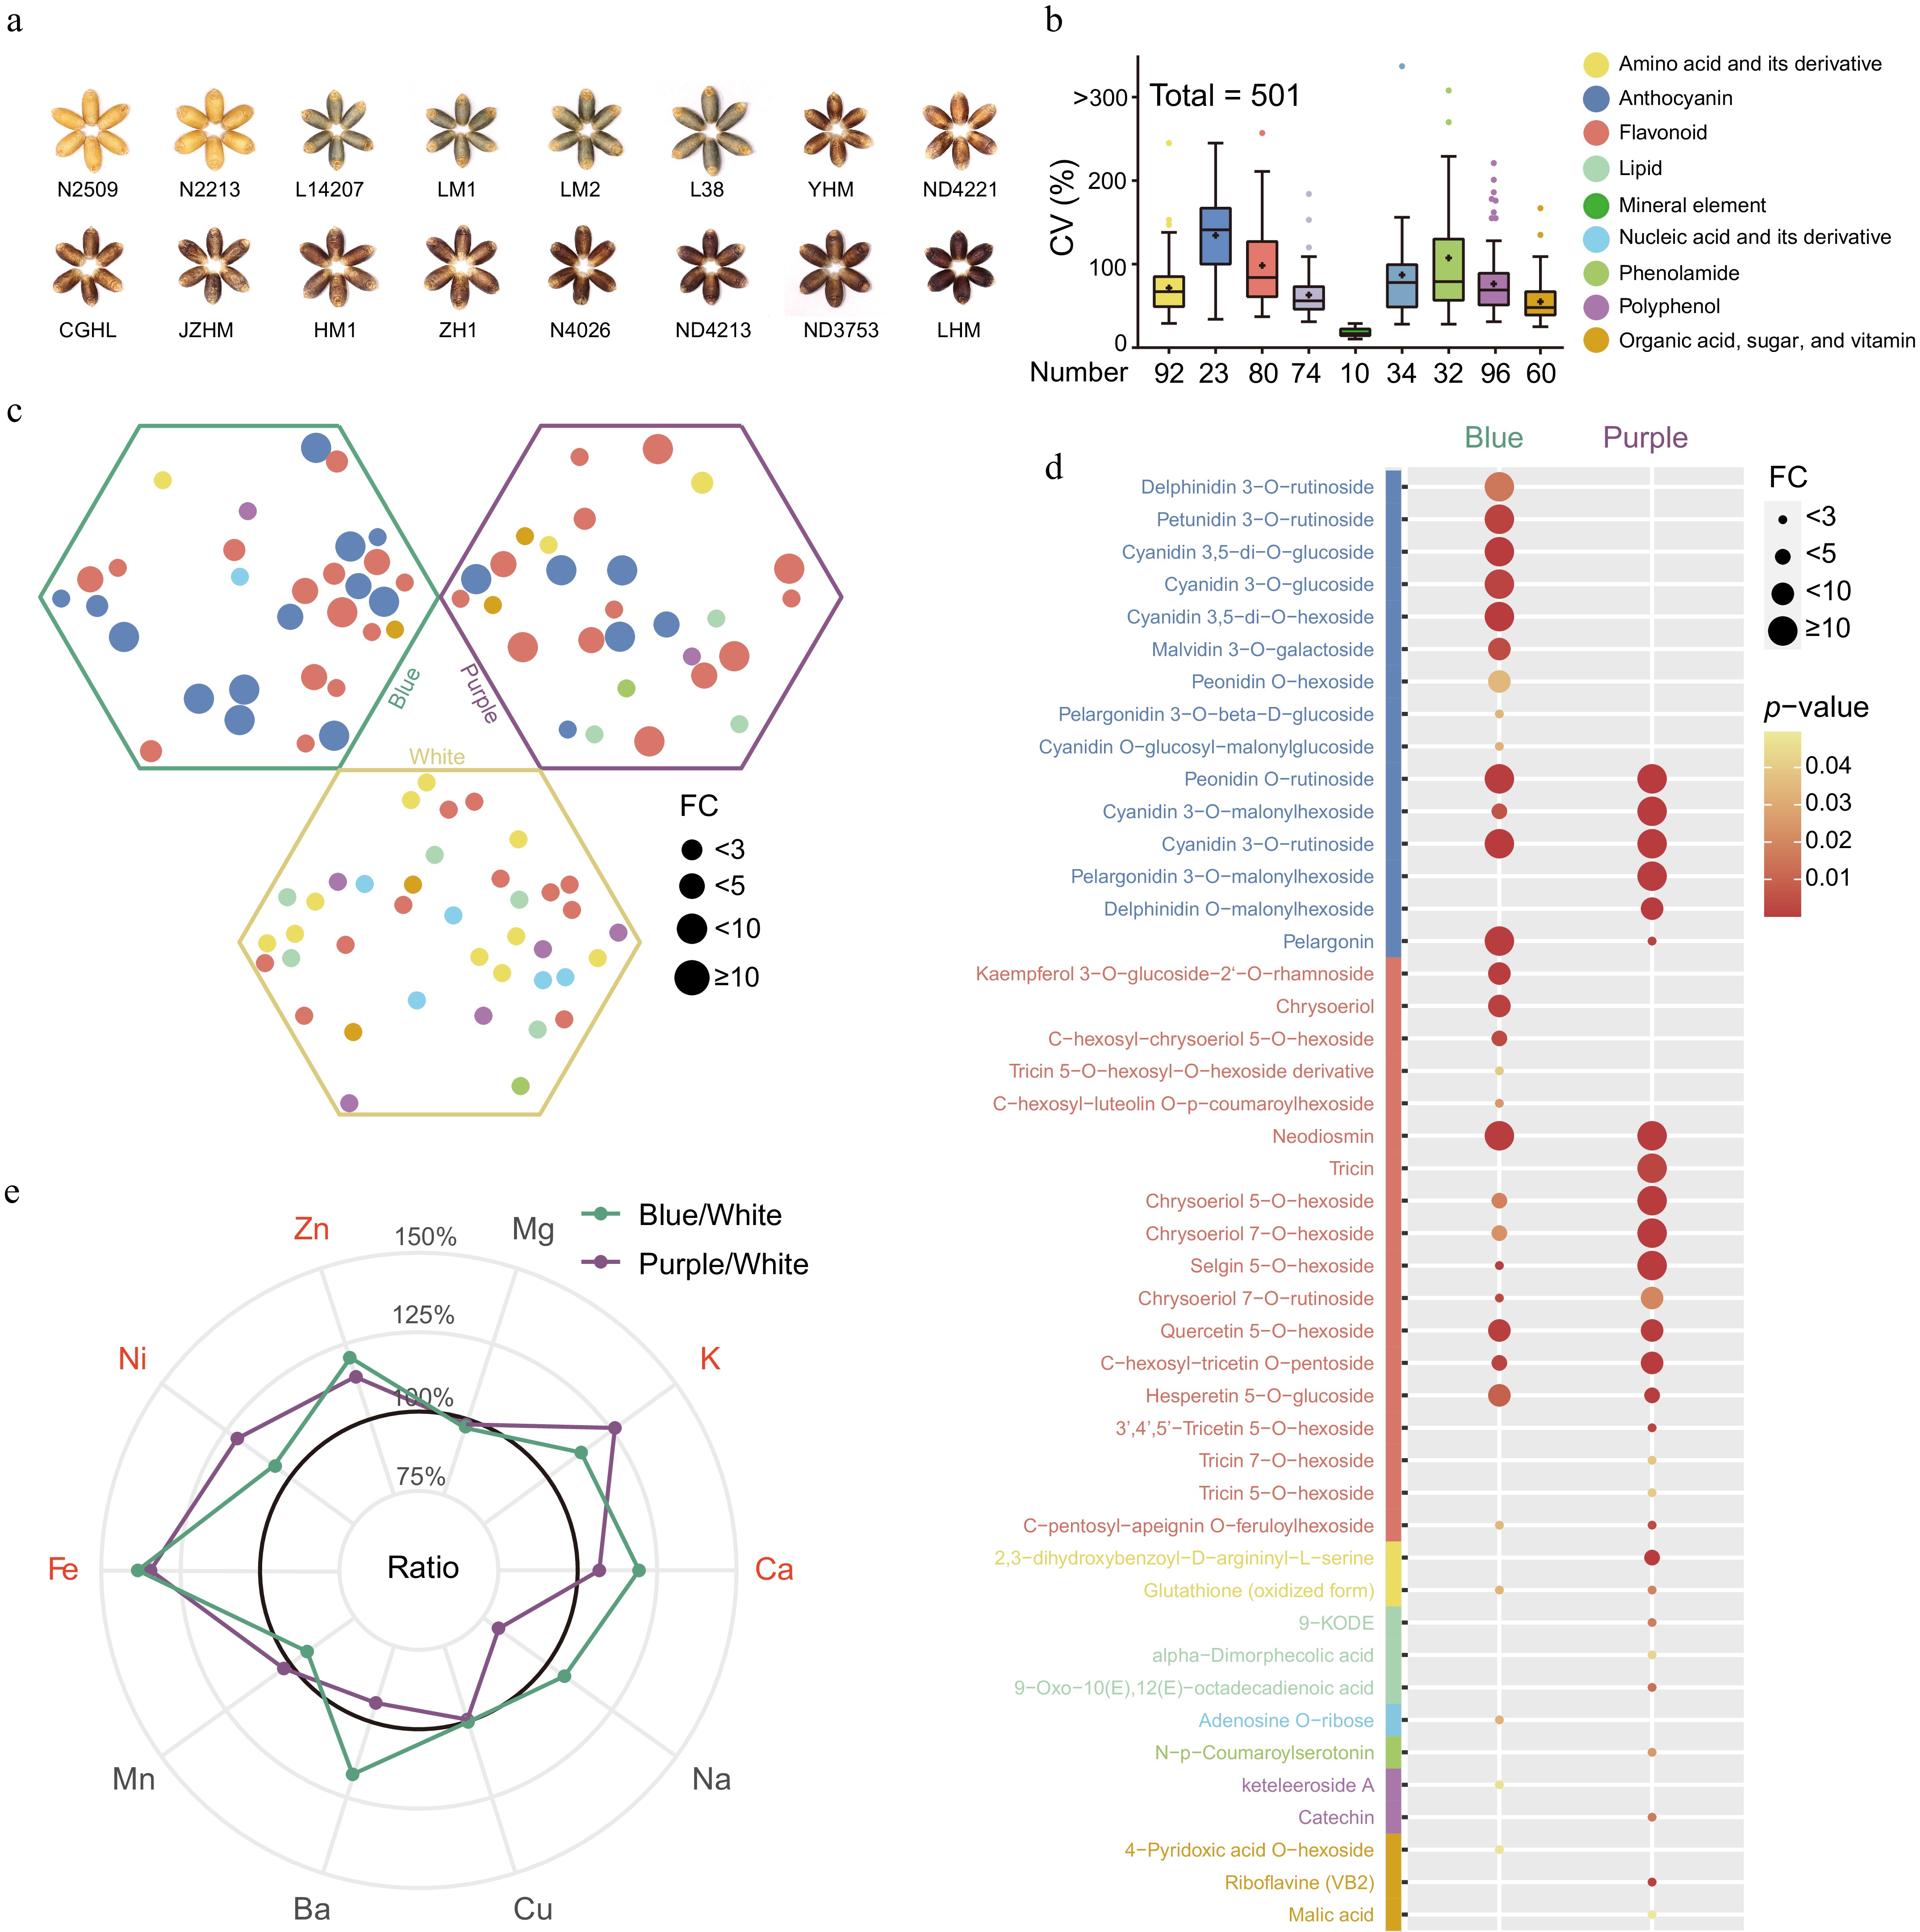
Figure 1.
(a) The mature grains of 16 different color wheat varieties were used in this study. (b) Representation of nutrient class, quantity of each class, and the associated coefficient of variation (CV) distribution. + represents the average CV of these nutrients. Colors represent the classification of the corresponding nutrient. (c) Differential nutrients rich in mature wheat grains of three colors. Statistical significance determined by Student's t-test (p-value < 0.05). The hexagons represent the nutrients rich in the corresponding wheat varieties. Different colors labelled as in Fig. 1b. (d) Detailed information on nutrients rich in colored wheat. (e) Comparison of ten mineral elements in mature colored wheat grains with white wheat. The mineral elements marked in red represent that colored wheat concentration were higher than white wheat.
-
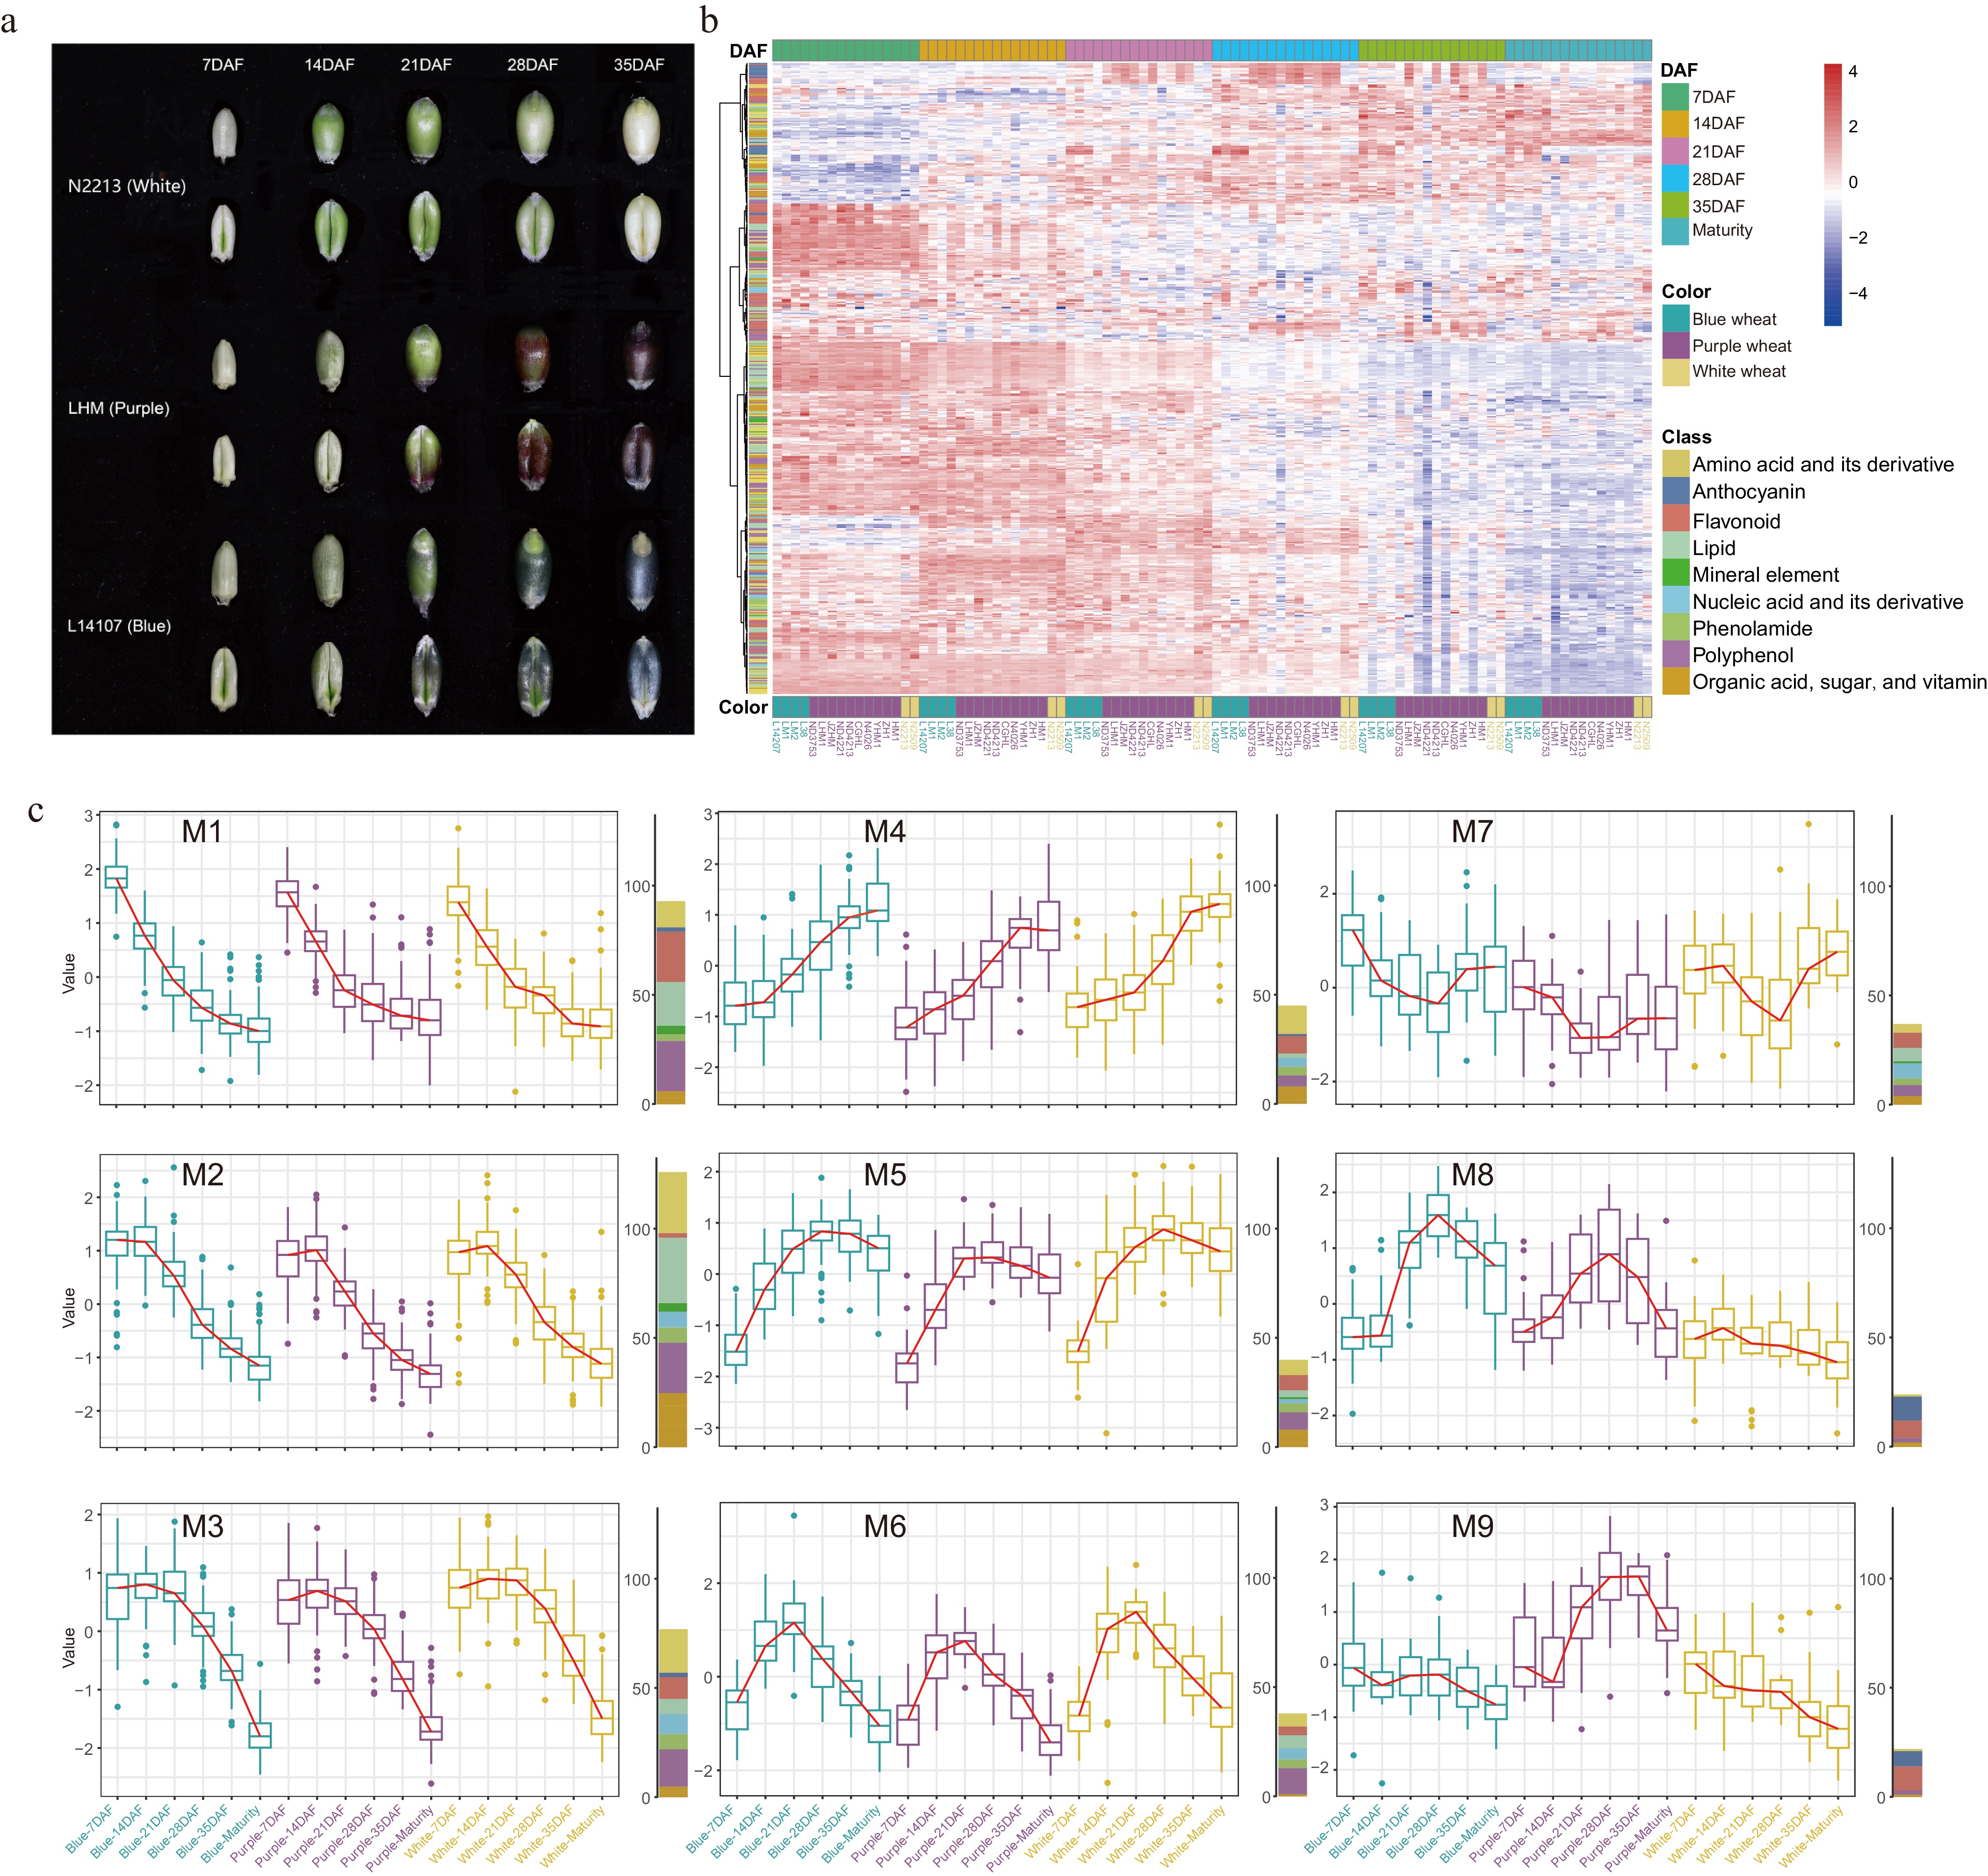
Figure 2.
(a) Changes in grain phenotypes in grain filling stage of wheat with different colors. (b) Hierarchical clustering heatmap of all nutrients among the three wheat varieties during the grain filling and maturity. (c) The nine changing trends in nutrient content in the three colors of wheat during the grain filling and maturity.
-
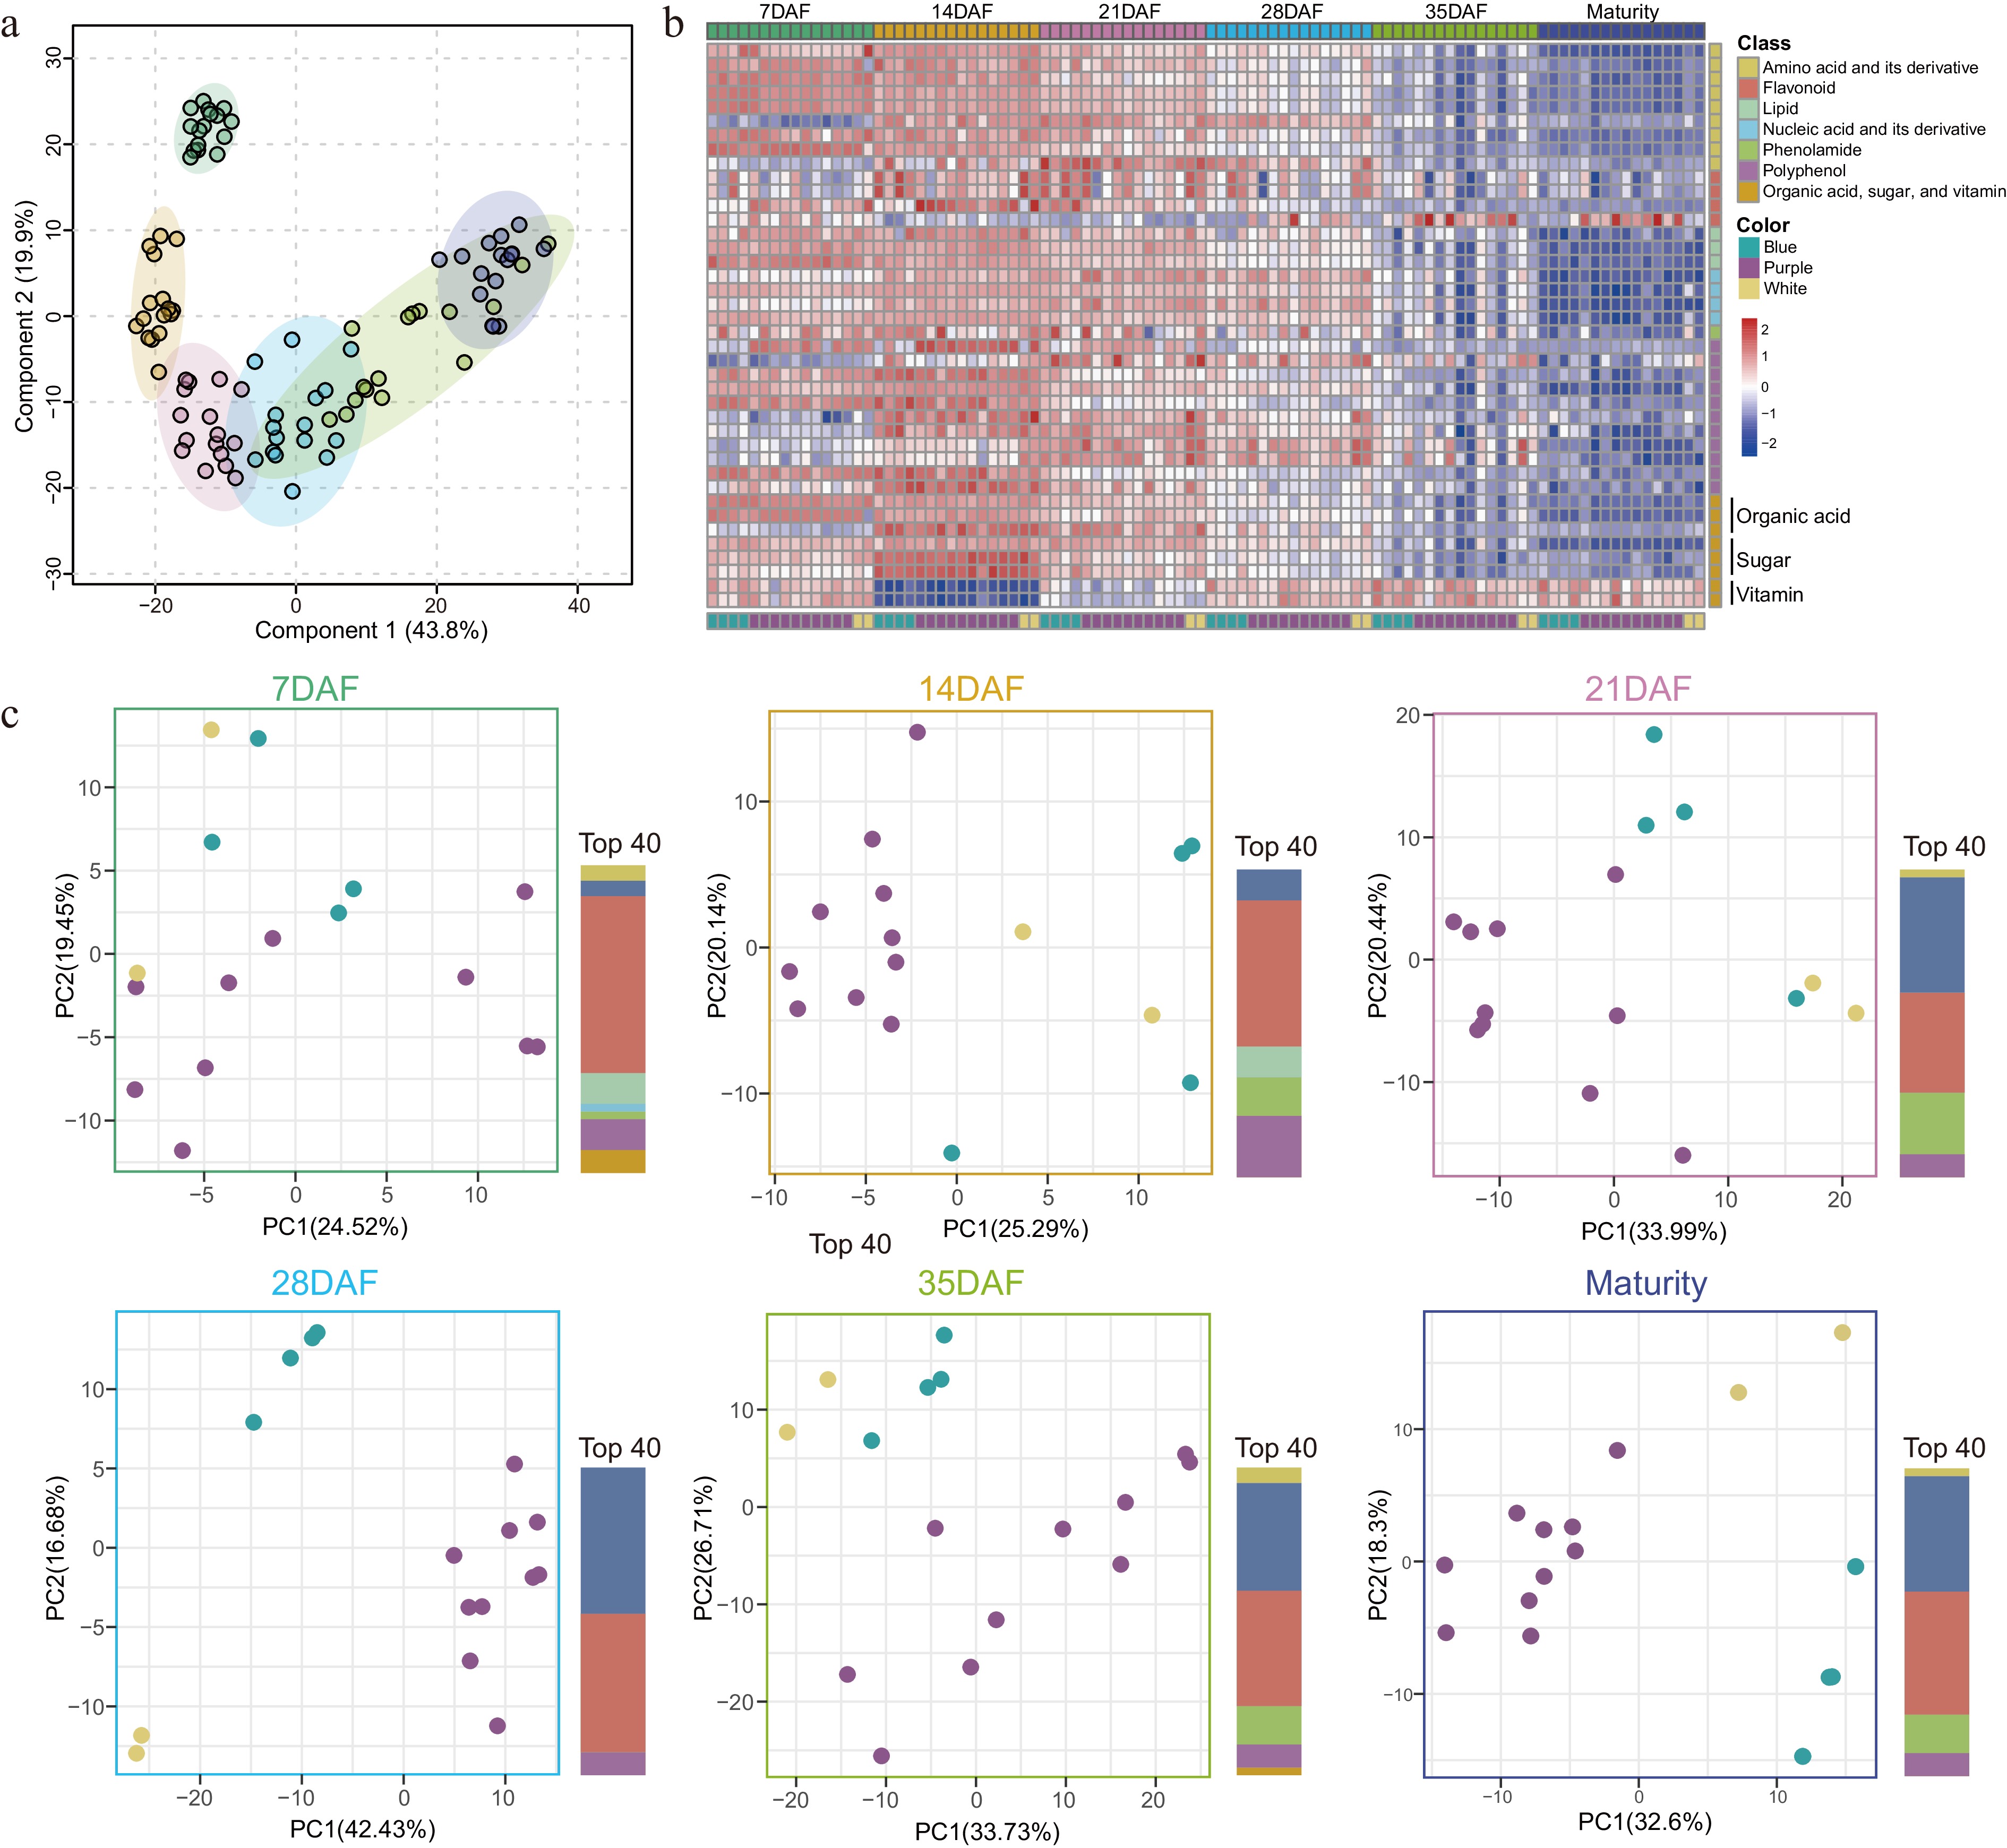
Figure 3.
(a) Partial least squares discriminant analysis (PLS-DA) of the nutrients detected in samples of each of the six stages of all wheat varieties. The data have been normalized and represent the mean values obtained from three biological replicates of each sample. (b) The accumulation levels of the top 40 contributors identified in PLS-DA in different varieties as well as during the grain filling and maturity. (c) Perform PCA analysis on grains at six stages during grain filling and maturity. The histogram on the right represents the number and class of top 40 contributors. The colors used in (a) correspond to the six stages during grain filling and maturity color labels in (b) and (c).
-
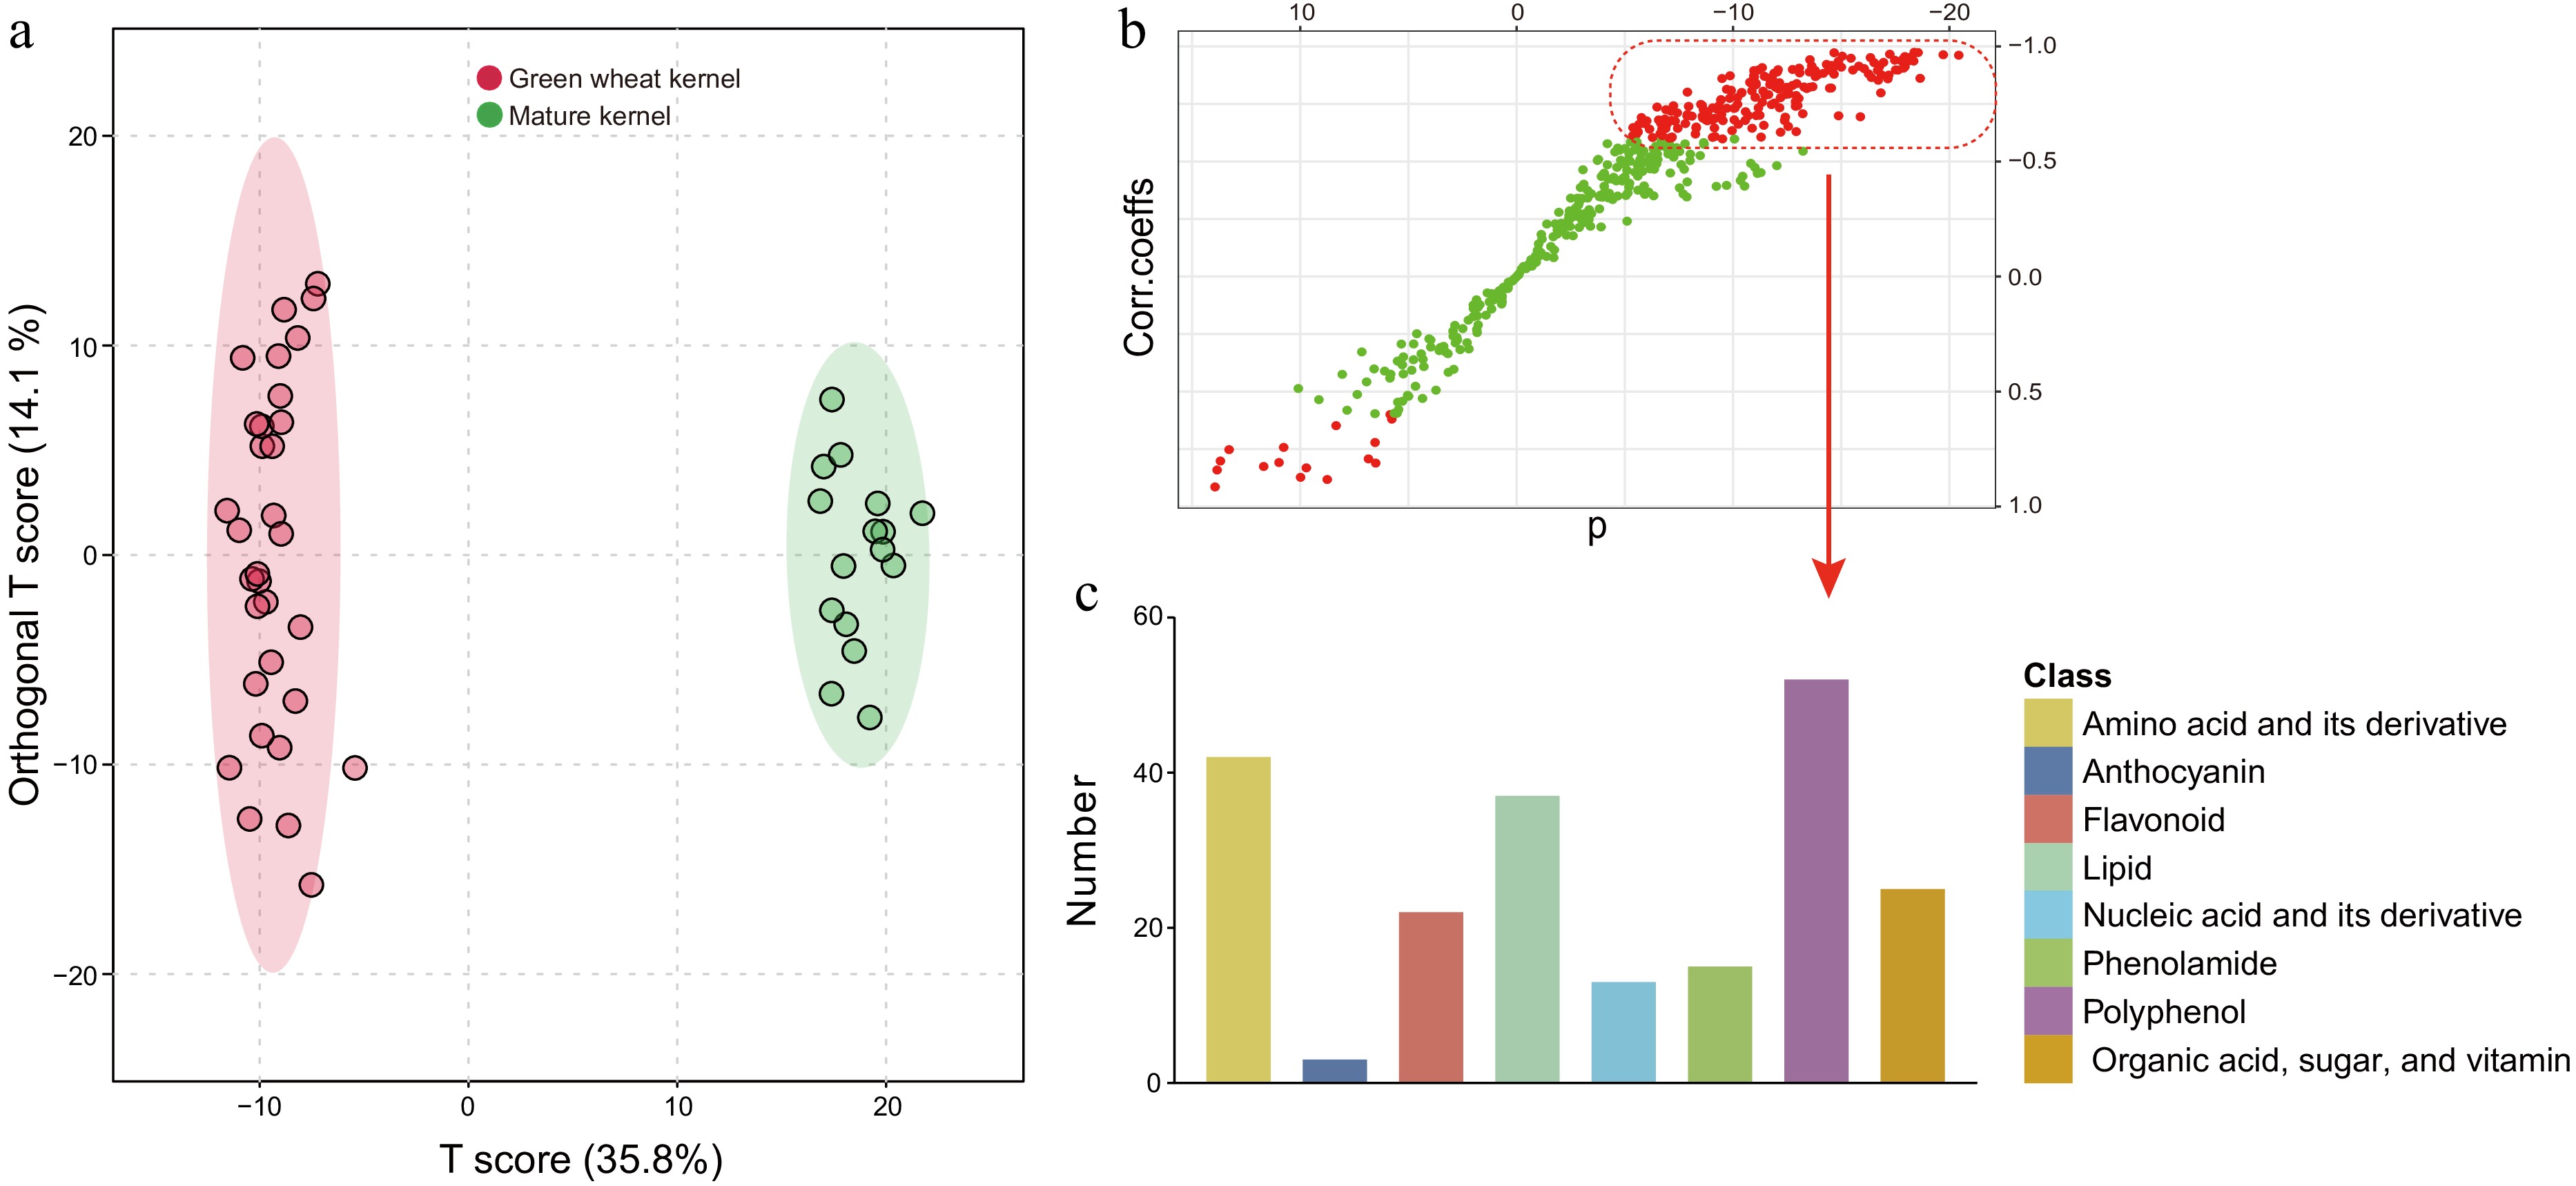
Figure 4.
(a) An orthogonal partial least-squares discriminant analysis (oPLS-DA) score plot of a comparison between the green wheat kernel group and the mature grain group. (b) A corresponding S-plot. The model was validated (Q2 = 0.973, R2Y = 0.99), and the data used in B were Pareto-standardized from the raw data (Supplementary Fig. S2). Variables with VIP (variable importance in the projection) > 1.0 are highlighted in red. (c) The classes and corresponding numbers of nutrients are within the red dashed box.
-
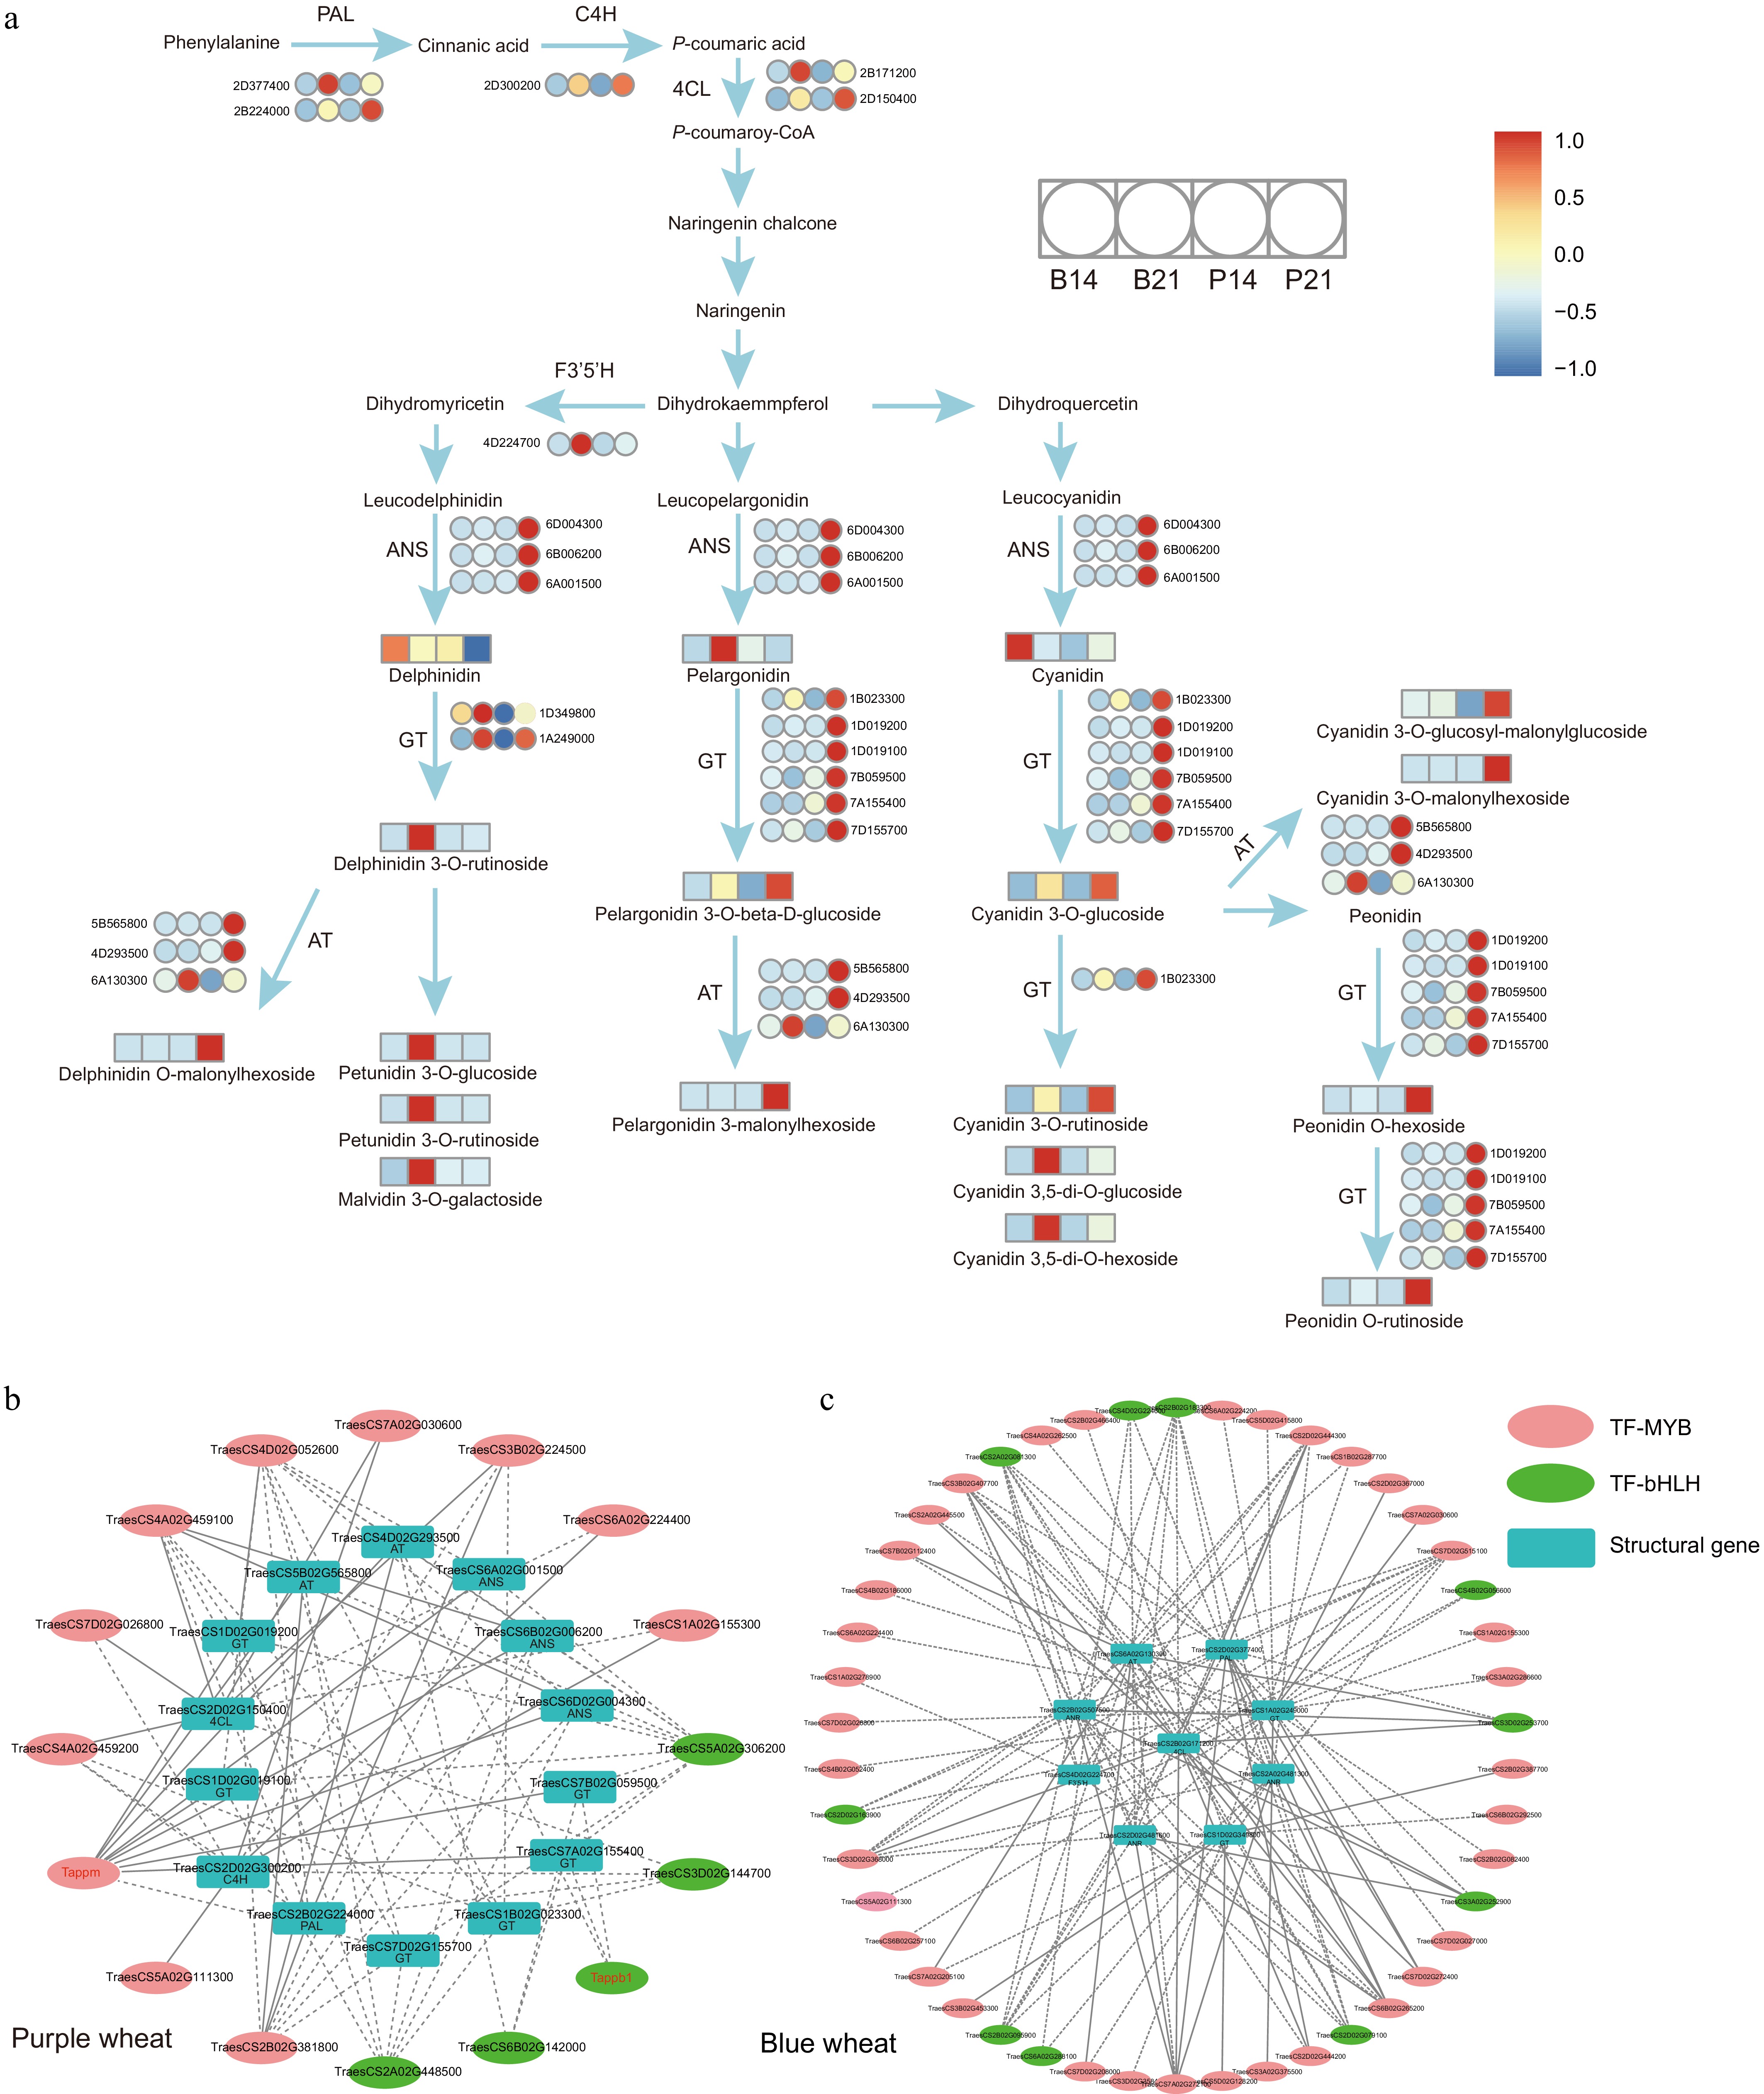
Figure 5.
(a) Proposed anthocyanin biosynthesis pathway in colored wheat grain. The color scale from blue to red in the heatmap indicates the the expression of corresponding genes (or the relative contents of nutrients) ranging from low to high in colored wheat. The full gene/enzyme names and expression level are shown in Supplementary Table S13. (b), (c) Regulatory network between anthocyanin-related genes and transcription factors. Different color ovals represent different types of transcription factors, while rectangles indicated structural genes. A dotted line suggests that transcription factors were significantly correlated with the expression of anthocyanin-related genes. The solid line indicates that the transcription factor binding site exist upstream of the 2KB coding region of the structural gene (TFBS relScore > 0.9, p-value < 0.01, calculated by TFBSTools v1.20.0 R packages). Red font represents genes that have been reported.
Figures
(5)
Tables
(0)